Abstract
A defining characteristic of cancer malignancy is invasion and metastasis 1. In some cancers (e.g. glioma 2), local invasion into surrounding healthy tissue is the root cause of disease and death. For other cancers (e.g. breast, lung, etc.), it is the process of metastasis, in which tumor cells move from a primary tumor mass, colonize distal sites and ultimately contribute to organ failure, that eventually leads to morbidity and mortality 3. It has been estimated that invasion and metastasis are responsible for 90% of cancer deaths 4. As a result, there has been intense interest in identifying the molecular processes and critical protein mediators of invasion and metastasis for the purposes of improving diagnosis and treatment 5.
A challenge for cancer scientists is to develop invasion assays that sufficiently resemble the in vivo situation to enable accurate disease modeling 6. Two-dimensional cell motility assays are only informative about one aspect of invasion and do not take into account extracellular matrix (ECM) protein remodeling which is also a critical element. Recently, research has refined our understanding of tumor cell invasion and revealed that individual cells may move by elongated or rounded modes 7. In addition, there has been greater appreciation of the contribution of collective invasion, in which cells invade in strands, sheets and clusters, particularly in highly differentiated tumors that maintain epithelial characteristics, to the spread of cancer 8.
We present a refined method 9 for examining the contributions of candidate proteins to collective invasion 10. In particular, by engineering separate pools of cells to express different fluorescent proteins, it is possible to molecularly dissect the activities and proteins required in leading cells versus those required in following cells. The use of RNAi provides the molecular tool to experimentally disassemble the processes involved in individual cell invasion as well as in different positions of collective invasion. In this procedure, mixtures of fluorescently-labeled cells are plated on the bottom of a Transwell insert previously filled with Matrigel ECM protein, then allowed to invade "upwards" through the filter and into the Matrigel. Reconstruction of z-series image stacks, obtained by confocal imaging, into three-dimensional representations allows for visualization of collectively invading strands and analysis of the representation of fluorescently-labeled cells in leading versus following positions.
Keywords: Medicine, Issue 58, cancer, cell invasion, imaging, retroviral labeling, RNAi, 3D, Matrix, Matrigel, ECM
Protocol
1. Retroviral labeling of cells with fluorescent proteins
Plate retroviral packaging cells (e.g. Phoenix) out at 0.25 x 10⁶ cells per well of a 6-welldish in 10% fetal bovine serum (FBS)/DMEM.
Transfect cells with retroviral DNA 48 hours later cells using Effectene according to the manufacturers' instructions.
Rinse wells twice with medium 24 hours later, then add 1.5 ml of 10% FBS/DMEM per well.
Collect packaged virus in tissue culture medium 48 hours later by pipetting and transferring to 2 mL microcentrifuge tubes.
Centrifuge at 1600 rpm for 5 min to pellet any cells.
Remove supernatant to a clean tube and store at -80°C.
Cells to be retrovirally transduced are plated out at 1.5 x 10⁵ cells per well of a 6 well dish and placed in a humidified incubator at 37°C overnight.
The next day, remove the media from the cells and add 1 ml of virus stock supplemented with 4 μl polybrene (2 mg/mL) to each well. Replace plates in incubator.
Following incubation for 5-6 hours, add 2 ml 10% FBS/DMEM to each well and plates are replaced in 37°C inbubator overnight.
The next day, replace the media and allow cells 24 hours before adding appropriate selective media.
When confluent (which depends on the growth rate of the cells, and efficiency of the retroviral transduction, but typically takes from 4-14 days), trypsinize cells and sort for fluorescence using non-transduced cells as a reference, collect and pool cells with fluorescence greater than non-transduced cells and freeze aliquots at -80° C for future use.
2. Inverse Matrigel invasion assay
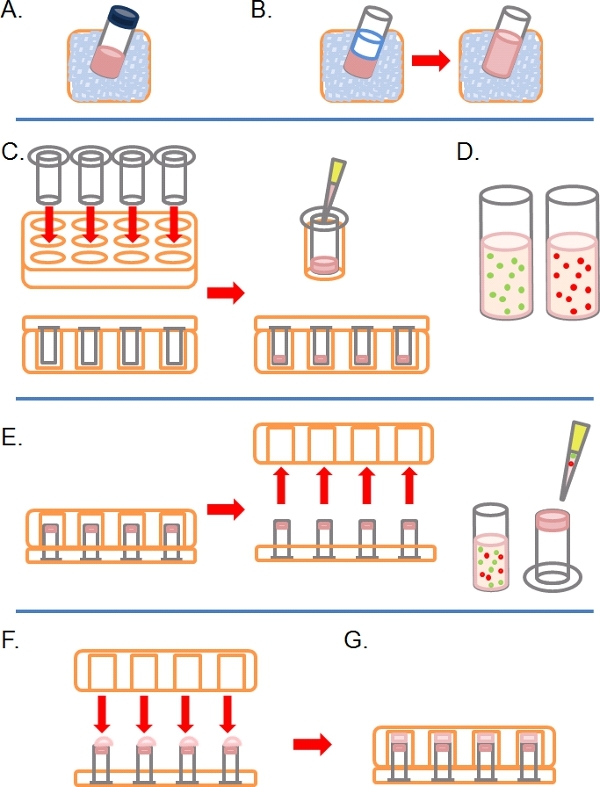
Slowly thaw an aliquot of complete Matrigel (i.e. containing growth factors) on ice (Figure 1A).
Once defrosted, dilute Matrigel 1:1 in ice cold PBS (along with any other additional treatments at 2x concentration in the PBS prior to dilution; Figure 1B). To make it easier to handle Matrigel before polymerization, all plasticware (e.g. tips, tubes, etc.) should be ice cold.
Insert as many 8 micron pore 6.5 mm diameter uncoated Transwells as required into the wells of a 24 well tissue culture plate, then carefully pipette 100 μl of the diluted Matrigel into the wells and leave to incubate for ˜30 mins at 37°C to solidify (Figure 1C).
During this time, prepare one or more fluorescently-labeled cell suspensions at between 1 to 4 x 10⁵ cells per ml, depending on cell line, from each pre-treated condition (e.g. siRNA, drug treatment) in their normal growth medium (Figure 1D).
When the Matrigel has solidified, invert the Transwells and pipette 100 μl of the cell suspension onto the upward facing underside of the filter (Figure 1E).
Carefully cover the Transwells with the base of a 24 well tissue culture plate, making contact with each droplet of cell suspension (Figure 1F).
Incubate the plate in the inverted state for 4 hours to allow for cell attachment (Figure 1G).
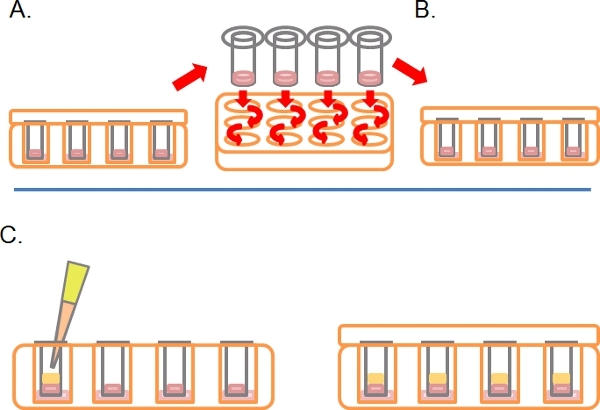
Following this time, turn the plates right-side-up and wash each Transwell by sequential dipping into 2 x 1 ml serum free medium (Figure 2A).
Leave the Transwells in a third well containing any drugs or treatments required (Figure 2B).
Gently pipette 100 μl of 10% FBS/DMEM plus chemoattractant (e.g. EGF at 25 ng/ml) into the Transwell on top of the solidified Matrigel/PBS mixture, replace the lid and incubate for 3-5 days at 37°C with 5% CO2 (Figure 2C).
3. Staining and visualization
Cells expressing fluorescent proteins can skip the steps below prior to confocal microscopy
To image non-fluorescent cells invading Matrigel , place Transwells in fresh 24 well dishes and pipette 1 ml of 4 μM Calcein AM stain solution on top of each Matrigel plug, allowing it to spill over the sides and stain from the top and bottom. Calcein AM (acetoxymethyl ester of calcein) is a live cell dye that stains the entire cells green and requires no fixation.
Incubate 1 hour at 37°C in 5% CO2 humidified atmosphere, at which point cells are fully stained and ready to be imaged by confocal microscopy.
Alternatively, non-fluorescent cells invading Matrigel may be fixed and stained as described below in 3.5 to 3.9.
Transfer each Transwell to a fresh 24-well plate. Overlay 1 ml of 4% para-formaldehyde/0.2% Triton-X 100.
Incubate at room temperature for 0.5 hour.
Remove fixative and wash 3 times with 1 ml PBS.
Remove cytoplasmic RNA with 30 min RNase treatment using 100 μg/ml RNase. Wash 2 times with PBS.
For visualization add 0.01 mg/ml Propidium Iodide (PI) diluted in PBS and leave at room temperature in the dark for 0.5 hour. Wash 3 times with PBS. At this stage, PI stained transwell can be kept at room temperature in the dark for at least 1 month.
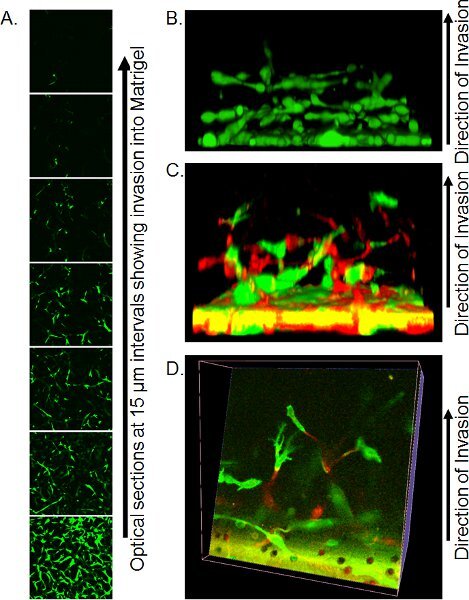
Precise imaging methods by confocal microscopy are dependent upon available resources. Using an inverted confocal microscope, place Transwell with a small amount of residual PBS onto large coverslip (ensure no bubbles are present) over non-immersion 20 X objective and capture optical sections every 10-15 μm from the bottom of the matrigel plug. Individual optical slices can be used to quantify the extent of invasion (Figure 3A) or to build into 3-dimensional objects using appropriate software such as Volocity (Figure 3B).
4. Representative Results
An example of a Z-series of optical slices is shown in Figure 3A. In this instance, cells were stained with Calcein AM and the number of cells invading up from the filter can be seen to decrease with distance. Quantification of invasion can be done by analyzing the ratio of Calcein AM positive pixels to negative pixels at each interval, or by using the fixation/staining method detailed above and counting PI positive nuclei at each position. One advantage of Calcein AM staining is that 3-dimensional reconstructions of cell invasion can be assembled using software such as Volocity, giving a visual depiction of the mode of invasion (Figure 3B). If cells are labeled by expression of fluorescent proteins, then the positions of each color cell can be visualized in 3-dimensional reconstructions, either viewed from the side (Figure 3C) or by making slices through the reconstruction (Figure 3D).
 Figure 1. Schematic diagram of steps involved in setting up inverse invasion assay. A) Matrigel ECM thawed on ice. B) Matrigel is diluted 1:1 with PBS containing any drug treatments at twice final concentration. C) Transwell inserts are placed into multiwell plates, and Matrigel pipetted into each. D) Cell suspensions made at desired concentration. E) Once the Matrigel has set, the plate is inverted and removed, cells are plated onto the underside filter of the Transwell inserts. F) In the inverted position, the multiwall plate is carefully placed over Transwell inserts, making contact with the cell suspension. G) Cells are allowed to adhere to the filter for 4 hours.
 Figure 2. Continuation of the schematic diagram for the inverse invasion assay. A) Once cells have adhered, dip each Transwell into serum-free media twice to remove loose cells. B) Place washed Transwell into a final well containing media plus treatments as required. C) Media containing chemoattractant (e.g. 10% fetal bovine serum) with treatments as required is carefully layered onto Matrigel.
 Figure 3. Representative images of results of inverse invasion assay. A) Optical sections of cells stained with Calcein AM invading Matrigel, taken at 15 μm intervals by confocal microscopy. B) Reconstruction of a 3-dimensional reconstruction of cell invasion from a stack of confocal Z-series images, viewed from the side. Reprinted from reference 10. C) Three-dimensional reconstruction of GFP and RFP-labeled cells invading Matrigel viewed from the side. D) Optical slice through the 3-dimensional reconstruction of GFP and RFP-labeled cells. Reprinted from reference 10.
Discussion
Matrigel invasion assays have traditionally been set up with cells placed onto a layer of extracellular matrix protein with chemoattractant-induced motility towards and through a filter at the bottom. Invasiveness was scored as a function of how many cells could be counted on the underside of the filter. Although practically there is little difference with the “inverse” invasion assay described above, there is considerably more information about the process of invasion that can be determined by visualizing invading cells as they move up and through the Matrigel. For example, in addition to being able to visualize differently labeled cells to examine leading versus following cells in collective invasion (Figure 3C and 3D), using this method allows cells to be fixed, permeabilized, stained and then imaged for protein levels or subcellular distribution. The resolving power of this method would be limited by the baseline signal intensity of the fluorescent protein expressing cells and the sensitivity of the imaging apparatus, especially if two or more colors were to be imaged. Mixing Matrigel with dye-quenched (DQ) collagen (which is so heavily conjugated with fluorescein that the fluorescent signal is quenched until proteolysis separates collagen fragments thereby lowering the local fluorescein concentration and permitting fluorescence) is another multi-color application of this method that would allow for visualization of ECM degradation by invading cells. Using high-content screening devices fitted with confocal imaging and environmental chambers would enable this procedure to be transformed into a 4-d real time invasion assay, which could also be multiplexed with additional measures such as ECM degradation. Combined with automation, it would also be possible to design high throughput cell-based assays that could be used to screen chemical libraries for novel anti-invasion targets.
A number of factors should be carefully controlled when using this inverse invasion assay. Cell density can affect the apparent efficiency of invasion, so equal numbers of cells should be used in each replicate. Treatments that alter cell number (e.g. cytotoxic drugs) may appear to change the extent of invasion, but may also reflect this cell density influence. Although numerous cell lines work well in this assay, not all invade well enough to be useful, so each should be evaluated on a case-by-case basis. The length of time required to achieve a level of invasion adequate to provide a good signal window should be empirically determined for each cell line, the MDA MB 231 cell line works well at 4 days after the start of the assay, for example. In addition, some of the conditions suggested (e.g. 8 micron pore size for Transwell inserts) may not suit every cell line, and some optimization may be required. The extra value derived from this method when compared to the standard Matrigel invasion assay make it worthwhile establishing in any lab seriously interested in studying the processes involved in 3-D invasion.
Disclosures
The authors have nothing to disclose.
Acknowledgments
Funding for this research is from Cancer Research UK.
References
- Olson MF, Sahai E. The actin cytoskeleton in cancer cell motility. Clin. Exp. Metastasis. 2008;26:273–287. doi: 10.1007/s10585-008-9174-2. [DOI] [PubMed] [Google Scholar]
- Hoelzinger DB, Demuth T, Berens ME. Autocrine factors that sustain glioma invasion and paracrine biology in the brain microenvironment. J. Natl. Cancer. Inst. 2007;99:1583–1593. doi: 10.1093/jnci/djm187. [DOI] [PubMed] [Google Scholar]
- Chaffer CL, Weinberg RA. A perspective on cancer cell metastasis. Science. 2011;331:1559–1564. doi: 10.1126/science.1203543. [DOI] [PubMed] [Google Scholar]
- Hanahan D, Weinberg RA. The Hallmarks of Cancer. Cell. 2000;100:57–70. doi: 10.1016/s0092-8674(00)81683-9. [DOI] [PubMed] [Google Scholar]
- Francia G, Cruz-Munoz W, Man S, Xu P, Kerbel RS. Mouse models of advanced spontaneous metastasis for experimental therapeutics. Nat. Rev. Cancer. 2011;11:135–141. doi: 10.1038/nrc3001. [DOI] [PMC free article] [PubMed] [Google Scholar]
- Hooper S, Marshall JF, Sahai E. Tumor cell migration in three dimensions. Methods. Enzymol. 2006;406:625–643. doi: 10.1016/S0076-6879(06)06049-6. [DOI] [PubMed] [Google Scholar]
- Croft DR, Olson MF. Regulating the conversion between rounded and elongated modes of cancer cell movement. Cancer Cell. 2008;14:349–351. doi: 10.1016/j.ccr.2008.10.009. [DOI] [PubMed] [Google Scholar]
- Wolf K. Multi-step pericellular proteolysis controls the transition from individual to collective cancer cell invasion. Nat. Cell. Biol. 2007;9:893–904. doi: 10.1038/ncb1616. [DOI] [PubMed] [Google Scholar]
- Hennigan RF, Hawker KL, Ozanne BW. Fos-transformation activates genes associated with invasion. Oncogene. 1994;9:3591–3600. [PubMed] [Google Scholar]
- Scott RW. LIM kinases are required for invasive path generation by tumor and tumor-associated stromal cells. J. Cell. Biol. 2010;191:169–185. doi: 10.1083/jcb.201002041. [DOI] [PMC free article] [PubMed] [Google Scholar]


