Abstract
To study the transformation of fluctuations in filtration rate into tubular fluid chloride concentration oscillations alongside the macula densa, we have developed a mathematical model for tubuloglomerular feedback (TGF) signal transduction along the pars recta, the descending limb, and the thick ascending limb of a short-looped nephron. The model tubules are assumed to have compliant walls and thus a tubular radius that depends on the transmural pressure difference. Previously it has been predicted that TGF transduction by the thick ascending limb (TAL) is a generator of nonlinearities: if a sinusoidal oscillation is added to a constant TAL flow rate, then the time required for a fluid element to traverse the TAL is oscillatory in time but nonsinusoidal. The results from the new model simulations presented here predict that TGF transduction by the loop of Henle is also, in the same sense, a generator of nonlinearities. Thus this model predicts that oscillations in tubular fluid alongside the macula densa will be nonsinusoidal and will exhibit harmonics of sinusoidal perturbations of pars recta flow. Model results also indicate that the loop acts as a low-pass filter in the transduction of the TGF signal.
Keywords: kidney, biofluiddynamics, NaCl transport, fluid-structure interactions, nonlinear dynamics
Introduction
The single-nephron glomerular filtration rate (SNGFR) is regulated by multiple mechanisms (20). Among the most important of these mechanisms is the tubuloglomerular feedback (TGF) system, a negative feedback loop in which the chloride ion concentration is sensed downstream in the nephron tubule by the macula densa (MD) cells. Experiments in rats have demonstrated that nephron flow and related variables (e.g., intratubular fluid pressure and solute concentrations) may exhibit regular, TGF-mediated oscillations with a period of ~30 s (5, 17), or, in the case of spontaneously hypertensive rats, irregular oscillations that appear to have characteristics consistent with deterministic chaos (5, 24).
In a series of studies (10, 15, 16), we have used a mathematical model of the TGF loop to help explain phenomena found in TGF-mediated oscillations. Those oscillations arise in part through a transduction process along the thick ascending limb (TAL). This process involves the transformation of variations in tubular fluid flow rate into NaCl concentration variations in tubular fluid alongside the MD. Owing to the nonlinearity of that transformation, harmonic frequencies are generated and contribute to the complexity of TGF-mediated oscillations.
In our previous TGF models (e.g., Ref. (14)), we represented the TAL in detail, because our model investigations indicated that the transduction process in the TAL exhibits a number of features, such as the generation of harmonics that transform sinusoidal waves into waves that are periodic but nonsinusoidal, that may help explain phenomena found in regular and irregular oscillations that are mediated by TGF (10, 15, 16). In contrast, other components of the TGF loop were represented in our previous TGF models by means of simple, phenomenological representations: the actions of the proximal tubule and descending limb of a short-looped nephron were modeled by a linear function that represents glomerulartubular balance in proximal tubule and water absorption from the descending limb (14). Because water and NaCl transport along the proximal tubule and descending limb impacts fluid flow rate and NaCl transport along the TAL, those transport processes may affect TGF mediation. Thus, the signal transduction properties of those nephron segments, and the extent to which they generate or suppress harmonic frequencies, are worthy of investigation. A better understanding of those properties should clarify of the roles of those segments in the regulation of SNGFR and water and electrolyte delivery to the distal nephron.
In all the above models, the TAL or loop of Henle is represented as a rigid tubule, and flow rate in the tubule is prescribed as a function of predicted SNGFR (13); that is, hydrodynamic pressure is not computed. To assess the extent to which the nonlinearity exhibited by our models is an artifact of the rigid tubule formulation, in a recent study (12), we analyzed a mathematical model of the TAL that includes pressure-driven flow and compliant walls. We found that this more inclusive model exhibits essentially the same nonlinear phenomena as the rigid tubule model; moreover, some of these phenomena are more marked in the compliant tubule model than in the rigid tubule model.
Water and NaCl transport along the proximal tubule and descending limb segments of the loop of Henle may impact fluid flow rate and NaCl transport along the TAL. To investigate the extent to which those transport processes affect TGF mediation, in the present study we have developed a mathematical model for TGF signal transduction in a short loop nephron having compliant tubular walls. The dynamic model was used to study signal transduction behaviors in segments of the nephron that are typically inaccessible by in vivo experimental techniques.
MATHEMATICAL MODEL
Model formulation
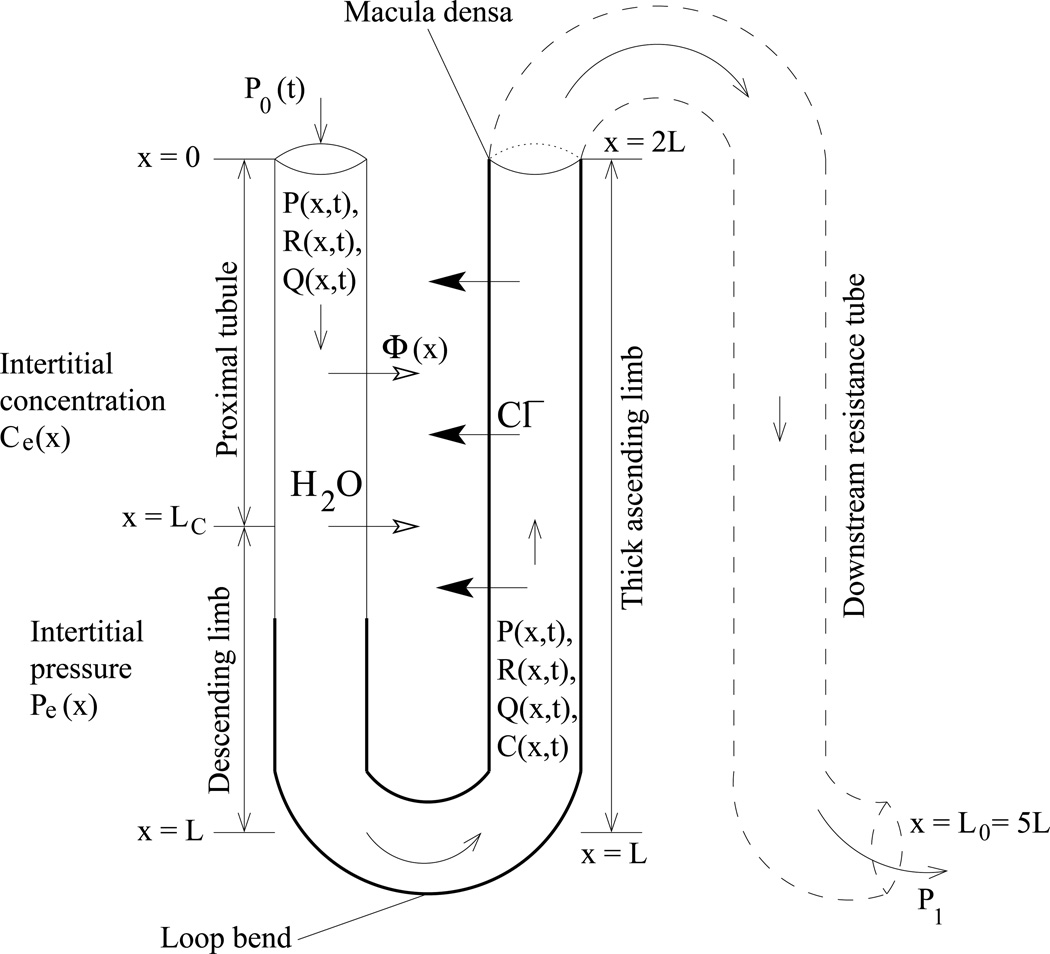
To study the signal transduction properties of the proximal tubule, descending limb, and TAL of a short loop of Henle, we used a mathematical model of a compliant tubule that predicts tubular fluid, fluid pressure, and tubular radius as functions of time and space. Because tubular fluid pressure at the MD is not well-characterized, we impose outflow pressure boundary conditions by modeling a longer tubule: the model represents the short loop of Henle and the contiguous and composite collecting duct, extending in space from x = 0 at the entrance to the proximal tubule to x = L0 at the end of the collecting duct. In rat, the hydrostatic pressure at the end of the collecting duct can be inferred to be ~1–3 mmHg, based on measurements in the interstitia, vessels, and the pelvic space (1, 3, 4). The tubular walls are assumed to be compliant, with a radius that depends on the transmural pressure gradient. To study the effects of tubular wall motions on TGF signal transduction, we represent the chloride ion (Cl−) concentration in the tubular fluid; the concentration of that ion alongside the MD is believed to be the principal tubular fluid signal for the TGF response (21). The chloride concentration is represented only along the loop, which extends in space from x = 0 at the entrance to the proximal tubule, to x = L at the loop bend, to x = 2L (L0 = 5L) at the MD. A schematic diagram for the model loop is given in Fig. 1.
Figure 1.
Schematic representation of model loop of Henle. Hydrodynamic pressure P0 = P(0, t) drives flow into loop entrance (x = 0) at time t. Oscillations in pressure result in oscillations in loop flow Q(x, t), radius R(x, t), fluid transit time T(x, t) to position x, and tubular fluid chloride concentration C(x, t).
Model equations describe intratubular fluid pressure, flow, and Cl− concentration:
| (1) |
| (2) |
| (3) |
| (4) |
Equations 1–2 model fluid motion along the model nephron as the flow of an incompressible fluid within a compliant tubule that is long relative to its radius. x is axial position along the nephron, 0 ≤ x ≤ L0, t is time, P(x, t) is the tubular fluid pressure, Q(x, t) is the tubular volume flow, R(P(x, t)) is the tubular radius, which is a function of pressure (see below), and Φ(x) is the transmural water flux, taken positive out of the tubule. Equation 1 represents Poiseuille flow, which is driven by the axial pressure gradient. Equation 2 represents fluid incompressibility and conservation. The inflow pressure P0(t) = P(0, t) is assumed to be given as a function of time t, and the outflow pressure P1 = P(L0, t) is considered fixed.
Equation 3 represents a compliant tube, the tubular luminal radius of which is assumed to vary as a function of transmural pressure difference. Pe(x) is the extratubular (interstitial) pressure, α specifies the degree of tubular compliance, and β(x) is the tubular radius when the transmural pressure difference is zero (see below).
Equation 4 represents the conservation of Cl− in tubular fluid, where C(x, t) is tubular fluid chloride concentration, Ce(x) is the extratubular (interstitial) chloride concentration, and Ro(x) is the steady-state tubular radius. The two terms inside the large pair of parentheses on the right-hand side correspond to active solute transport characterized by Michaelis-Menten-like kinetics (with maximum Cl− transport rate Vmax and Michaelis constant KM) and transepithelial Cl− diffusion (with backleak permeability κ). For the transport terms in Eq. 4, the radius is considered fixed at Ro(x), because the number of transport proteins is considered to be time-independent. Also, the Cl− concentration at the proximal tubule entrance is considered fixed: Co = C(0, t).
Parameters
Model tubular dimensions, compliance, transport parameters, and boundary conditions are given in Table 1. The descending portion of the short loop of Henle is structurally and functionally divided into four segments. The first segment extends through the cortex and corresponds to the proximal convoluted tubule. The second segment, which corresponds to the proximal straight tubule, terminates at the boundary between the outer and inner stripe (approximately 0.6 mm from the cortico-medullary boundary). For simplicity, we sometimes consider the proximal straight tubule as part of the short descending limb, although strictly speaking it is not. The third segment, which corresponds to the water-permeable segment of the short descending limb, spans the first 60% of the inner stripe. The fourth segment, which corresponds to the water-impermeable segment of the short descending limb, spans the remainder of the inner stripe.
Table 1.
Glossary
| Symbol | Description | Dimensional value | |
|---|---|---|---|
| αTAL | TAL compliance | 1.33 × 10⁻⁵ cm·mmHg−1 | |
| αDL | proximal tubule and descending limb compliance | 2.25 × 10⁻⁵ cm·mmHg−1 | |
| β0 | initial boundary value for β0,1(x) | 7.4 µm | |
| β1 | end boundary value for β0,1(x) | 5.0 µm | |
| β2 | end boundary value for β1,2(x) | 10.6 µm | |
| β3 | end boundary value for β2,3(x) | 6.775 µm | |
| Ce,o | interstitial Cl− concentration at the upper cortex | 150 mM | |
| Co | Cl− concentration at proximal tubule entrance | 160 mM | |
| κTAL | TAL chloride permeability | 1.5 × 10⁻⁵ cm/s | |
| κPCT | proximal convoluted tubule chloride permeability | 20.0 × 10⁻⁵ cm/s | |
| κPST | proximal straight tubule chloride permeability | 10.0 × 10⁻⁵ cm/s | |
| κDL | descending limb chloride permeability | 1.5 × 10⁻⁵ cm/s | |
| KM | Michaelis constant | 70 mM | |
| L0 | length of model nephron | 2.5 cm | |
| L | length of TAL or length of proximal tubule and descending limb | 0.5 cm | |
| Pe | extra-tubular (steady-state) pressure | 5.0 mmHg | |
| P1 | pressure at end of nephron | 2.0 mmHg | |
| Q0 | base-case flow into proximal convoluted tubule | 30.0 nl/min | |
| Q1 | base-case flow into proximal straight tubule | 10.0 nl/min | |
| Q2 | base-case flow at loop bend | 7.0 nl/min | |
| Φ0 | water flux along proximal convoluted tubule | ||
| Φ1 | water flux along water-permeable descending limb segment | ||
| Ro | steady-state tubular radius (µm) | ||
| Vmax,TAL | TAL maximum transport rate of chloride | 16.6 nmole·cm−2·s−1 | |
| Vmax,PCT | Proximal convoluted tubule maximum transport rate of chloride | 28.0 nmole·cm−2·s−1 | |
| Vmax,PST | Proximal straight tubule maximum transport rate of chloride | 2.5 nmole·cm−2·s−1 | |
| Vmax,DL | Descending limb maximum transport rate of chloride | 0.0 nmole·cm−2·s−1 | |
| μ | fluid viscosity | 7.2 × 10⁻³ cm·s−1 |
The lengths of the proximal convoluted tubule and the cortical TAL are each assumed to be LC = 3 mm. The total length of the proximal straight tubule and the short descending limb is assumed to be LOM = 2 mm; the length of the medullary TAL is also assumed to be LOM = 2 mm. Note that the length of the TAL is L = LC + LOM, and the length of the proximal tubule, descending limb, and TAL is 2L.
The luminal radius parameter β(x) (in µm) is a piecewise-defined function given by
| (5) |
where βi,j(x) denotes a cubic polynomial defined in x0 ≤ x ≤ x1 such that βi,j(x0) = βi and βi,j(x1) = βj, and β′(x0) = β′(x1) = 0. The parameters βi and βj are chosen such that in the time-independent steady state (when Q is constant in time and space), the model yields a target tubular radius and a target outflow pressure P(L0). xw denotes the position at which the water-impermeable segment of the descending limb begins; xw is taken to be LC + 0.6LOM.
Extratubular Cl− concentration is specified by
| (6) |
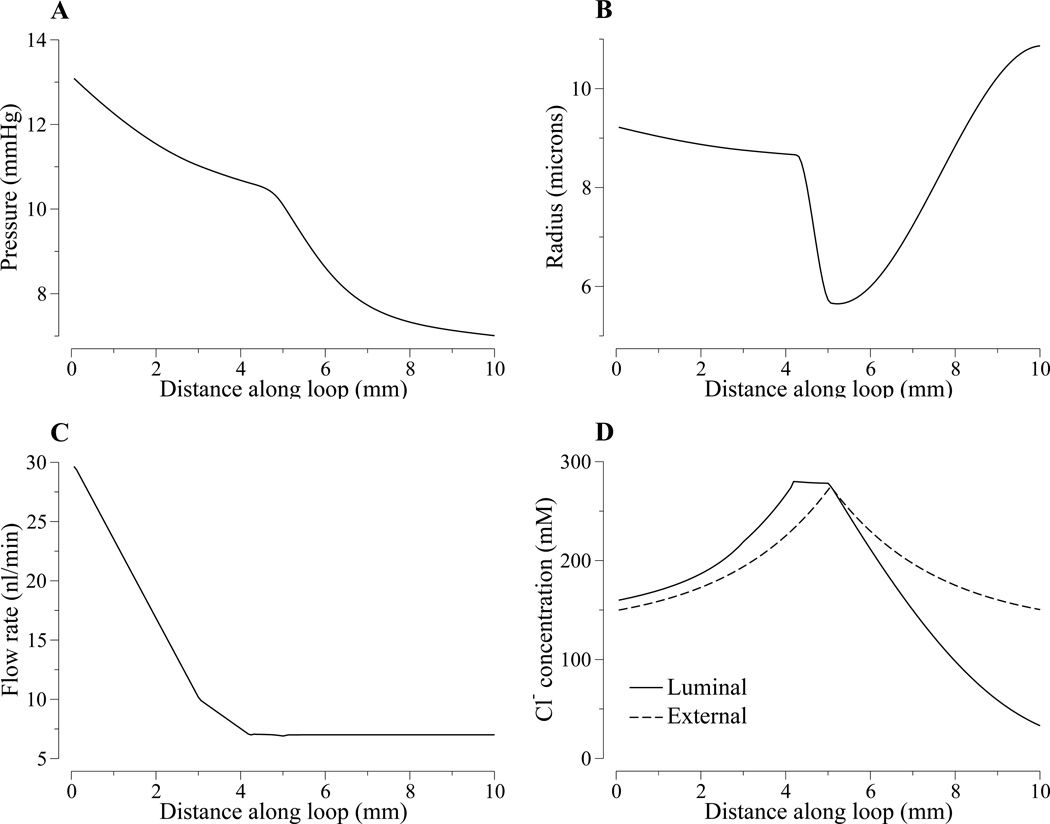
where A1 = (1 − Ce(L)/Ce,o)/(1 − exp(A3)), A2 = 1 − A1, and A3 = 2, and where Ce(2L) corresponds to a cortical interstitial concentration of 150 mM. As shown in Fig. 2, Ce(x) is symmetric around x = L, such that at a given axial level, the descending limb and the TAL interact with extratubular fluids having the same Cl− concentration.
Figure 2.
Steady-state tubular fluid pressure (panel A), luminal radius (panel B), tubular flow rate (panel C), Cl− concentration (panel C) as functions of space.
We assume an SNGFR of 30 nl/min. Micropuncture experiments have shown that approximately two-thirds of the water and NaCl are reabsorbed along the proximal convoluted tubules; thus, the water flow rate into the proximal straight tubule is 10 nl/min. As previously noted, anatomic findings have indicated that a terminal segment of the short descending limb is water impermeable (22). The TAL is known to be water impermeable. Given these considerations, the transmural water flux term Φ(x) is given as a piecewise constant function, constructed so that, together with appropriate inflow pressure and luminal radius, the model predicts a steady-state water flow rate that is consistent with the above measurements and that is ~7.0 nl/min at the loop bend (i.e., x = L):
| (7) |
The proximal convoluted tubule is assumed to have a moderate Cl− permeability of 20 × 10−5 cm/s (23), and a maximum active transport rate Vmax that yields a tubular fluid Cl− concentration of ~160 mM at the cortico-medullary boundary. The proximal tubule is assumed to be moderately NaCl permeable; the descending limb and TAL are assumed to have a low Cl− permeability of 1.5 × 10⁻⁵ cm/s (18).
Results
Steady-state behavior
The model equations (Eqs. 1–4) were solved, using parameters displayed in Table 1, by means of the numerical method described in Ref. (12). Steady-state spatial profiles of pressure, radius, flow, and concentration are shown in Fig. 2. At steady state, tubular fluid pressure decreases along the tube (panel A), and the water flux term Φ(x) determines the volumetric flow rate (panel C). Along the proximal convoluted tubule (0 ≤ x ≤ LC = 3 mm), tubular fluid flow rate decreases linearly from 30 to 10 nl/min; then, along the proximal straight tubule and the water-permeable descending limb segment (LC < x ≤ xw = 4.2 mm) from 10 to 7 nl/min. The remainder of the loop (x > xw), which includes a terminal segment of the short descending limb and the thick ascending limb, is assumed to be water impermeable; thus, tubular fluid flow remains constant at 7 nl/min. Tubular radius, exhibited in panel B, is a function of transmural pressure (Eq. 3).
Steady-state tubular fluid Cl− concentration profile is shown in Fig. 2D. As water is reabsorbed along the descending limb, tubular fluid Cl− concentration rises. The lack of smoothness in the Cl− profile at x = 4.2 mm can be explained by the sudden change in water permeability. At the loop bend (x = 5 mm), chloride permeability, κ, and maximum transport rate of chloride, Vmax, change. In the TAL, concentration decreases since Cl− ions are pumped out in order to reach the target concentration at the MD. Moreover, we can calculate the time it takes for a particle starting at the proximal tubule entrance to reach the loop bend and the MD. This transit time is given by
| (8) |
where xend is the end position of the portion of the tube where transit time is calculated. The omission of time dependence in R(x) and Q(x) in Eq. 8 indicates steady-state values. The model predicts that it takes 5.61 s to reach the loop bend and an additional 9.50 s to reach the MD (i.e., a total transit time of 15.1 s).
Responses to a step perturbation
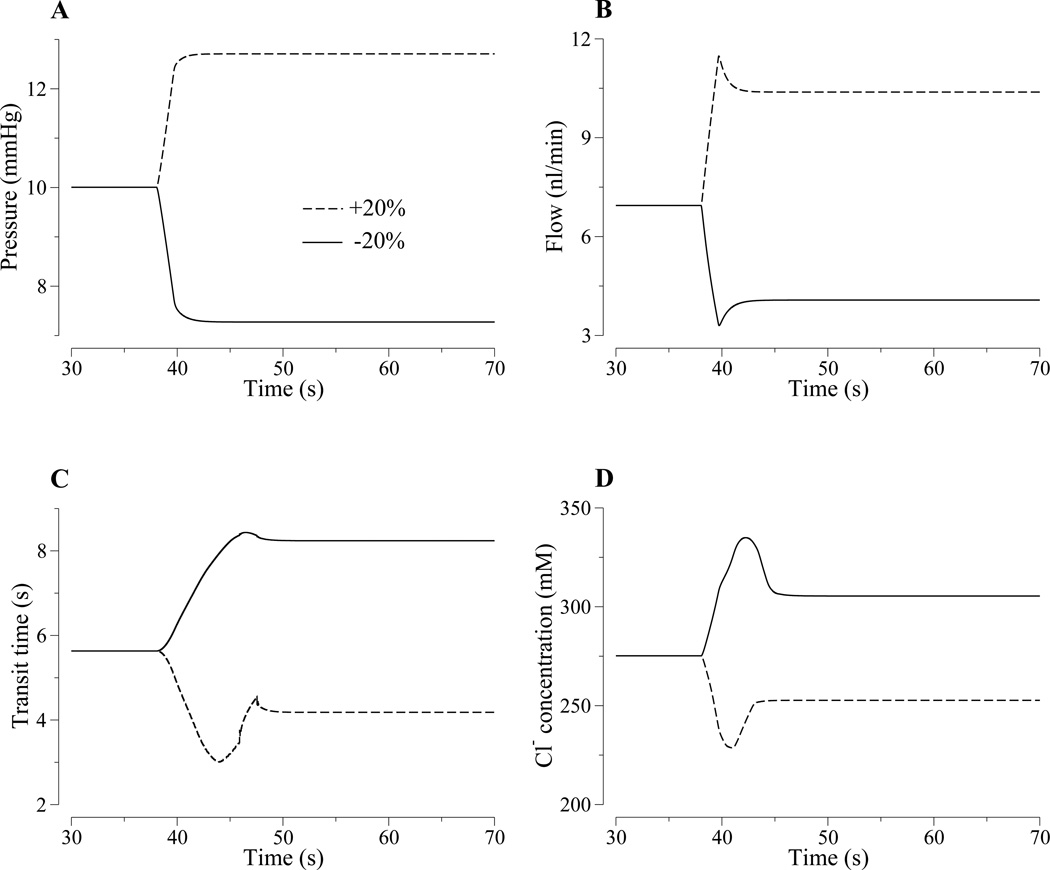
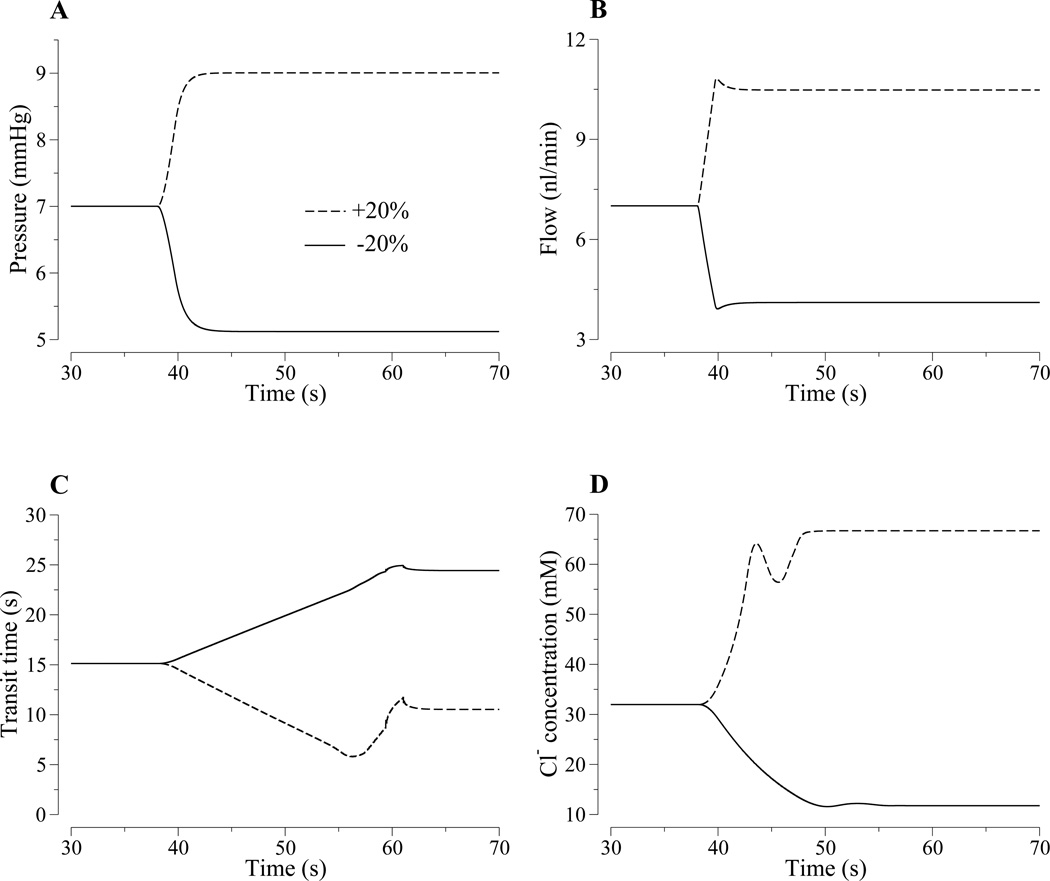
We then simulated the responses of flow, transit time, and [Cl−] at loop bend and MD to a rapid, step-like, increase or decrease in input pressure. The +20% or −20% step change in pressure at the proximal convoluted tubule entrance was approximated by a smooth rise having a duration of 3.75 s. Figures 3A and 4A show the resultant changes in pressures at the loop bend and at the MD, respectively, for the model. Figures 3B and 4B show the resultant changes in flow rates at the loop bend and at the MD, respectively. The over- and undershoots in flow during the transitions in pressure arise from adjustments in tubular radius (and hence volume) during the time interval when luminal pressure is rapidly changing.
Figure 3.
Model responses to a rapid, step-like 20% increase (dashed lines) or 20% decrease (solid lines) in proximal tubule entrance pressure. Panel A, loop-bend pressure. Panel B, loop-bend flow inflow rate. Panel C, proximal tubule and descending limb transit time. Panel D, loop-bend fluid Cl− concentration. The model predicts rapid changes in flow rate (panel B), whereas the changes in transit time (Panel C) and loop-bend [Cl−] (Panel D) are slower, more complex, and asymmetric.
Figure 4.
Model responses to a rapid, step-like 20% increase (dashed lines) or 20% decrease (solid lines) in proximal tubule entrance pressure. Panel A, MD pressure. Panel B, MD flow inflow rate. Panel C, loop transit time. Panel D, MD fluid Cl− concentration. The model predicts rapid changes in flow rate (panel B), whereas the changes in loop transit time (Panel C) and MD [Cl−] (Panel D) are slower, more complex, and asymmetric.
We then considered the transit time of a fluid particle starting at the proximal tubule entrance and reaching the loop bend at time t; that transit time, denoted TLB, is given implicitly by
| (9) |
where υ(x, t) denotes the axial speed of the tubular fluid. Similarly, we considered the transit time TMD of the a fluid particle starting at the loop bend and reaching the MD at time t:
| (10) |
The transient changes in flow and tubular radius result in a complex pattern of changes in transit times; see Figs. 3C and 4C. The initial slow rise or fall in transit-time that begins when pressure first changes reflects the fact that the amount of time that any fluid element has spent in the tubule depends on its location within the loop at the time the pressure perturbation is applied. Hence, the effects on transit time of the transient changes in flow are fully developed after a time delay that is approximately equal to the mean transit time at the new level of pressure. At those points in time, the effect of the overshoot and undershoot in flow are evident.
Figure 3D illustrates the resultant changes in loop-bend [Cl−], which depends on both the transit time and the transport characteristics of the proximal tubule and descending limb. Loop-bend [Cl−] is higher with the −20% pressure perturbation, because along the proximal tubule and descending limb, tubular fluid [Cl−] is increased by water reabsorption. Thus, at lower inflow pressure and lower tubular flow rate, tubular fluid [Cl−] more nearly equilibrates with the more concentrated external fluid.
Changes in MD [Cl−], illustrated in Fig. 4D, are qualitatively different from the corresponding changes at the loop bend. The +20% pressure perturbation results in a rise in MD [Cl−], followed by a dip, before settling at the higher concentration. In this case, the MD [Cl−] curve is similar in shape to the transit time curve in Fig. 4C except that the MD [Cl−] curve is inverted and scaled. The dip in MD [Cl−] at around t ≈ 45 s arises from the corresponding dip in the loop-bend [Cl−], as can be seen from a comparison between the dashed curves in Figs. 3D and 4D. The shape of the MD [Cl−] response is also similar to that obtained in a compliant TAL model in a previous study (12), except that there was no concentration dip in that model because it only represents the TAL. In contrast, the MD [Cl−] response to the 20% reduction in input pressure is smaller. In this case, flow was reduced into the range where MD [Cl−] approaches the static-head limit, the limit in which tubular fluid [Cl−] reaches a minimum value (along the terminal portion of the TAL) because Cl− backleak balances TAL cell absorption. Hence, at low flow, the response of MD [Cl−] is determined by both transit time and the inability of the TAL cells to further reduce luminal [Cl−].
Responses to sinusoidal perturbations
In the next set of simulations, we study the characteristics of the transduction of oscillations in tubular fluid pressure into oscillations in tubular fluid Cl− concentration. We superimposed a sinusoidal perturbation onto the steady-state inflow pressure at the proximal tubule entrance (x = 0)
| (11) |
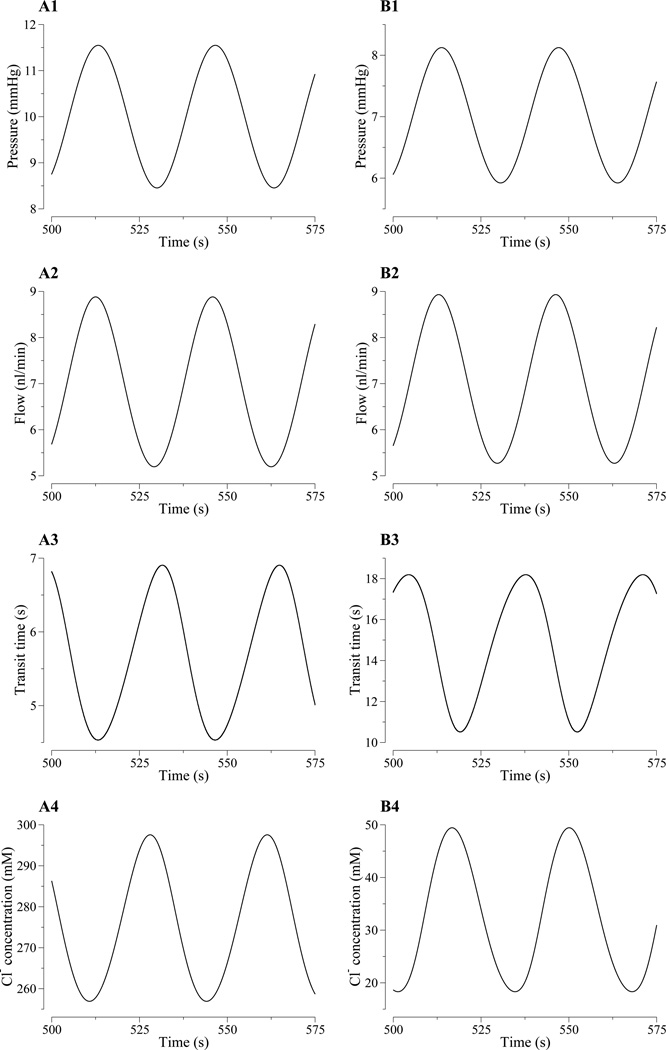
where P̄0 = 13 mmHg, Pp = 1.5 mmHg, and f = 30 mHz. The resulting oscillations in tubular fluid pressure, tubular fluid flow, and Cl− concentration are illustrated in Fig. 5. Columns A and B correspond to the the loop bend and the MD, respectively. The corresponding power spectra are shown in Fig. 6.
Figure 5.
Row 1: Oscillations, as functions of time, in key model variables when a sinusoidal perturbation is applied to input pressure. Results were obtained for at the loop bend (column A) and MD (column B). Sinusoidal, or approximately sinusoidal oscillations were obtained for tubular fluid pressure (row 1, columns A and B) and flow rate (row 2). Nonsinusoidal oscillations were obtained for transit times (row 3), and [Cl−] (row 4).
Figure 6.
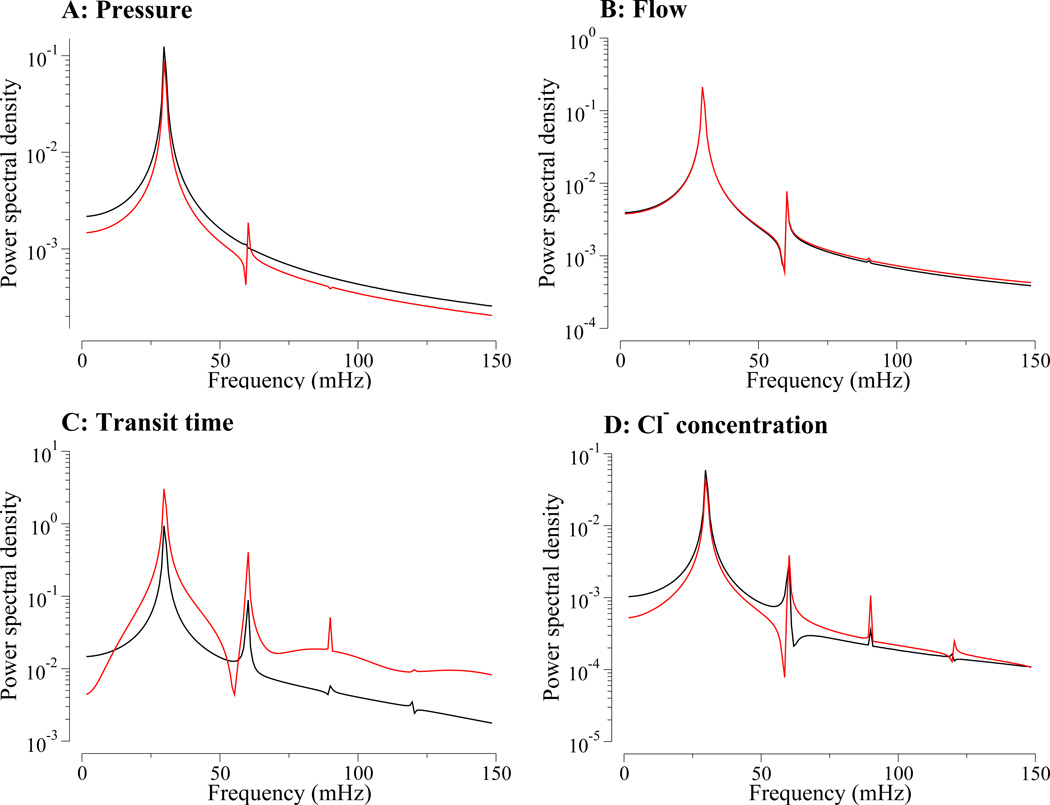
Power spectra corresponding to selected time-series corresponding to results in Fig. 5. Panel A, tubular pressure; panel B, tubular fluid flow rate; panel C, transit time; panel D, [Cl−]. Black, loop bend; red, macula densa.
Results in Fig. 5, panels A1 and B1, show that a sinusoidal oscillations in inflow fluid pressure result in almost sinusoidal oscillations in loop-bend and MD fluid pressures. Because the luminal radius is assumed to be a linear function of pressure, the radius profiles differ from corresponding pressure profiles by a constant scaling (results not shown).
The model also predicts that oscillations in tubular fluid flow are nearly sinusoidal, as can be seen by the absence of harmonic peaks higher than the first harmonic in the corresponding power spectra in Fig. 6B; and the first harmonic peak is several orders of magnitude smaller than the fundamental peak. (The power spectra were obtained by computing the discrete Fourier transform of the fluid flow rate deviations from steady state, normalized by the respective steady-state fluid flow rates.) Nonlinearity is nearly absent because loop-bend flow rate is determined by total water reabsorption along the descending limb, which is prescribed and is, in particular, independent of the transit time. Flow oscillations at the proximal tubule entrance lead flow oscillations at the loop bend, which in turn lead flow oscillations at the MD.
The nonlinear characteristics of the transduction of pressure oscillations into oscillations in tubular fluid Cl− concentration are exhibited as a function of time in Fig. 5, rows 3 and 4. The results in row 3 show the loop transit time associated with a fluid particle, starting at the proximal tubule and loop-bend entrance, respectively, that reaches the loop bend and the MD at time t; the results in row 4 show the tubular fluid Cl− concentration at the loop bend and the MD. The corresponding power spectra are exhibited in Fig. 6C. Both loop-bend and MD Na+ concentration waveforms deviate from a pure sine wave, as can be seen from the emergence of harmonics in the corresponding power spectra (Fig. 6D). The absolute amplitude of the loop-bend and MD oscillations are comparable.
Oscillation profiles
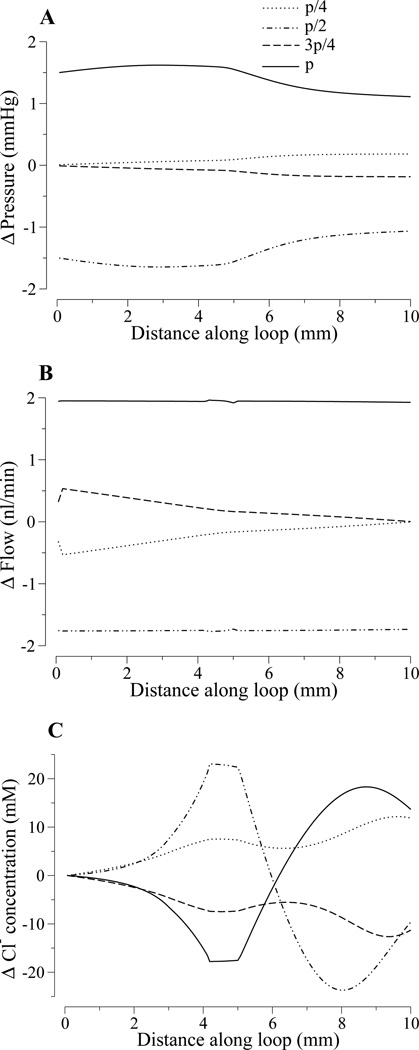
To elucidate the spatial characteristics of the oscillations established by sinusoidal pressure perturbations, we show in Fig. 7 axial tubular fluid pressure, tubular fluid flow rate, and luminal Cl− concentration along the loop. The profiles are given as deviations from the respective steady-state profiles (i.e., in each case the steady-state profile was subtracted from the dynamic profile). The profiles were obtained at four equally spaced times within the period of the sinusoidal pressure perturbation: tn = np/4, for n = 0, 1, 2, 3, and p = 1/f, where f is frequency.
Figure 7.
Axial profiles along the loop in tubular fluid pressure (panel A), tubular flow rate (panel B), and tubular fluid Cl− concentration (panel C), in response to a sinusoidal pressure perturbation applied to the proximal tubule entrance. Profiles are shown as deviations from non-oscillatory steady-state profiles at four time instances, p/4, p/2, 3p/4, and p within an oscillatory period p.
The pressure deviation profiles in Fig. 7A are approximate straight lines. The radius profiles are similar (not shown). These results mean that, as the inflow pressure fluctuates, the entire model loop expands and contracts almost simultaneously. Thus, the model predicts that for physiologic values of tubular compliance, the pressure wave does not travel along the loop as a bolus.
The flow deviation profiles (panel B) illustrate the attenuation of the amplitude of the flow oscillation along the loop. Note that although the pressure and radius are in phase, flow is phase-shifted with respect to pressure, and thus the flow deviation profiles, at the points in time displayed, do not reflect the extremes of the oscillation, even at the TAL entrance.
Figure 7C displays the tubular fluid Cl− concentration profiles at the same sample times. The difference between the Cl− concentration profiles and the profiles of pressure and flow is striking: the Cl− concentration profiles are significantly more complex, and the deviations from the steady-flow profile are no longer monotonic along the loop. The prescribed pressure oscillations produced standing waves with substantial oscillations in Cl− concentration along the entire loop, relative to the steady-state profiles, except at the proximal tubule entrance. For the prescribed frequency (f = 30 mHz), the only node in the oscillation profile is the proximal tubule entrance (x = 0), where the Cl− concentration was fixed as a boundary condition. As the perturbation frequency increases, the wavelength of the standing wave decreases, and additional nodes begin to emerge (results not shown; see Ref. (2, 15) for results in a rigid-tube TAL model).
Frequency response
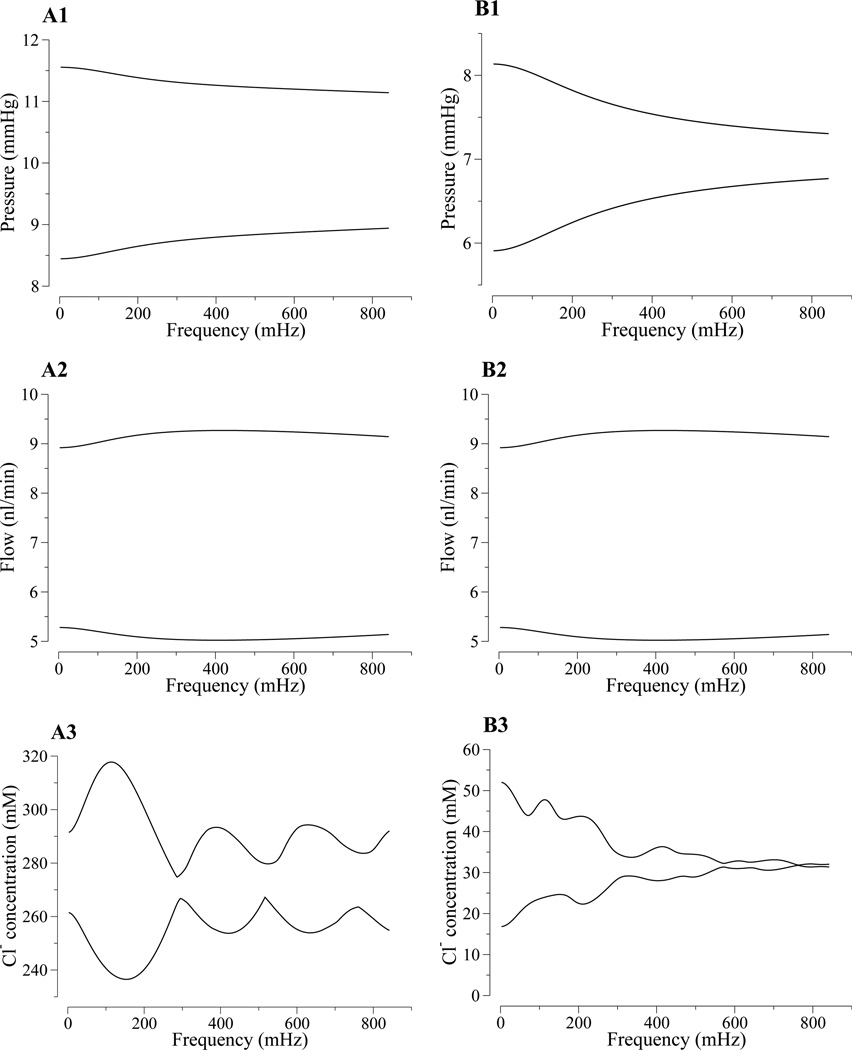
The response of the model loop to differing perturbation frequencies was further investigated. We conducted simulations to assess the effect of loop compliance on the oscillation amplitude range envelope. We used pressure perturbations given by Eq. 11, with Pp = P̄0/10, and with frequencies ranging from 0 to ~1000 mHz. We recorded loop-bend and MD pressure, flow rate, and Cl− concentration oscillation extrema for 200 equally spaced frequency values. The resulting range envelopes are shown in Fig. 8.
Figure 8.
Model loop frequency response arising from sustained, sinusoidal oscillations in tubular fluid pressure for a range of frequencies. Range of tubular fluid pressure (row 1), tubular fluid flow (row 2), and Cl− concentration (row 3) as a function of tubular fluid pressure frequency. Column A, loop bend; column B, macula densa.
Both the descending limb and the TAL act as low-pass filters for [Cl−] oscillations, which result in a generally decreasing range envelope amplitude as frequency increases (see Figs. 8A3 and 8B3). Also, approximate nodes are found at the loop bend and, albeit less clearly, at the MD. At these approximate nodes, the [Cl−] excursion amplitudes have local minima. The local amplitude minima occur when that instantaneous transit time equals steady-state transit time, or its integer multiples, as is the case for the nodal frequencies, thus the [Cl−] remains approximately at its steady-state value.
Figure 8 shows the amplitude ranges for pressure (row 1) and for tubular fluid volume flow (row 2) at the loop bend and at the MD, as a function of pressure oscillation frequency at the proximal tubule entrance (x = 0). The pressure range results illustrate that the loop acts as a low-pass filter for pressure wave propagation. In contrast, lower-frequency oscillations in tubular fluid flow in the loop bend are damped to a larger extent than are higher-frequency oscillations, which indicates that the proximal tubule and descending limbs act as a high-pass filter. The degree of damping of tubular flow oscillations at the MD as a function of frequency is non-monotonic. The relationship between periodic forcing and fluid flow rate is complex. Modeling results by Jung et al. on valveless pumping (7) suggests that flow rate in a compliant tube is sensitive to a number of factors, including forcing frequency, amplitude, elastic properties of the tube, etc.
Discussion
To study the transformation of variations in filtration rate into tubular fluid chloride concentration oscillations, and the generation of nonlinearities and harmonics in segments of a nephron, we have developed a dynamic model for TGF signal transduction in a short loop nephron. The principal goal of this study is to use the model to study flow rates and related behaviors in segments of the loop that are not accessible by means of in vivo experimental techniques. Our model predicts that a purely sinusoidal tubular fluid pressure waveform can generate a nonlinear Na+ concentration waveform at the loop bend and at the MD; and that TGF signal transduction from intratubular fluid flow at the proximal tubule entrance to NaCl concentration at the TAL exit depends, in part, on the transit time of intratubular fluid flow along the TAL.
Comparison to previous studies
In a previous study (12), we used a model of a TAL having compliant tubular walls to study the signal transduction properties of the TAL. In that model, the proximal tubule and the descending limb were not represented explicitly. Instead, the actions of the proximal tubule and descending limb of a short-looped nephron were modeled by a linear function that represents glomerular-tubular balance in proximal tubule and water absorption from the descending limb (14). That model predicted that MD Na+ concentration oscillations, induced by fluid pressure variations introduced at the entrance of the TAL, are reduced in amplitude as the frequency of flow oscillations increases. That is, the model TAL acts as a low-pass filter with respect to MD Na+ concentration oscillations, as does the TAL in the TGF model previously developed by us (2, 15, 12), as well as in the models developed by Marsh and collaborators (6, 19). The frequency response of the present model, which has been extended to include the proximal tubule and descending limb, is consistent with previous results in Ref. (12).
In another previous study (9), we studied the signal transduction properties of a short loop nephron using a detailed model of the cortex and medulla that represents the loops of Henle, collecting duct, and vasa recta; the tubules and vessels were assumed to have rigid walls. The radial organization of the tubules and vessels and the resulting preferential interactions were also represented. That model predicted that loop-bend Na+ concentration variations have a small amplitude, compared to the amplitude of the MD oscillations. In that model, the proximal convoluted tubule was not represented, and the short descending limb was assumed to have a low Cl− permeability (1.5 × 10⁻⁵ cm/s). Thus, along the descending limb, fluctuations in luminal Cl− concentrations are generated not so much from variations in transit time as in the case of the TAL, but mainly from variations in water reabsorption rate along the highly water-permeable proximal straight tubule.
In contrast, the present model explicitly represents the proximal convoluted tubule, which is assumed to have a moderate Cl− permeability (20 × 10−5 cm/s). As a result, loop-bend Cl− concentration has a significant dependence on transit time, and the present model predicts tubular fluid Cl− concentration oscillation amplitudes that are comparable in the loop bend and in the MD.
Model limitations and potential extensions
In situ tubular compliance is a difficult quantity to assess, as it depends not only on the inherent elasticity of the epithelium but also on possible tethering to other tubules via the interstitial matrix. On a larger scale, the expression of tubular compliance in the medulla may be limited by the renal capsule: this thin, fibrous sheath that contains the kidney may place limits on the distension of tubules and vessels. Regardless of how compliant the loop is in situ, our results suggest that the nonlinearities in TGF signal transduction should influence the wave shape of TGF-mediated oscillations, with the degree of distortion increasing with tubular compliance.
Because the model represents only Cl−, but not other solutes that have significant contributions to tubular fluid osmolalities (e.g., urea), water flux along the water-permeable proximal tubule is prescribed rather than computed from transepithelial osmotic gradient. Despite these limitations of the current model, we believe that the essence of its predictions— that TGF signal transduction from glomerular filtration rate to MD NaCl concentration at the TAL exit exhibits a significant dependence on the transit time of intratubular fluid flow; and that the TAL plays a large role in the generation of most of the oscillations of MD Na+ concentrations and the harmonics present in those oscillations—remains valid.
We have previously used a model of TGF system consisting of coupled nephrons having rigid TAL to investigate the nonlinear dynamics of the TGF system. We found that a small number of coupled nephrons can exhibit complex dynamics, including LCO and multistability, within a physiologically reasonable range of parameters (10, 11). These complex behaviors are consequences of the nonlinearity of the TGF system. Results of this study and of our previous study (12) suggest that tubular compliance markedly increases the strength of the nonlinearities in the TGF signal transduction process. It is likely that compliance may also have a significant effect on the stability of the TGF system. Indeed, a previous TGF model (8) that represents a compliant TAL predicts the emergence of complex behaviors at a broader range of TGF parameters, compared to an analogous TGF system that represents a rigid-tube TAL. The possibility that a TGF model having a compliant loop may exhibit even more complex dynamics merits further study.
Acknowledgments
This research was supported by the National Science Foundation, through grants DMS-0715021 and by the National Institutes of Health, through National Institute of Diabetes and Digestive and Kidney Diseases grant DK-89066, both to A. T. Layton.
References
- 1.Angell SK, Pruthi RS, Shortliffe LD. The urodynamic relationship of renal pelvic and bladder presures, and urinary flow rate in rats with congenital vesicoureteral reflux. J Urology. 1998;160:150–156. [PubMed] [Google Scholar]
- 2.Budu-Grajdeanu P, Moore LC, Layton HE. Effect of tubular inhomogeneities on filter properties of thick ascending limb of Henle’s loop. Math Biosci. 2007;209(2):564–592. doi: 10.1016/j.mbs.2007.03.007. [DOI] [PubMed] [Google Scholar]
- 3.Gottschalk CW. A comparable study of renal interstitial pressure. Am J Physiol. 1952;169:180–187. doi: 10.1152/ajplegacy.1952.169.1.180. [DOI] [PubMed] [Google Scholar]
- 4.Gottschalk CW, Mylle M. Micropuncture study of pressures in proximal and distal tubules and peritubular capillaries of the rat kidney during osmotic diuresis. Am J Physiol. 1957;189:323–328. doi: 10.1152/ajplegacy.1957.189.2.323. [DOI] [PubMed] [Google Scholar]
- 5.Holstein-Rathlou N-H, Leyssac PP. TGF-mediated oscillations in the proximal intratubular pressure: Differences between spontaneously hypertensive rats and Wistar-Kyoto rats. Acta Physiol Scand. 1986;126:333–339. doi: 10.1111/j.1748-1716.1986.tb07824.x. [DOI] [PubMed] [Google Scholar]
- 6.Holstein-Rathlou N-H, Marsh DJ. A dynamic model of the tubuloglomerular feedback mechanism. Am J Physiol (Renal Fluid Electrolyte Physiol 27) 1990;258:F1448–F1459. doi: 10.1152/ajprenal.1990.258.5.F1448. [DOI] [PubMed] [Google Scholar]
- 7.Jung E, Lim S, Lee W, Lee S. Computational models of valveless pumping using the immersed boundary method. Comput methods appl mech eng. 2008;197:2329–2339. [Google Scholar]
- 8.Layton AT. Feedback-mediated dynamics in a model of a compliant thick ascending limb. Math Biosci. 2010 doi: 10.1016/j.mbs.2010.10.002. in press. [DOI] [PMC free article] [PubMed] [Google Scholar]
- 9.Layton AT, Edwards A. Tubuloglomerular feedback signal transduction in a short loop of Henle. Bull Math Biol. 2010;72(1):34–62. doi: 10.1007/s11538-009-9436-4. [DOI] [PubMed] [Google Scholar]
- 10.Layton AT, Moore LC, Layton HE. Multistability in tubuloglomerular feedback and spectral complexity in spontaneously hypertensive rats. Am J Physiol Renal Physiol. 2006;291:F79–F97. doi: 10.1152/ajprenal.00048.2005. [DOI] [PubMed] [Google Scholar]
- 11.Layton AT, Moore LC, Layton HE. Multistable dynamics mediated by tubuloglomerular feedback in a model of coupled nephrons. Bull Math Biol. 2009;71:515–555. doi: 10.1007/s11538-008-9370-x. [DOI] [PubMed] [Google Scholar]
- 12.Layton AT, Moore LC, Layton HE. Tubuloglomerular feedback signal transduction in a compliant thick ascending limb. Am J Physiol Renal Physiol. 2009 doi: 10.1152/ajprenal.00732.2010. submitted. [DOI] [PMC free article] [PubMed] [Google Scholar]
- 13.Layton HE, Pitman EB, Knepper MA. A dynamic numerical method for models of the urine concentrating mechanism. SIAM J Appl Math. 1995;55(5):1390–1418. [Google Scholar]
- 14.Layton HE, Pitman EB, Moore LC. Bifurcation analysis of TGF-mediated oscillations in SNGFR. Am J Physiol (Renal Fluid Electrolyte Physiol 30) 1991;261:F904–F919. doi: 10.1152/ajprenal.1991.261.5.F904. [DOI] [PubMed] [Google Scholar]
- 15.Layton HE, Pitman EB, Moore LC. Nonlinear filter properties of the thick ascending limb. Am J Physiol (Renal Fluid Electrolyte Physiol 42) 1997;273:F625–F634. doi: 10.1152/ajprenal.1997.273.4.F625. [DOI] [PubMed] [Google Scholar]
- 16.Layton HE, Pitman EB, Moore LC. Spectral properties of the tubuloglomerular feedback system. Am J Physiol (Renal Fluid Electrolyte Physiol 42) 1997;273:F635–F649. doi: 10.1152/ajprenal.1997.273.4.F635. [DOI] [PubMed] [Google Scholar]
- 17.Leyssac PP, Baumbach L. An oscillating intratubular pressure response to alterations in Henle loop flow in the rat kidney. Acta Physiol Scand. 1983;117:415–419. doi: 10.1111/j.1748-1716.1983.tb00015.x. [DOI] [PubMed] [Google Scholar]
- 18.Mason J, Gutsche HU, Moore LC, Müller-Suur R. The early phase of experimental acute renal failure. IV. The diluting ability of the short loops of Henle. Pflügers Arch. 1979;379:11–18. doi: 10.1007/BF00622899. [DOI] [PubMed] [Google Scholar]
- 19.Sakai T, Craig DA, Wexler AS, Marsh DJ. Fluid waves in renal tubules. Biophys J. 1986;50:805–813. doi: 10.1016/S0006-3495(86)83521-4. [DOI] [PMC free article] [PubMed] [Google Scholar]
- 20.Schnermann J, Briggs JP. Function of the juxtaglomerular apparatus: Control of glomerular hemodynamics and renin secretion. In: Seldin DW, Giebisch G, editors. The Kidney: Physiology and Pathophysiology. 3d. ed. Philadelphia: Lippincott Williams & Wilkins; 2000. pp. 945–980. [Google Scholar]
- 21.Schnermann J, Briggs JP. Function of the juxtaglomerular apparatus: Control of glomerular hemodynamics and renin secretion. In: Alpern RJ, Hebert SC, editors. Seldin and Giebisch’s The Kidney: Physiology and Pathophysiology. 4th ed. Amsterdam, Boston: Elsevier Academic Press; 2008. pp. 589–626. [Google Scholar]
- 22.Wade JB, Lee AJ, Ecelbarger CA, Mitchell C, Bradford AD, Terris J, Kim G-H, Knepper MA. UT-A2: a 55-kDa urea transporter in thin descending limb whose abundance is regulated by vasopressin. Am J Physiol Renal Physiol. 2000;278:F52–F62. doi: 10.1152/ajprenal.2000.278.1.F52. [DOI] [PubMed] [Google Scholar]
- 23.Weinstein AM. An equation for flow in the renal proximal tubule. Bull Math Biol. 1986;48(1):29–57. doi: 10.1007/BF02460061. [DOI] [PubMed] [Google Scholar]
- 24.Yip K-P, Holstein-Rathlou N-H, Marsh DJ. Chaos in blood flow control in genetic and renovascular hypertensive rats. Am J Physiol (Renal Fluid Electrolyte Physiol 30) 1991;261:F400–F408. doi: 10.1152/ajprenal.1991.261.3.F400. [DOI] [PubMed] [Google Scholar]


