Abstract
We analyzed the regional distribution of bulk heterotrophic prokaryotic activity (leucine incorporation) and selected single-cell parameters (cell viability and nucleic acid content) as parameters for microbial functioning, as well as bacterial and archaeal community structure in the epipelagic (0 to 200 m) and mesopelagic (200 to 1,000 m) subtropical Northeast Atlantic Ocean. We selectively sampled three contrasting regions covering a wide range of surface productivity and oceanographic properties within the same basin: (i) the eddy field south of the Canary Islands, (ii) the open-ocean NE Atlantic Subtropical Gyre, and (iii) the upwelling filament off Cape Blanc. In the epipelagic waters, a high regional variation in hydrographic parameters and bacterial community structure was detected, accompanied, however, by a low variability in microbial functioning. In contrast, mesopelagic microbial functioning was highly variable between the studied regions despite the homogeneous abiotic conditions found therein. More microbial functioning parameters indicated differences among the three regions within the mesopelagic (i.e., viability of cells, nucleic acid content, cell-specific heterotrophic activity, nanoflagellate abundance, prokaryote-to-nanoflagellate abundance ratio) than within the epipelagic (i.e., bulk activity, nucleic acid content, and nanoflagellate abundance) waters. Our results show that the mesopelagic realm in the Northeast Atlantic is, in terms of microbial activity, more heterogeneous than its epipelagic counterpart, probably linked to mesoscale hydrographical variations.
INTRODUCTION
The dark ocean (>200-m depth) is the largest habitat (∼1.3 × 10¹⁸ m3) and a major reservoir of organic carbon in the biosphere (mainly in the form of dissolved organic carbon) (7, 19, 21), containing also more than 98% of the global dissolved inorganic carbon (DIC) pool (17). It also contains the largest pool of microbes in aquatic systems (32), harboring nearly 75% and 50% of the prokaryotic biomass and production, respectively, of the global ocean (see reference 3 for a review). Although there is growing evidence that the dark ocean plays a central role in the ocean's biogeochemistry and holds a unique reservoir of high genetic and metabolic microbial diversity (10, 28), the deep ocean has been much less studied than the surface waters, and therefore the lack of information on the regional variability of deep-water microbial communities is evident.
Previous research on the mesopelagic waters of the Northwest (NW) Africa-Canary Islands eddy field (Ef) region has shown that the proportion of actively respiring cells is similar to that of the overlying epipelagic waters with a higher cell-specific respiration rate than in the epipelagic layers (2). Focusing on the same Ef region, Gasol et al. (14) observed that mesopelagic prokaryotes were less abundant than in epipelagic prokaryotes but had comparable levels of activity (i.e., cell-specific respiration and production). These authors also reported that the relationship between prokaryotes and their main predators (heterotrophic nanoflagellates) remained constant with depth. Baltar et al. (5) analyzed the potential effects of island-induced mesoscale eddies on the prokaryotic structure and function and found differences in microbial functioning (but not in community composition) in the mesopelagic zone of the same eddy field region.
Here we analyze the prokaryotic community structure (via fingerprinting techniques for bacterial and archaeal assemblages) and function in three selected regions of the Northeast (NE) Atlantic Ocean (not only in the Ef region as in our previous studies), which cover a great variability in epipelagic productivity. We measured different prokaryotic activities ranging from single-cell-based proxies (cell viability and nucleic acid content) to bulk metabolic rates (leucine [Leu] incorporation) throughout the epi- and mesopelagic realms. The aim of the study was to determine whether, and if so, to what extent, the strong lateral gradients in surface productivity of the NE Atlantic translate into differences in microbial structure and functioning in the underlying mesopelagic waters.
MATERIALS AND METHODS
Study site and sampling.
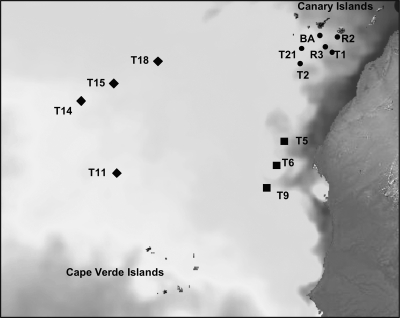
Thirteen stations were occupied in the subtropical epi- and mesopelagic Northeast Atlantic Ocean between the Canary and the Cape Verde archipelagos with the R/V BIO Hespérides during the RODA-II cruise in February 2007 (Fig. 1). The stations were grouped into three different regions according to the physico-chemical variables (see Results): (i) the eddy field south of the Canary Islands (Ef; Sts R2, T1, T2, T21, BA9, and R3), (ii) the region affected by the upwelling filament off Cape Blanc (Uw; Sts T5, T6, and T9), and (iii) the open-ocean waters of the NE Atlantic Subtropical Gyre (Oc; Sts T11, T14, T15, and T18).
Fig 1.
Positions of the stations occupied during the RODA-II cruises in February 2007. Full circles indicate stations located in the eddy field south of the Canaries, squares indicate stations close to the African upwelling, and diamonds represent stations sampled in the open ocean. Surface temperature was obtained from the Met Office (National Centre for Ocean Forecasting) Web Map Service via the Godiva2 interface, corresponding to February 2007.
Samples for prokaryotic abundance, nucleic acid content and cell viability were collected at each station from 19 to 21 depths ranging from 5 to 1,000 m, including the deep chlorophyll maximum (40 to 125 m), the deep scattering layer (400 to 550 m), and the oxygen minimum zone (700 to 850 m). Six or seven of these depths were sampled to determine prokaryotic heterotrophic activity, four depths (deep chlorophyll maximum, deep scattering layer, oxygen minimum zone, and 1,000 m) for community fingerprinting and two depths (deep chlorophyll maximum and deep scattering layer) to estimate the abundance of nanoflagellates. At each station, temperature, salinity, fluorescence, and turbidity were recorded down to 1,000-m depth using a SeaBird 911 plus CTD system, mounted on a General Oceanics rosette sampler, equipped with 24 12-liter Niskin bottles.
Prokaryotic abundance, nucleic acid content, and membrane-compromised bacteria (nucleic acid double staining negative [NADS]) determined by flow cytometry.
Picoplankton were enumerated using flow cytometry in a FACSCalibur (Becton Dickinson) with a laser emitting at 488 nm. Samples (1.5 ml) were fixed with paraformaldehyde (1% final concentration), incubated at 4°C for 15 to 30 min and then stored frozen in liquid nitrogen until analysis. Prior to enumerating the cells by flow cytometry and after thawing, 200 μl of sample was stained with a dimethyl sulfoxide (DMSO)-diluted SYTO-13 (Molecular Probes) stock (10:1) at a 2.5 μM final concentration. Prokaryotes were identified by their signatures in a plot of side scatter (SSC) versus green fluorescence (FL1). High- and low-nucleic-acid-content cells (HNA and LNA, respectively) were separated in the scatter plot of SSC-FL1 (15). HNA cells exhibited higher FL1 than did LNA cells. Picocyanobacteria were discriminated in a plot of FL1 versus red fluorescence (FL3).
Viable and damaged prokaryotic cell numbers were estimated in nonfixed samples following the nucleic acid double-staining (NADS) protocol (11, 16). NADS+, green cells (assumed to be active, with intact membranes), and NADS−, red cells (assumed to be inactive, with compromised cell membranes), were identified by simultaneous double staining with membrane-permeable (SYBR green; Molecular Probes) and -impermeable (propidium iodide) probes. Immediately after collection, samples (0.4 ml) were incubated in the dark with 4 μl of SYBR green (10× final concentration) and 4 μl of propidium iodide (10 μg ml−1 final) for 15 min. NADS+ and NADS− cells were enumerated by flow cytometry and differentiated in a scatter plot of FL1 (green)-FL3 (red emission after blue light excitation). Samples for prokaryotic abundance and NADS were run at a flow rate of 18 to 20 μl min−1.
Prokaryotic bulk heterotrophic activity estimated by [3H]leucine incorporation.
Bulk prokaryotic heterotrophic activity was estimated via the incorporation of tritiated leucine into bacterial protein using the centrifugation method (27). [3H]leucine (Amersham; specific activity of 172 Ci mmol−1) was added at saturating concentration (40 nmol l−1) to 4 replicate 1.2-ml subsamples. Duplicate controls were established by adding 120 μl of 50% trichloroacetic acid 10 min prior to isotope addition. The Eppendorf tubes were incubated at in situ temperature in temperature-controlled chambers for 2 to 7 h. Incorporation of Leu in the quadruplicate sample was stopped by adding 120 μl of ice-cold 50% trichloroacetic acid. Subsequently, the subsamples and the controls were kept at −20°C until centrifugation (at ca. 12,000 × g) for 20 min, followed by aspiration of the water. Finally, 1 ml of scintillation cocktail was added to the Eppendorf tubes before determining the incorporated radioactivity after 24 to 48 h on a Wallac scintillation counter with quenching correction using an external standard.
Cell-specific prokaryotic heterotrophic production was calculated using the theoretical conversion factor (without internal dilution factor) of 1.5 kg C mol−1 Leu (26) and a carbon content of 12 fg C cell−1 (13).
DNA sampling, extraction and purification, and fingerprinting of the communities.
For DNA fingerprinting of prokaryotic communities, 2 to 5 liters was filtered onto 0.2-μm polycarbonate filters (Millipore GTTP, 47-mm filter diameter) and the filters stored in microcentrifuge vials in liquid nitrogen for 24 h and then at −80°C until further processing in the laboratory. DNA extraction was performed using the MoBio UltraClean soil DNA isolation kit (MoBIO Laboratories, Carlsbad, CA) following the protocol of the manufacturer.
Terminal-restriction fragment length polymorphism (T-RFLP) for archaeal communities.
PCR conditions and chemicals were applied as described before (23). Briefly, 1 μl of the DNA extract was used as a template in a 50-μl PCR mixture. For PCR, the Archaea-specific primers 21F-FAM and 958R-JOE were used (23). Fluorescently labeled fragments were separated and detected with an ABI Prism 310 capillary sequencer (Applied Biosystems) run under GeneScan mode (22, 31). The size of the fluorescently labeled fragment was determined by comparison with the internal GeneTrace 1000 (ROX) size standard (Applied Biosystems, Foster City, CA). The output from the ABI GeneScan software was transferred to the Fingerprinting II (Bio-Rad) software to determine peak area and for standardization using size markers. The obtained matrix was further analyzed with the Primer software (Primer-E) to determine similarities of the T-RFLP fingerprints between samples.
ARISA of the bacterial community.
Automated ribosomal intergenic spacer analysis (ARISA) was used to analyze bacterial community composition with the primer 1392F and a 5′TET-labeled version of the primer 23S rRNA genes as described before (12) (20). One microliter of the DNA extract was used as a template in a 50-μl PCR mixture. Thermocycling was preceded by a 3-min heating step at 94°C, followed by 30 cycles of denaturing at 94°C (15 s), annealing at 55°C (30 s), and an extension at 72°C (3 min). Cycling was completed by a final extension at 72°C for 9 min. The PCR products were purified with the Quick purification kit (Genscript, Piscataway, NJ) and quantified using a Nanodrop spectrophotometer. Purified products were then diluted to 8 ng μl−1 to load a standardized amount for fragment analysis, thereby preventing differences originating from different amounts of loaded DNA. Each sample of the final product was mixed with 10 μl of Hi-Di formamide at 94°C for 3 min, 0.15 μl CST 300-1800 molecular ladder, and 0.15 μl GeneTrace 1000 (ROX) marker (Applied Biosystems, Foster City, CA). Fragments were discriminated using an ABI Prism 310 capillary sequencer (Applied Biosystems), and the resulting electropherograms were analyzed using the ABI GeneScan software. The output from the ABI GeneScan software was transferred to the Fingerprinting II (Bio-Rad) software to determine peak area and for standardization using size markers. Peaks contributing <0.09% of the total amplified DNA (as determined by relative fluorescence intensity) were eliminated as they were considered to be indistinguishable from baseline noise (20). The obtained matrix was further analyzed with software Primer (Primer-E, Luton, United Kingdom) to determine similarities of the ARISA fingerprints between samples.
Nanoflagellate abundance determined by epifluorescence microscopy.
Seawater samples for enumeration of autotrophic and heterotrophic nanoflagellates were preserved as described before (18): immediately after collection, the sample was fixed with glutaraldehyde (0.3% final concentration). After 30 min, a 45-ml subsample was placed into the filtration tower and stained with DAPI (4′,6-diamidino-2-phenylindole; 5 μg ml−1 final concentration) for 5 min. The stained sample was then filtered through a 0.2-μm black polycarbonate membrane filter, placed over a Whatman GF/C support filter, and finally mounted on a microscope slide with low-fluorescence paraffin oil. Flagellates were counted using epifluorescence microscopy. Autotrophic (plastidic) were distinguished from heterotrophic (aplastidic) flagellates by their chloroplasts, which emit red fluorescence when observed under blue light (excitation filter BP 450–490, chromatic divisor FT 510, suppressor filter LP 520). At least 50 cells or 20 fields were counted at a magnification of ×1,000.
Statistical analyses.
Principal component analysis (PCA) is a multivariate regression analysis that reduces a large number of variables to a few principal components. Prior to performing PCA, all targeted variables were standardized by subtracting the mean of all values and dividing by the standard deviation of all values (8). A hierarchical cluster analysis (Euclidian distances) was also done together with a nonmetric multidimensional scaling (MDS) in order to statistically group the sampled stations into regions. All PCAs, clustering, and MDS were carried out with the Primer software (Primer-E, Luton, United Kingdom). To compare the different sets of samples, we carried out analyses of variance (ANOVA) followed by Student's t mean comparisons, after log transformation of the data to attain normality, using the JMP statistical software (SAS Institute Inc., Cary, NC). Normality was checked with a Shapiro test. Peak intensity and presence/absence patterns of operational taxonomic units (OTUs) in individual samples determined by both T-RFLP and ARISA were analyzed using the Primer software (Primer-E, Luton, United Kingdom) to determine the Jaccard similarity index. One-way analyses of similarity (ANOSIM) were computed to test for regional variability between samples also using the Primer software.
RESULTS
Oceanographic setting.
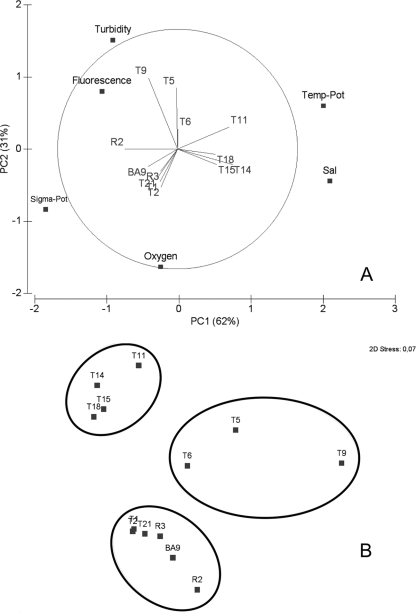
The epipelagic layers of the three regions of the study area were characterized by a pronounced variation in physico-chemical parameters with significant differences (ANOVA, all P < 0.05) in salinity, potential temperature, oxygen concentration, fluorescence, and turbidity (Table 1). Fluorescence and turbidity increased from Oc < Ef < Uw (Table 1). A principal component analysis (PCA) of all the available abiotic factors from the epipelagic zone explained most of the observed variability (∼93%) by using just two of the principal components (Fig. 2A). Focusing on these two components, a pattern of distribution arises where the stations of each of our defined regions (i.e., Oc [T11, T14, T15, T18], Uw [T5, T6, T9], Ef [R2, R3, BA9, T1, T2]) clustered together. As shown by the PCA analysis, stations belonging to the Uw and Ef regions showed higher fluorescence and turbidity values (typical for more productive regions), whereas the Oc stations exhibited higher temperature and salinity values (typical for the oligotrophic open ocean). The hierarchical cluster analysis overlaid in the nonmetric multidimensional scaling (MDS) analysis further confirmed the clustering of all the stations according to the three targeted regions (Fig. 2B).
Table 1.
Abiotic data for different regions and depth layers
| Depth range | Region | Mean (SD)a |
|||||
|---|---|---|---|---|---|---|---|
| Salinity | Pot-temp (°C) | Pot-sigma (kg m−3) | Fluorescence (RFU) | Oxygen concn. (μmol kg−1) | Turb (FTU) | ||
| Epipelagic (5–200 m) | Ef | 36.77 (0.19) | 18.6 (1.1) | 26.5 (0.1) | 0.22 (0.14) | 209 (9) | 5.3 (2.4) |
| Uw | 36.70 (0.18) | 19.3 (1.5) | 26.2 (0.3) | 0.24 (0.23) | 178 (27) | 6.0 (3.9) | |
| Oc | 37.16 (0.24) | 20.8 (1.3) | 26.2 (0.2) | 0.15 (0.06) | 201 (9) | 4.3 (1.5) | |
| Mesopelagic (200–1,000 m) | Ef | 35.60 (0.34) | 11.1 (2.6) | 27.2 (0.2) | 0.02 (0.001) | 150 (22) | 2.0 (0.2) |
| Uw | 35.39 (0.34) | 10.2 (2.8) | 27.2 (0.2) | 0.02 (0.001) | 107 (12) | 2.1 (0.6) | |
| Oc | 35.58 (0.42) | 11.2 (3.2) | 27.1 (0.3) | 0.02 (0.001) | 146 (15) | 1.5 (0.2) | |
Mean (standard deviation in brackets) salinity, potential temperature (Pot-temp), and potential density (Pot-sigma), fluorescence (relative fluorescence units [RFU]), oxygen concentration, and turbidity (formazin turbidity units [FTU]) in the different regions and depth layers. Ef, eddy field region south of the Canary Islands; Uw, influenced by coastal waters of the NW African upwelling; Oc, open-ocean waters of the NE Atlantic Subtropical Gyre.
Fig 2.
(A) Principal component analysis (PCA) of the epipelagic physico-chemical and oceanographic data. The first two principal components (PC1 and PC2) explain most (93%) of the variance in the data set. Pot, potential; Sal, salinity. (B) Nonmetric multidimensional scaling with a hierarchical cluster analysis (Euclidian distances) overlain (ellipses showing Euclidian distance of 3) to indicate the clustering of the sampled stations.
In the mesopelagic zone, only the oxygen concentration exhibited significant differences (ANOVA < 0.05) among the three regions (Table 1). As in the epipelagic layer, turbidity was lower in the mesopelagic zone of the NE Atlantic Subtropical Gyre (Oc) than in the other two regions (Ef and Uw) (Table 1). In contrast to the epipelagic layer, a PCA and MDS analysis performed with the abiotic data obtained for the mesopelagic zone did not reveal clear regional patterns.
Regional variability of prokaryotic community structure and activity.
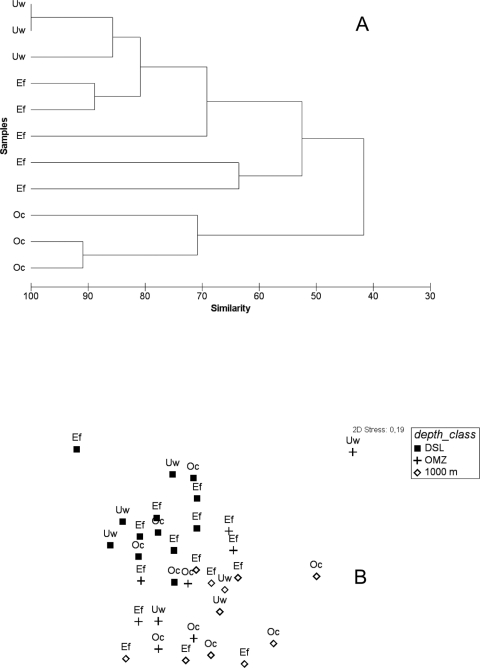
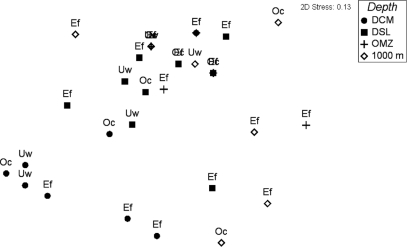
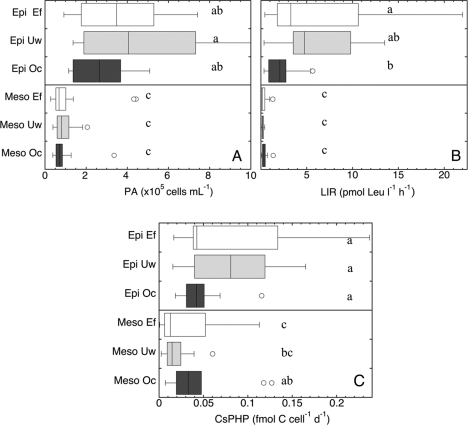
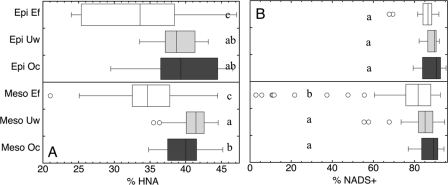
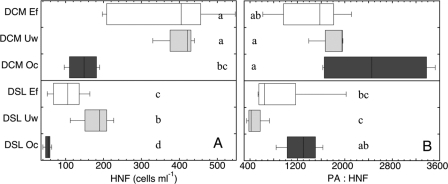
In agreement with the distinct regional differences in abiotic parameters described by the PCA analysis (Fig. 2A), the prokaryotic community compositions in the deep chlorophyll maximum layer were distinctly different among the three regions (Fig. 3A). Analysis of similarities revealed significant differences (ANOSIM R = 0.325, P = 0.002) only for the bacterial community compositions among the three regions and no significant regional trends for archaeal community composition (Fig. 4). Despite the pronounced differences in the abiotic parameters and bacterial community compositions among the three regions in the epipelagic layer, no significant differences were found for prokaryotic abundance or cell-specific prokaryotic heterotrophic production among any of the regions (Fig. 5A and C). Only bulk leucine incorporation in Oc was significantly lower (ANOVA < 0.05) than in Ef (but not in Uw) (Fig. 5B). At a single-cell level, the proportion of high nucleic acid content (% HNA) showed significant regional differences (ANOVA < 0.05), but only between the Ef and the other two regions (Fig. 6A), while no significant differences were detected for the percentage of NADS+ cells among the three regions in the epipelagic layer (Fig. 6B). Heterotrophic nanoflagellate abundance was significantly higher (ANOVA < 0.05) in the deep chlorophyll maximum of the Ef and Uw as compared to Oc (Fig. 7A). However, the ratios of prokaryotic abundance to heterotrophic nanoflagellates were not significantly different among the regions (Fig. 7B).
Fig 3.
(A) Similarity matrix of the fingerprinting pattern in bacterial community composition as revealed by ARISA for epipelagic. (B) Nonmetric multidimensional scaling from the ARISA pattern for mesopelagic. Both peak presence alone and peak height were used for the statistics, yielding similar results. DCM, deep chlorophyll maximum; DSL, deep scattering layer; OMZ, oxygen minimum zone.
Fig 4.
Nonmetric multidimensional scaling from the T-RFLP pattern in archaeal community composition. Both peak presence alone and peak height were used for the statistics, yielding similar results. DCM, deep chlorophyll maximum; DSL, deep scattering layer; OMZ, oxygen minimum zone.
Fig 5.
Distribution of prokaryotic abundance (PA, cells ml−1) (A), bulk prokaryotic leucine incorporation rates (LIR, pmol Leu l−1 h−1) (B), and cell-specific prokaryotic heterotrophic production (CsPHP, fmol C cell−1 day [d]−1) (C) in the epipelagic (Epi, 0- to 200-m) and mesopelagic (Meso, 200- to 1,000-m) layers of the three oceanic regions: Ef, eddy field region south of the Canary Islands; Uw, influenced by coastal waters of the NW African upwelling; and Oc, open-ocean waters of the NE Atlantic Subtropical Gyre. Letters denote significant differences between regions for the epipelagic and mesopelagic waters (one-way ANOVA mean comparison [alpha = 0.05]).
Fig 6.
Distribution of the percentage of high-nucleic-acid-content cells (% HNA) (A) and the percentage of NADS-determined “live” cells (% NADS+) (B) in the epipelagic (Epi, 0- to 200-m) and mesopelagic (Meso, 200- to 1,000-m) layers of the three oceanic regions: Ef, eddy field region south of the Canary Islands; Uw, influenced by coastal waters of the NW African upwelling; and Oc, open-ocean waters of the NE Atlantic Subtropical Gyre. Letters denote significant differences between regions for the epipelagic and mesopelagic waters (one-way ANOVA mean comparison [alpha = 0.05]).
Fig 7.
Distribution of the abundance of heterotrophic nanoflagellates (HNF, cells ml−1) (A) and the prokaryote:heterotrophic nanoflagellate abundance ratio (PA : HNF) (B) in the deep chlorophyll maximum (DCM) and the deep scattering layer (DSL) of the three oceanic regions: Ef, eddy field region south of the Canary Islands; Uw, influenced by coastal waters of the NW African upwelling; and Oc, open-ocean waters of the NE Atlantic Subtropical Gyre. Letters denote significant differences between regions for the epipelagic and mesopelagic waters (one-way ANOVA mean comparison [alpha = 0.05]).
In the mesopelagic realm, no distinct pattern was detectable in bacterial or archaeal community structure among the three regions (Fig. 3B and 4), in agreement with the more homogeneous distribution pattern of abiotic parameters found in this layer as compared to the epipelagic zone. Mesopelagic prokaryotic abundance did not differ significantly among the three regions (Fig. 5A). Also, in contrast to those of the epipelagic layer, the bulk prokaryotic heterotrophic production levels of the mesopelagic layers were not significantly different (ANOVA < 0.05) among the different regions (Fig. 5B). Thus, prokaryotic abundance and production did not show regional differences in the mesopelagic layers. In contrast, heterotrophic nanoflagellate abundance was significantly different between the three regions in the mesopelagic (Fig. 7A). Moreover, the ratio of prokaryotic abundance to heterotrophic nanoflagellates was significantly higher in the Uw than in the Oc in the mesopelagic (Fig. 7B). The two proxies of single-cell activity (NADS+ and HNA cells) were significantly lower in the mesopelagic layer of the Ef than in the other regions (Fig. 6), indicating differences in the microbial functioning between the Ef and the other two regions. For cell-specific prokaryotic heterotrophic production, the only significant differences were found between the Oc and the Ef regions, with lower cell-specific prokaryotic heterotrophic production in the Ef than in the Oc (Fig. 5C and D).
DISCUSSION
The physico-chemical variability found in the epipelagic layer was in agreement with the reported influence of the coastal waters in the Uw and Ef regions, with lower temperatures, but higher salinity and chlorophyll, as compared to the more stratified open-ocean waters (for example, see reference 6). However, regardless of the compelling heterogeneity found in the epipelagic zone among the three regions in abiotic parameters and in bacterial community structure, only a few significant differences in parameters indicative of microbial functioning and in stock parameters were found. Moreover, the few parameters that showed regional differences (i.e., leucine incorporation, % HNA, and heterotrophic nanoflagellate abundance) might be related to differences in organic matter availability between the oligotrophic open-ocean waters from the NE Atlantic Subtropical Gyre and the more eutrophic waters of the upwelling filament off Cape Blanc and the eddy field south of the Canary Islands.
A more homogeneous distribution pattern of abiotic parameters and bacterial or archaeal community structure was found in the mesopelagic as compared to the epipelagic among the three regions in this layer. However, the degree of regional variability in microbial functioning parameters was greater in the mesopelagic than in the epipelagic. In a previous study, carried out in a different season (summer-autumn) and on a much smaller spatial scale (focusing only on the Ef region) than the present one, Gasol et al. (14) also reported that despite the large variability found in the prokaryotic metabolism in the mesopelagic Ef region, no significant differences were found in the mesopelagic bacterial community structure. Furthermore, Baltar et al. (4) arrived at a similar conclusion as Gasol et al. (14), analyzing the potential effects of island-induced mesoscale eddies on the prokaryotic assemblage structure and bulk and single-cell metabolism in the Ef region. The latter two papers emphasized that although there were significant differences in prokaryotic abundance and in some metabolic rates in the epi- and mesopelagic layers between the stations affected and nonaffected by the eddy field, the differences in bacterial and archaeal community composition were restricted to the epipelagic realm.
Particularly relevant were the significant differences found in single-cell proxies and cell-specific prokaryotic heterotrophic production between the mesopelagic Ef and the other two regions. In agreement, Baltar et al. (4) reported that the mesopelagic respiration in the Ef was on average 2 and 4 times higher than in the Uw and Oc regions, respectively. Alonso-González et al. (1) observed that the elemental composition of the sinking particulate organic carbon (collected with drifting sediment traps at 200-m depth) was relatively uniform and close to the Redfield ratio (C:N = 6.4) at the Uw and Oc stations but more refractory (C:N ∼9.1) in the Ef. This is consistent with the high remineralization rates reported for this area (for examples, see references 2 and 14). Although this pattern could partly be due to the transport of semirefractory organic matter from the coast, Baltar et al. (4) found that the average prokaryotic growth efficiency in the mesopelagic Ef was the lowest (6.5%) among the three regions, while the highest prokaryotic growth efficiency was determined for the Oc region (11%). Alonso-González et al. (1) reported that the particulate organic matter at open-ocean stations has relatively more chlorophyll-a and fresh cytoplasm components, whereas the stations with higher carbon fluxes in the eddy field presented more reworked material, resulting in lower prokaryotic growth efficiency.
Our results indicate that the mesopelagic microbial functioning is strikingly variable among the three regions, which is in contrast to the homogeneous regional abiotic conditions and prokaryotic community structure. In fact, we found more microbial functioning parameters indicated differences among the three regions within the mesopelagic (i.e., viability of cells, nucleic acid content, cell-specific heterotrophic activity, nanoflagellate abundance, prokaryote-to-nanoflagellate abundance ratio) than in the epipelagic (i.e., bulk activity, nucleic acid content, and nanoflagellate abundance) waters. These results are unexpected as it is commonly accepted that the epipelagic realm exhibits the strongest regional variations and that the deep ocean is a more homogenous system with a rather stable prokaryotic assemblage and low activity. However, other previous studies have shown seasonality in prokaryotic abundance (24, 29, 30) and activity (9, 25) in the deep ocean, suggesting that the dark ocean is more dynamic than anticipated hitherto. In this study, we demonstrate that there are more pronounced regional differences in microbial functioning within the mesopelagic than within the epipelagic realm across the three regions with different hydrodynamic regimens. These mesopelagic regional divergences might be a consequence of hydrographical variations, probably linked to structural changes of the water column, mostly due to mesoscale variability forming boundary layers reducing or enhancing fluxes from the euphotic layer.
ACKNOWLEDGMENTS
This research was supported by the Spanish “Plan Nacional de I+D” (MEC) under the RODA (CTM2004-06842-C03-03/MAR) and CAIBEX (CTM2007-66408-C02-02) grants to J.A.; a grant of the Earth and Life Science Division of the Dutch Science Foundation (ALW-NWO; ARCHIMEDES project, 835.20.023) to G.J.H.; and a predoctoral Fellowship of the Spanish Ministry of Education and Science (AP2005-3932) and a postdoctoral grant under the MOCA (European Science Foundation – Eurocores Program Evolutionary and Ecological Functional Genomics) project to F.B. Projects MODIVUS (CTM2005-04795/MAR) and STORM (CTM2009-09352/MAR) supported J.M.G.
We thank the captain and crew of R/V BIO Hespérides for their support at sea and M. Espino for the determination of nanoflagellate abundances.
Footnotes
Published ahead of print 17 February 2012
REFERENCES
- 1. Alonso-González I, Arístegui J, Lee C, Calafat A. 2010. Regional and temporal variability of sinking organic matter in the subtropical northeast Atlantic Ocean: a biomarker diagnosis. Biogeoscience 7:2101–2115 [Google Scholar]
- 2. Arístegui J, Duarte CM, Gasol JM, Alonso-Sáez L. 2005. Active mesopelagic prokaryotes support high respiration in the subtropical northeast Atlantic Ocean. Geophys. Res. Lett. 32:L03608 [Google Scholar]
- 3. Arístegui J, Gasol JM, Duarte CM, Herndl GJ. 2009. Microbial oceanography of the dark ocean's pelagic realm. Limnol. Oceanogr. 54:1501–1529 [Google Scholar]
- 4. Baltar F, Arístegui J, Gasol JM, Herndl GJ. 2010. Prokaryotic carbon utilization in the dark ocean: growth efficiency, leucine-to-carbon conversion factors, and their relation. Aquat. Microb. Ecol. 60:227–232 [Google Scholar]
- 5. Baltar F, Arístegui J, Gasol JM, Lekunberri I, Herndl GJ. 2010. Mesoscale eddies: hotspots of prokaryotic activity and differential community structure in the ocean. ISME J. 4:975–988 [DOI] [PubMed] [Google Scholar]
- 6. Barton ED, et al. 1998. The transition zone of the Canary Current upwelling region. Prog. Oceanogr. 41:455–504 [Google Scholar]
- 7. Benner R. 2002. Chemical composition and reactivity, p 59–90 In Hansell DA, Carlson CA. (ed), Biogeochemistry of marine dissolved organic matter. Elsevier Science, New York, NY [Google Scholar]
- 8. Dauwe B, Middelburg JJ. 1998. Amino acids and hexosamines as indicators of organic matter degradation state in North Sea sediments. Limnol. Oceanogr. 43:782–798 [Google Scholar]
- 9. De Corte D, Sintes E, Yokokawa T, Reinthaler T, Herndl GJ. 19 January 2012. Links between viruses and prokaryotes throughout the water column along a North Atlantic latitudinal transect. ISME J. doi:10.1038/ismej.2011.214 [DOI] [PMC free article] [PubMed] [Google Scholar]
- 10. DeLong EF, et al. 2006. Community genomics among stratified microbial assemblages in the ocean's interior. Science 311:496–503 [DOI] [PubMed] [Google Scholar]
- 11. Falcioni T, Papa S, Gasol JM. 2008. Evaluating the flow-cytometric nucleic acid double-staining protocol in realistic situations of planktonic bacterial death. Appl. Environ. Microbiol. 74:1767–1779 [DOI] [PMC free article] [PubMed] [Google Scholar]
- 12. Fisher MM, Triplett EW. 1999. Automated approach for ribosomal intergenic spacer analysis of microbial diversity and its application to freshwater bacterial communities. Appl. Environ. Microbiol. 65:4630–4636 [DOI] [PMC free article] [PubMed] [Google Scholar]
- 13. Fukuda R, Ogawa H, Nagata T, Koike I. 1998. Direct determination of carbon and nitrogen contents of natural bacterial assemblages in marine environments. Appl. Environ. Microbiol. 64:3352–3358 [DOI] [PMC free article] [PubMed] [Google Scholar]
- 14. Gasol JM, et al. 2009. Mesopelagic prokaryotic bulk and single-cell heterotrophic and community composition in the NW Africa-Canary Islands coastal-transition zone. Prog. Oceanogr. 83:189–196 [Google Scholar]
- 15. Gasol JM, Zweifel UL, Peters F, Fuhrman JA, Hagström Å. 1999. Significance of size and nucleic acid content heterogeneity as measured by flow cytometry in natural planktonic bacteria. Appl. Environ. Microbiol. 65:4475–4483 [DOI] [PMC free article] [PubMed] [Google Scholar]
- 16. Gregori G, et al. 2001. Resolution of viable and membrane-compromised bacteria in freshwater and marine waters based on analytical flow cytometry and nucleic acid double staining. Appl. Environ. Microbiol. 67:4662–4670 [DOI] [PMC free article] [PubMed] [Google Scholar]
- 17. Gruber N, et al. 2004. The vulnerability of the carbon cycle in the 21st century: an assessment of carbon-climate-human interactions, p 45–76 In Field CB, Raupach MR. (ed), The global carbon cycle: integrating humans, climate, and the natural world. Island Press, Washington, DC [Google Scholar]
- 18. Haas LW. 1982. Improved epifluorescence microscopy for observing planktonic micro-organisms. Ann. Inst. Oceanogr. 58:261–266 [Google Scholar]
- 19. Hansell DA, Carlson CA. 1998. Deep-ocean gradients of dissolved organic carbon. Nature 395:263–266 [Google Scholar]
- 20. Hewson I, Fuhrman JA. 2004. Richness and diversity of bacterioplankton species along an estuarine gradient in Moreton Bay, Australia. Appl. Environ. Microbiol. 70:3425–3433 [DOI] [PMC free article] [PubMed] [Google Scholar]
- 21. Libes SM. 1992. An introduction to marine biogeochemistry. John Wiley & Sons, New York, NY [Google Scholar]
- 22. Moeseneder MM, Arrieta JM, Muyzer G, Winter C, Herndl GJ. 1999. Optimization of terminal-restriction fragment length polymorphism analysis for complex marine bacterioplankton communities and comparison with denaturing gradient gel electrophoresis. Appl. Environ. Microbiol. 65:3518–3525 [DOI] [PMC free article] [PubMed] [Google Scholar]
- 23. Moeseneder MM, Winter C, Arrieta JM, Herndl GJ. 2001. Terminal restriction fragment length polymorphism (T-RFLP) screening of a marine archaeal library to determine the different phylotypes. J. Microbiol. Methods 44:159–172 [DOI] [PubMed] [Google Scholar]
- 24. Nagata T, Fukuda H, Fukuda R, Koike I. 2000. Bacterioplankton distribution and production in the deep Pacific waters: large-scale geographic variations and possible coupling with sinking particle fluxes. Limnol. Oceanogr. 45:426–435 [Google Scholar]
- 25. Sherry ND, Boyd PW, Sugimoto K, Harrison PJ. 1999. Seasonal and spatial patterns of heterotrophic bacterial production, respiration, and biomass in the subarctic NE Pacific. Deep Sea Res. Part 2 Top. Stud. Oceanogr. 46:2557–2578 [Google Scholar]
- 26. Simon M, Azam F. 1989. Protein content and protein synthesis rates of planktonic marine bacteria. Mar. Ecol. Prog. Ser. 51:201–213 [Google Scholar]
- 27. Smith DC, Azam F. 1992. A simple, economical method for measuring bacterial protein synthesis rates in seawater using 3H-leucine. Mar. Microb. Food Webs 6:107–114 [Google Scholar]
- 28. Swan BK, et al. 2011. Potential for chemolithoautotrophy among ubiquitous bacteria lineages in the dark ocean. Science 333:1296–1300 [DOI] [PubMed] [Google Scholar]
- 29. Tanaka T, Rassoulzadegan F. 2002. Full-depth profile (0–2000 m) of bacteria, heterotrophic nanoflagellates and ciliates in the NW Mediterranean Sea: vertical partitioning of microbial trophic structures. Deep Sea Res. Part 2 Top. Stud. Oceanogr. 49:2093–2107 [Google Scholar]
- 30. Tanaka T, Rassoulzadegan F. 2004. Vertical and seasonal variations of bacterial abundance and production in the mesopelagic layer of the NW Mediterranean Sea: bottom-up and top-down controls. Deep Sea Res. Part 1 Oceanogr. Res. Pap. 51:531–544 [Google Scholar]
- 31. van der Maarel MJEC, Artz RRE, Haanstra R, Forney LJ. 1998. Association of marine Archaea with the digestive tracts of two marine fish species. Appl. Environ. Microbiol. 64:2894–2898 [DOI] [PMC free article] [PubMed] [Google Scholar]
- 32. Whitman WB, Coleman DC, Wiebe WJ. 1998. Prokaryotes: the unseen majority. Proc. Natl. Acad. Sci. U. S. A. 95:6578. [DOI] [PMC free article] [PubMed] [Google Scholar]


