

Abstract
Electron transfer through gas-phase ion–ion reactions has led to the widespread application of electron-based techniques once only capable in ion trapping mass spectrometers. Although any mass analyzer can, in theory, be coupled to an ion–ion reaction device (typically a 3-D ion trap), some systems of interest exceed the capabilities of most mass spectrometers. This case is particularly true in the structural characterization of glycosaminoglycan (GAG) oligosaccharides. To adequately characterize highly sulfated GAGs or oligosac charides above the tetrasaccharide level, a high-resolution mass analyzer is required. To extend previous efforts on an ion trap mass spectrometer, negative electron transfer dissociation coupled with a Fourier transform ion cyclotron resonance mass spectrometer has been applied to increasingly sulfated heparan sulfate and heparin tetrasaccharides as well as a dermatan sulfate octasaccharide. Results similar to those obtained by electron detachment dissociation are observed.
Introduction
The implementation of ion–ion reactions for tandem mass spectrometry applications in commercial mass spectrometers has extended the ability to conduct electron-based ion activation to a variety of platforms through electron transfer dissociation (ETD)1 and negative electron transfer dissociation (NETD).2,3 Previously, the capabilities of electron capture dissociation (ECD)4 and electron detachment dissociation (EDD)5 were only possible in Fourier transform ion cyclotron resonance mass spectrometers (FT-ICR MS)6 and enabled the generation of complementary cleavages to threshold activation and retention of labile modifications such as glycosylation,7 phosphorylation8 and sulfation9 during biomolecule sequencing efforts.
NETD has previously been demonstrated for glycosaminoglycan (GAG) oligosaccharide structural characterization in an ion trap mass spectrometer for tetrasaccharides with low levels of sulfation10 and a detailed account of the development of anion specific electron transfer reactions can be found in that report. The ion trap has limited mass accuracy and resolving power and to extend the utility of NETD for GAG analysis to molecules of high sulfation or polymerization, which produce many products within a narrow mass range,11-14 it is necessary to employ a mass analyzer capable of increased resolving power, such as FT-ICR MS.
In combination with the high-performance aspects of FT-ICR MS, NETD presents an attractive alternative to EDD where ion conversion efficiencies are fundamentally limited by the radial repulsion between a negative charged ion cloud and electron beam.15 By monitoring the electron current entering the mass analyzer, the optimum value for the electron extraction from the cathode can be achieved, but increasing the pulse duration results in an asymptotic return in the efficiency increase; therefore, EDD cannot be conducted efficiently at times-cales shorter than ~1 s and online coupling for the tandem mass spectrometry (MS/MS) of chromatographically separated analytes where the peak window is in the order of milliseconds is not feasible. The application of NETD is only limited by the generation of the reagent radical cation species and subsequent reaction coordinate. Although chemical ionization (CI) sources in electron transfer capable mass spectrometers can generate ions for both ETD and NETD, the generation of radical cations for NETD is much less efficient and presently NETD activation is on order of ~1 s. Further instrumental developments are possible and should allow for the reaction times on the order of milli-seconds, similar to ECD and ETD.
The present work further extends the application of NETD for GAG sequencing into the regimes of high sulfation and polymerization. Although NETD presents a subset of the products generated by EDD, with the other due to direct electronic excitation of the precursor ion,16,17 the product ions generated by an electron-transfer initiated mechanism include glycosidic bond cleavages and cross-ring cleavages and produce remarkably similar spectra when compared to those generated by the EDD of the same precursor ions10 while the coupling with the FT-ICR mass analyzer allows for the isotopic resolution and mass accuracy necessary to characterize more complex GAG MS/MS spectra.
Experimental methods
Synthetic heparan sulfate oligosaccharide preparation
Heparan sulfate tetrasaccharides (HS1 and HS2) were synthesized using a modular approach18 and purified by silica gel column chromatography. Prepared structures were confirmed by 1H nuclear magnetic resonance (NMR) and accurate mass measurement by FT-ICR MS. Compounds were prepared as tetrasaccharides with varying degrees and positions of sulfation as well as hexuronic acid stereochemistry.
Heparin oligosaccharide preparation
Heparin sodium salt (6 g), derived from porcine intestinal mucosa (Celsus Laboratories, Cincinnati, OH, USA), was partially depolymerized with recombinant heparinase 1 (E.C. 4.2.2.7) from F. heparinum to 30% completion, as determined by ultraviolet absorbance at 232 nm, at which point the digestion was quenched by boiling. The oligosaccharide mixture was concentrated on a rotary evaporator, filtered through a 0.22 μm filter, and separated on a 1.5 m × 5.0 cm Bio-Gel P10 column (BioRad, Hercules, CA, USA). The oligosaccharides were eluted at 1.2 mL min−1 with 0.2 M NaCl. Resulting, size-uniform oligosaccharide fractions were desalted and lyophilized. Size-fractionated oligosaccharides were further separated by high-performance liquid chromatography (HPLC) on a 2.0 cm × 25 cm semi-preparative strong anion exchange (SAX) column (Waters Spherisorb S5, Milford, MA, USA) using a 60 min salt gradient at a flow rate of 4.0 mL min−1 with absorbance detection at 232 nm.19 Purity of HPLC-separated oligosaccharides was assessed using a 46 mm × 250 mm SAX column (Waters Spherisorb, 5 μm) and additional semi-preparative purification was carried out when necessary to achieve > 95% purity. All oligosaccharides used in the present work were determined to be > 95% pure by analytical SAX-HPLC, polyacrylamide gel electrophoresis (PAGE) analysis, reverse-phase ion pair (RPIP)-HPLC-electrospray ionization (ESI)-MS, high-resolution MS and 1D and 2D nuclear magnetic resonance (NMR).20
Preparation of dermatan sulfate oligosaccharides
Dermatan sulfate (DS) oligosaccharides were prepared by partial enzymatic depolymerization of porcine intestinal mucosa dermatan sulfate (Celsus Laboratories, Cincinnati, OH, USA). A 20 mg mL−1 solution of DS, in 50 mM tris-HCl/60 mM sodium acetate buffer, pH 8, was incubated at 37°C with chondroitin ABC lyase from Proteus vulgaris, EC 4.2.2.4. (Associates of Cape Cod, E. Falmouth, MA, USA). After the absorbance at 232 nm indicated the digestion was 50% completed, the digestion mixture was heated at 100°C for 3 min. The resulting oligosaccharide mixture was filtered by a 0.22 μm unit (Millipore, Billerica, MA, USA) and fractionated by low-pressure gel-permeation chromatography (GPC) on a Bio-Gel P10 (Bio-Rad, Hercules, CA, USA) column. Fractions containing oligosaccharides of interest were desalted by GPC on a Bio-Gel P2 column and freeze-dried.19 Further purification was carried out using SAX-HPLC on a semi-preparative SAX S5 Spherisorb column (Waters Corp, Milford, MA, USA). The SAX-HPLC fractions containing > 90% of selected oligosaccharides were collected, desalted by GPC and freeze-dried. The solid was reconstituted in water and purified a second time by SAX-HPLC. Only the top 30% of the chromatographic peak was collected, desalted and freeze-dried. Concentration of the oligosaccharide solutions was determined by measuring the absorbance at 232 nm (ε = 800 M-1 cm−1). The resulting fractions containing individual oligosaccharides were characterized by PAGE, ESI-MS, and high-field NMR spectroscopy.21
Mass spectrometry analysis
Experiments were performed on a 12.0T Bruker solariX FT-MS instrument (Bruker Daltonics, Billerica, MA, USA) fitted with an ESI/matrix-assisted laser desorption/ionization (MALDI) dual ion source. The sample solutions were ionized by static nano-electrospray (pulled fused silica tip model BG12-69-2-CE-20; New Objective, Woburn, MA, USA). Solutions of each oligosaccharide were introduced at a concentration of 0.1 mg mL−1 in 50 : 50 acetonitrile:water (Sigma, St Louis, MO, USA). All oligosaccharides were examined in negative ion mode.
For NETD experiments, precursor ions were isolated in the external quadrupole and accumulated for 1–3 seconds in the hexapole collision cell before reaction with the reagent radical cation. The fluoranthene radical cation was generated in the CI source and reacted for 500–1000 ms in the collision cell. The precursor ion and NETD products were then injected into the mass analyzer through an RF-only ion guide. One analyzer cell fill was utilized per scan. Twenty four to thirty six acquisitions were signal averaged per mass spectrum except for DS dp8 for which 100 scans were acquired. For each mass spectrum, 1 M points were acquired, padded with one zero fill and apodized using a sinebell window. Background spectra were acquired by leaving all parameters the same but without the introduction of the radical cation into the collision cell. External calibration of mass spectra produced mass accuracy of 5 ppm. Internal calibration was also performed using confidently assigned glycosidic bond cleavage products as internal calibrants, providing mass accuracy of < 1 ppm. Due to the large number of low intensity products formed by NETD, only peaks with S/N > 10 are reported. Product ions were assigned using accurate mass measurement and Glycoworkbench.22 All products are reported using the Wolff–Amster annotation12 of the Domon and Costello nomenclature.23 In annotated spectra, charge states are assigned as 1− unless indicated otherwise.
Results and discussion
NETD is proposed to encompass the low-energy radical based reaction pathway during EDD.10,16 As such, the neutral loss of labile sulfate groups such as SO3 is observed in all examined cases and warrants explanation. This result may be due to a combination of several factors, both instrumental and GAG-specific. The instrumental induced loss of SO3 may arise from the conditions of the hexapole collision cell. The pressure in this region is relatively high when compared to the mass analyzer (10−4 Torr vs 10−10 Torr). The increased frequency of collisions and DC potentials present before and after the RF-only conditions induced for the ion–ion reaction period could lead to low-energy CID events, and the loss of SO3 is known as a low-energy dissociation pathway. Alternatively, protonated sulfate moieties could be lost as neutral SO3 through two potential pathways due to the known H-rearrangement mechanism.24 First, the introduction of protonated fluorathene along with the radical cation is unavoidable as there is only 1 amu difference between the two species and would provide a species for gas-phase proton transfer. Alternatively, the radical intermediate of the precursor ion generated by the NETD reaction could react with water, resulting in H-transfer. Either possibility is likely and supported by the observation of intact precursor and fragment ions containing more protonated sulfate groups than the original precursor. A final possibility is the mobility of acidic protons along the GAG oligomer. In all examined cases, the precursor ions correspond to instances where all sulfates are ionized or paired with a sodium counter ion. In the following analyses, increased cross-ring cleavage is observed on hexuronic acid residues. Based on pKa, the sulfate groups are ionized and carboxyl groups protonated in these precursor ions. To generate an ionized carboxyl and produce a site for electron transfer, it is necessary for the proton to mobilize25 and migrate, therefore protonating the sulfate group and leading to the pathway for neutral loss as SO3. It is likely that a combination of the above pathways occurs and further mechanistic studies are warranted.
HS1 (GlcA–GlcNAc6S–IdoA–GlcNAc6S–(CH2)5–NH2)
The NETD of lowly sulfated GAG tetrasaccharides (1 or less per disaccharide unit) has been reported10 and the inclusion of data for the case of HS1 is performed for the sake of generating a sulfation gradient in the current work. Shown in Figure 1 is the NETD mass spectrum for the [M–2H]2− precursor of HS1. Consistent with results from GAG NETD in an ion trap, both the charge-reduced precursor ([M–2H]•−) and protonated precursor ([M–H]1−) are assigned,10 indicating both electron transfer and protonation events in the hexapole collision cell of the FT-MS instrument. Abundant bond cleavage is observed, including glycosidic and cross-ring products, but not all glycosidic bond possibilities are present in the spectrum (B1, C1, and Z1 are absent). The assignment of 6–O–sulfation on the central N-acetylglucosamine can be determined by the mass difference between the 1,4X2 and 1,5X2 cross-ring cleavages, but is not possible on the reducing end due to only one cross-ring cleavage assignment. Cross-ring cleavages are located largely on the hexuronic acid residues, which suggests proton mobility and relocation of the ionized site from the sulfate groups to the carboxyl where electron transfer can occur. Interestingly, the 0,2A3 product ion, that is indicative of GlcA in tetrasaccharides with no or one site of sulfation, occurs in this IdoA-containing compound through a solely radical-based ion fragmentation pathway. The occurrence of this ion in di-sulfated tetrasaccharides containing either GlcA or IdoA has been reported for the EDD of this epimer pair.14
Figure 1.

NETD of the [M–2H]2- precursor ion for HS1.
HS2 (GlcA–GlcNAc6S–IdoA2S–GlcNAc6S–(CH2)5–NH2)
The addition of 2–O–sulfation to HS1 leads to HS2, increasing the sites of sulfation from two to three. Shown in Figure 2, is the NETD of the [M–3H]3− precursor ion. Abundant fragmentation of the precursor is observed with the highest densities of bond cleavage on the hexuronic acids. On the non-reducing end (NRE) terminus, five cross-ring cleavages are assigned and four on the central iduronic acid. Consistent with prior results during the NETD of GAGs,10 instances of both charge reduction by protonation and electron transfer are observed. From the HS2 [M–3H]3− precursor ion, two transfer events occur and produce the [M–3H]2•− and [M–2H]•− ions as well as the protonated [M–2H]2− and [M–H]1− ions. Losses of 1H and 2H are observed from both glycosidic and cross-ring bond cleavages.
Figure 2.
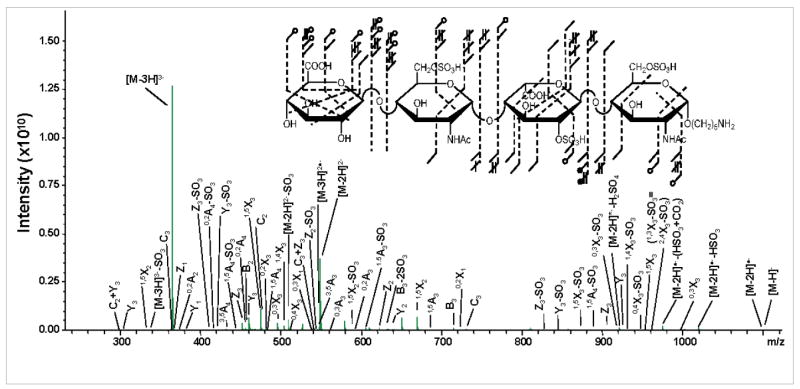
NETD of the [M-3H]3- precursor ion for HS2.
NETD only provides the definitive assignment of two sites of sulfation in this case, the 2–O–sulfation on the central IdoA residue by the difference in mass of the 0,2A3 and 1,5A3 ions and 6–O–sulfation of the reducing end (RE) N-acetylglucosamine by the difference in mass for the 3,5A4 and C3 ions. Insufficient cross-ring cleavages are generated on the central N-acetylglucosamine for definitive 6–O assignment. For comparison, the annotated structure for the EDD of the same precursor14 is shown in Figure 3. EDD provides the ability to locate the 6–O–sulfation by the generation of the 3,5A2 cross-ring cleavage, presumably by electronic excitation events, but does not provide the RE sulfate location. Although detachment processes occur during EDD, not all products from NETD are observed in the EDD fragmentation. This difference is especially true when the number of acidic residue cleavages is compared between the two activation methods, where EDD generates a total of five and NETD a total of nine.
Figure 3.
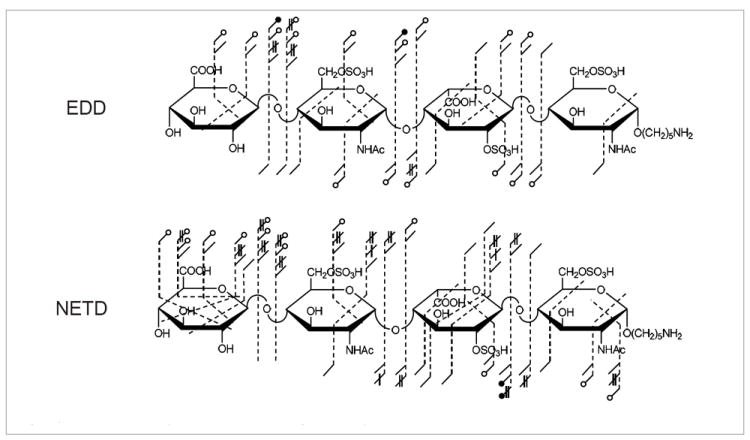
Comparison of the product ion distributions generated by EDD and NETD for HS2.
H3 (ΔUA2S–GlcNS6S–IdoA2S–GlcNS6S)
The most highly charged and sulfated GAG oligosaccharides belong to the heparin glycoform class. Due to the high charge density (2.7 ionized sites per disaccharide),26 the precursor ions appear at low m/z (200–300) and products due to charge reduction span a range from approximately 150–550 m/z during a MS/MS event, shown in Figure 4 for the NETD of the hexasul-fated tetrasaccharide, H3. The mass accuracy and resolving power necessary to confidently assign the multiply-charged products of such an experiment is not foreseeable in an ion trap mass spectrometer and only available in an instrument such as an FT-ICR mass spectrometer.
Figure 4.
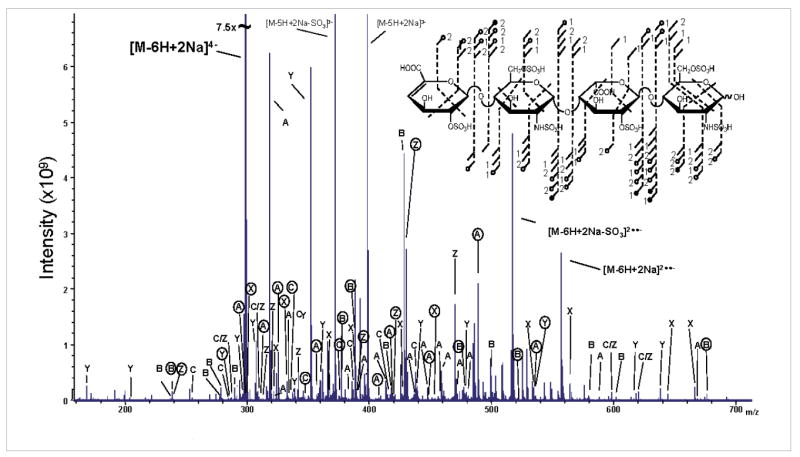
NETD mass spectrum of the [M-6H+2Na]4- precursor of H3.
The annotated MS/MS spectrum for the NETD of the [M–6H+2Na]4− precursor is depicted in Figure 4. Due to the high peak density, a simple annotation has been employed to denote the cleavage type and loss of sulfate. Assigned product ions are annotated with the letter of the cleavage type, for example, A for 0,2A3 and a circled letter is indicative of the loss of sulfate from a product ion. A supplemental list, including peak assignments and m/z values, is included. Product ions are assigned that correspond to cleavage of all glycosidic bonds. Losses of sulfate are observed for all glycosidic bond product ions except C1 and Z2. Compared to the distribution of cross-ring cleavage product ions in heparan sulfate tetrasaccharides with lower sulfation, the cross-ring products are more uniform across the length of the oligomer. The coverage of cross- ring cleavages allows for the assignment of all six sites of sulfation. In contrast to the EDD of the same precursor ion, only five sites could be definitively assigned.13 As seen in Figure 4, the NETD of H3 also includes the neutral losses of SO3, CO2, and H2O (only SO3 is annotated) from the doubly reduced species, [M–6H+2Na]2••−.
H4 (ΔUA2S–GlcNS6S–GlcA–GlcNS6S) and H5 (ΔUA2S–GlcNS6S–IdoA2S–GlcNS)
The NETD product ion assignments of two penta-sulfated heparin tetrasaccharides are shown in Figure 5 for the inclusion of variation in hexuronic acid stereochemistry and sulfation when compared to H3. Consistent with the NETD of H3, complete glycosidic and sufficient cross-ring cleavage is observed to locate all sites of sulfation on each tetrasaccharide. Comparison between the three heparin tetrasaccharides reveals a variation in sulfate loss. In particular, the NETD of H4 indicates decreased levels of sulfate loss, specifically multiple losses of SO3 from higher cleavages. Close examination of the structures reveals that H3 and H5 contain IdoA2S residues that present a pathway for proton movement from the carboxyl to the ionized sulfate, whereas H4 contains an un-sulfated GlcA. Unfortunately, a true epimer pair is not currently available to enable direct comparison.
Figure 5.
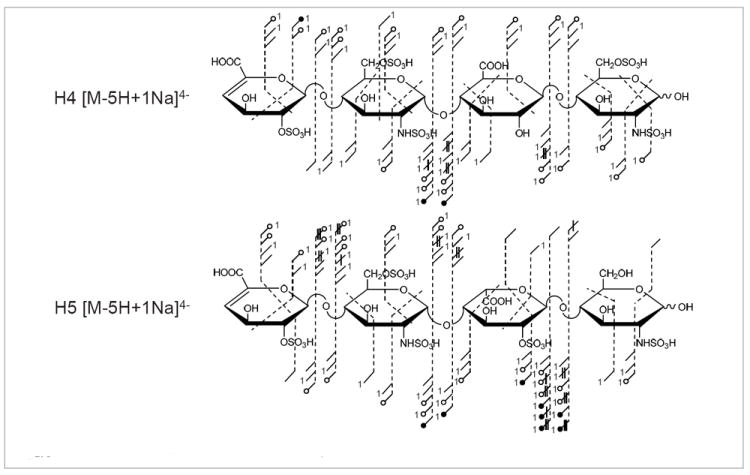
Annotated structures for the NETD of H4 and H5.
DS dp8 [ΔUA–(GalNAc4S–IdoA)3–GalNAc4S]
The EDD of DS dp8 generates a complex MS/MS spectrum11 that requires a mass analyzer capable of high resolving power. By extension, the NETD of the same octasaccharide ([M–4H]4− precursor) should produce a similar spectrum and is shown in Figure 6. Abundant cleavage is observed for both glycosidic and cross-ring bonds with accompanying losses of H and 2H. No ions are assigned in the NETD spectrum that are not present during EDD. The loss of one sulfate group is observed for most glycosidic bond cleavages and in several cross-ring cleavages (mainly 1,5Xn). In no instance are more than two sulfate groups lost from a product ion. Cross-ring cleavages are largely assigned to hexuronic acid residues and are consistent with the observation during EDD of the same precursor ion11 and of mobile protons in CS GAGs during MS/MS.25
Figure 6.

Spectra and annotated structures for the EDD and NETD DS dp8.
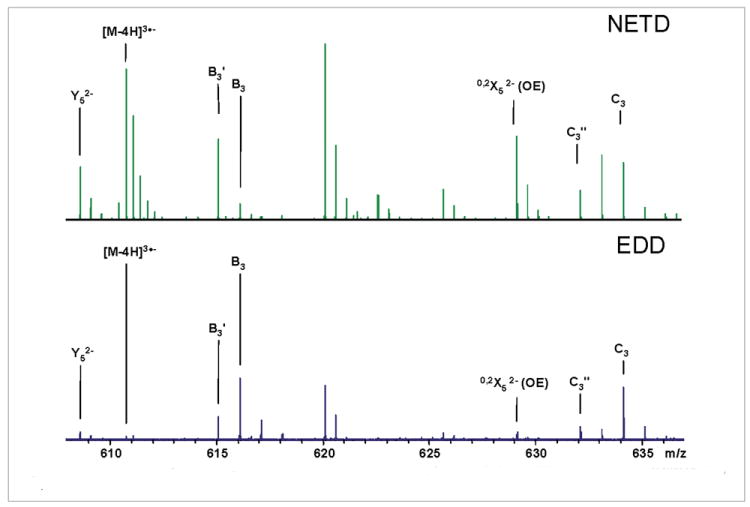
Of note is the low number of product ions in the low m/z region below the precursor ion. This result is also observed during the NETD of lipids (unpublished results, Bruker Daltonics). Due to the lack of electron-induced dissociation (EID)17,27 products that are charge conserved, i.e. 4− products from a 4− precursor, during NETD and possible protonation of high mass ions that bore multiple charges and results in a higher m/z than in EDD, this region of the mass spectrum appears vacant, as shown in Figure 7. The relative intensity of odd-electron (OE) products is increased in the NETD spectrum. These include the charge-reduced species, [M–4H]3•−, 0,2X7, 0,2X5 and B3′, shown in Figure 8.
Figure 7.
Annotated spectra showing the low m/z region of the EDD and NETD for the [M–4H]4- precursor of DS dp8.
Figure 8.
Annotated spectra showing selected odd-electron products assigned from the EDD and NETD of the [M-4H]4- precursor of DS dp8.
Conclusions
The combination of ion–ion reactions for MS/MS ion dissociation and subsequent mass analysis by FT-ICR MS is highly suited for the structural characterization of sulfated glycosaminoglycan oligosaccharides. NETD provides the ability to generate sufficient cross-ring cleavages for location of sites of sulfation while FT-ICR provides the mass accuracy and resolving power necessary to confidently assign the large number of product ions distributed in a narrow m/z window. Although slight differences are observed when EDD and NETD products are compared, due to the lack of electronic excitation products, NETD presents a pathway to apply electron-based ion activation to online-chromatographic separation as it is not limited to longer time scales as is EDD.
Acknowledgments
FEL, III, ZX, ML, TL, RJL and IJA gratefully acknowledge financial support from the National Institutes of Health grant #2R01-GM038060-16. FEL, III, SA, KM, AV, GJB and IJA gratefully acknowledge financial support from the Center for Research Resource of the National Institutes of Health Grant # P41RR005351. FEL, III personally acknowledges the University of Georgia Graduate School for funding from a Dissertation Completion Award and Bruker Daltonics (Billerica, MA, USA) for solariX instrument time.
References
- 1.Syka JEP, Coon JJ, Schroeder MJ, Shabanowitz J, Hunt DF. Peptide and protein sequence analysis by electron transfer dissociation mass spectrometry. Proc Natl Acad Sci USA. 2004;101:26. doi: 10.1073/pnas.0402700101. [DOI] [PMC free article] [PubMed] [Google Scholar]
- 2.Herron WJ, Goeringer DE, McLuckey SA. Gas-phase electron transfer reactions from multiply-charged anions to rare gas cations. J Am Chem Soc. 1995;117:46. doi: 10.1021/ja00151a021. [DOI] [Google Scholar]
- 3.Coon JJ, Shabanowitz J, Hunt DF, Syka JEP. Electron transfer dissociation of peptide anions. J Am Soc Mass Spectrom. 2005;16:6. doi: 10.1016/j.jasms.2005.01.015. [DOI] [PubMed] [Google Scholar]
- 4.Zubarev RA, Kelleher NL, McLafferty FW. Electron capture dissociation of multiply charged protein cations. A nonergodic process. J Am Chem Soc. 1998;120:13. doi: 10.1021/ja973478k. [DOI] [PubMed] [Google Scholar]
- 5.Budnik BA, Haselmann KF, Zubarev RA. Electron detachment dissociation of peptide dianions: an electron-hole recombination phenomenon. Chem Phys Lett. 2001;342:3–4. doi: 10.1016/S0009-2614(01)00501-2. [DOI] [Google Scholar]
- 6.Marshall AG, Hendrickson CL, Jackson GS. Fourier transform ion cyclotron resonance mass spectrometry: A primer. Mass Spectrom Rev. 1998;17:1. doi: 10.1002/(SICI)1098-2787(1998)17:1<1∷AID-MAS1>3.0.CO;2-K. [DOI] [PubMed] [Google Scholar]
- 7.Mirgorodskaya E, Roepstorff P, Zubarev RA. Localization of O-glycosylation sites in peptides by electron capture dissociation in a Fourier transform mass spectrometer. Anal Chem. 1999;71:20. doi: 10.1021/ac990578v. [DOI] [PubMed] [Google Scholar]
- 8.Shi SDH, Hemling ME, Carr SA, Horn DM, Lindh I, McLafferty FW. Phosphopeptide/phosphoprotein mapping by electron capture dissociation mass spectrometry. Anal Chem. 2000;73:1. doi: 10.1021/ac000703z. [DOI] [PubMed] [Google Scholar]
- 9.Wolff JJ, Amster IJ, Chi L, Linhardt RJ. Electron detachment dissociation of glycosaminoglycan tetrasaccharides. J Am Soc Mass Spectrom. 2007;18:2. doi: 10.1016/j.jasms.2006.09.020. [DOI] [PMC free article] [PubMed] [Google Scholar]
- 10.Wolff JJ, Leach FE, Laremore TN, Kaplan DA, Easterling ML, Linhardt RJ, Amster IJ. Negative electron transfer dissociation of glycosaminoglycans. Anal Chem. 2010;82:9. doi: 10.1021/ac100554a. [DOI] [PMC free article] [PubMed] [Google Scholar]
- 11.Wolff JJ, Laremore TN, Busch AM, Linhardt RJ, Amster IJ. Electron detachment dissociation of dermatan sulfate oligosaccharides. J Am Soc Mass Spectrom. 2008;19:2. doi: 10.1016/j.jasms.2007.10.007. [DOI] [PMC free article] [PubMed] [Google Scholar]
- 12.Wolff JJ, Laremore TN, Busch AM, Linhardt RJ, Amster IJ. Influence of charge state and sodium cationization on the electron detachment dissociation and infrared multiphoton dissociation of glycosaminoglycan oligosaccharides. J Am Soc Mass Spectrom. 2008;19:6. doi: 10.1016/j.jasms.2008.03.010. [DOI] [PMC free article] [PubMed] [Google Scholar]
- 13.Leach FE, III, Xiao Z, Laremore TN, Wolff JJ, Linhardt RJ, Amster IJ. Electron detachment dissociation and infrared multiphoton dissociation of heparin glycosaminoglycan tetrasaccharides. Manuscript in preparation for submission to Intl J Mass Spectrom. 2010 [Google Scholar]
- 14.Leach FE, III, Oh HB, Arungundram S, Al-Mafraji K, Venot A, Boons G-J, Amster IJ. Electron detachment dissociation of synthetic heparan sulfate tetrasaccharides varying in degree of sulfation and hexuronic acid stereochemistry. Manuscript submitted to Anal Chem. 2010 doi: 10.1016/j.ijms.2012.07.002. [DOI] [PMC free article] [PubMed] [Google Scholar]
- 15.Leach FE, III, Wolff JJ, Laremore TN, Linhardt RJ, Amster IJ. Evaluation of the experimental parameters which control electron detachment dissociation, and their effect on the fragmentation efficiency of glycosaminoglycan carbohydrates. Int J Mass Spectrom. 2008;276:2–3. doi: 10.1016/j.ijms.2008.05.017. [DOI] [PMC free article] [PubMed] [Google Scholar]
- 16.Leach FE, III, Ly M, Laremore TN, Wolff JJ, Linhardt RJ, Amster IJ. Electron detachment dissociation and hexuronic acid determination in chondroitin sulfate glycosaminoglycan oligosaccharides. Manuscript in preparation for submission to J Am Soc Mass Spectrom. 2010 doi: 10.1007/s13361-012-0428-5. [DOI] [PMC free article] [PubMed] [Google Scholar]
- 17.Wolff JJ, Laremore TN, Aslam H, Linhardt RJ, Amster IJ. Electron-induced dissociation of glycosaminoglycan tetrasaccharides. J Am Soc Mass Spectrom. 2008;19:10. doi: 10.1016/j.jasms.2008.06.024. [DOI] [PMC free article] [PubMed] [Google Scholar]
- 18.Arungundram S, Al-Mafraji K, Asong J, Leach FE, Amster IJ, Venot A, Turnbull JE, Boons G-J. Modular synthesis of heparan sulfate oligosaccharides for structure-activity relationship studies. J Am Chem Soc. 2009;131:47. doi: 10.1021/ja907358k. [DOI] [PMC free article] [PubMed] [Google Scholar]
- 19.Pervin A, Gallo C, Jandik KA, Han X-J, Linhardt RJ. Preparation and structural characterization of large heparin-derived oligosaccharides. Glycobiology. 1995;5:1. doi: 10.1093/glycob/5.1.83. [DOI] [PubMed] [Google Scholar]
- 20.Xiao Z, Zhao W, Yang B, Zhang Z, Guan H, Linhardt RJ. Heparinase 1 selectivity for the 3,6-di-O-sulfo-2-deoxy-2-sulfamido-Œ±-D-glucopyranose (1,4) 2–O–sulfo– Œ±–L–idopyranosyluronic acid (GlcNS3S6S–IdoA2S) linkages. Glycobiology. doi: 10.1093/glycob/cwq123. [DOI] [PMC free article] [PubMed] [Google Scholar]
- 21.Munoz E, Xu D, Avci F, Kemp M, Liu J, Linhardt RJ. Enzymatic synthesis of heparin related polysaccharides on sensor chips: Rapid screening of heparin-protein interactions. Biochem Biophys Res Commun. 2006;339:2. doi: 10.1016/j.bbrc.2005.11.051. [DOI] [PMC free article] [PubMed] [Google Scholar]
- 22.Ceroni A, Maass K, Geyer H, Geyer R, Dell A, Haslam SM. GlycoWorkbench: A tool for the computer-assisted annotation of mass spectra of glycans. J Proteome Res. 2008;7:4. doi: 10.1021/pr7008252. [DOI] [PubMed] [Google Scholar]
- 23.Domon B, Costello CE. A systematic nomenclature for carbohydrate fragmentations in FAB-MS/MS spectra of glycoconjugates. Glycoconjugate J. 1988;5:4. doi: 10.1007/BF01049915. [DOI] [Google Scholar]
- 24.Zaia J. Principles of mass spectrometry of glycosaminoglycans. J Biomol Mass Spectrom. 2005;1 [Google Scholar]
- 25.Zaia J, Miller MJC, Seymour JL, Costello CE. The role of mobile protons in negative ion CID of oligosaccharides. J Am Soc Mass Spectrom. 2007;18:5. doi: 10.1016/j.jasms.2007.01.016. [DOI] [PMC free article] [PubMed] [Google Scholar]
- 26.Capila I, Linhardt RJ. Heparin–protein interactions. Angew Chem Int Ed. 2002;41:3. doi: 10.1002/1521-3773(20020201) 41:3<390∷AID-ANIE390>3.0.CO;2-B. [DOI] [PubMed] [Google Scholar]
- 27.Cody RB, Freiser BS. Electron impact excitation of ions from organics: an alternative to collision induced dissociation. Anal Chem. 1979;51:4. doi: 10.1021/ac50040a022. [DOI] [Google Scholar]