

Abstract
The Bacillus subtilis ferric uptake regulator (Fur) protein is the major sensor of cellular iron status. When iron is limiting for growth, derepression of the Fur regulon increases the cellular capacity for iron uptake and mobilizes an iron-sparing response mediated in large part by a small noncoding RNA named FsrA. FsrA functions, in collaboration with three small basic proteins (FbpABC), to repress many “low-priority” iron-containing enzymes. We have used transcriptome analyses to gain insights into the scope of the iron-sparing response and to define subsets of genes dependent for their repression on FsrA, FbpAB, and/or FbpC. Enzymes of the tricarboxylic acid (TCA) cycle, including aconitase and succinate dehydrogenase (SDH), are major targets of FsrA-mediated repression, and as a consequence, flux through this pathway is significantly decreased in a fur mutant. FsrA also represses the DctP dicarboxylate permease and the iron-sulfur-containing enzyme glutamate synthase (GltAB), which serves as a central link between carbon and nitrogen metabolism. Allele-specific suppression analysis was used to document a direct RNA-RNA interaction between the FsrA small RNA (sRNA) and the gltAB leader region. We further demonstrated that distinct regions of FsrA are required for the translational repression of the GltAB and SDH enzyme complexes.
INTRODUCTION
The tricarboxylic acid (TCA) cycle is a central pathway of Bacillus subtilis metabolism. The flux of carbon through the TCA cycle generates ATP through substrate-level phosphorylation and by the generation of reducing equivalents that feed the electron transport chain. TCA cycle intermediates also serve as biosynthetic precursors for numerous amino acids, heme, and other key metabolites (4, 9, 18, 21, 43). Of particular note, α-ketoglutarate is transaminated by glutamate synthase using glutamine as a donor to generate two glutamate molecules. Thus, glutamate synthase serves as a direct link between central carbon metabolism and nitrogen metabolism. Citric acid, another key intermediate in the TCA cycle, can also play a role in metal ion homeostasis by facilitating the uptake of cations, including Fe(III), Mg(II), and Mn(II) (25, 30).
Since the TCA cycle is central to many biosynthetic and metabolic processes, several regulators exact tight control over the expression of TCA cycle enzymes, including both global (CcpA, CodY, and TnrA) and pathway-specific (CcpC, RocR, and GltC) regulators (39). To this list, we can now add the ferric uptake regulator (Fur). Fur has dual roles in iron homeostasis. Under iron-limiting growth conditions, derepression of numerous Fur-regulated operons (2) allows expression of siderophore biosynthesis and uptake pathways (30). Many other genes are downregulated in the fur mutant (2), including several with roles in central metabolism. Many of the genes downregulated in the fur mutant may be the targets of a Fur-regulated sRNA A (FsrA) and three small, Fur-regulated basic proteins (FbpABC) that can act as coregulators with FsrA. These effectors repress the translation of target genes and thereby contribute to an iron-sparing response (15). This response enables the cell to prioritize iron usage by reducing the synthesis of low-priority, iron-containing proteins, which thereby spares iron for more essential functions. The B. subtilis iron-sparing response was defined by proteomics and was observed to include at least two enzymes involved in the TCA cycle, aconitase and succinate dehydrogenase (15). Conceptually, the FsrA-mediated iron-sparing response appears to be functionally analogous to that mediated by the RyhB small, noncoding RNA (sRNA) of Escherichia coli (28).
Metabolomics studies have also implicated a role for Fur in regulation of the TCA cycle. Fischer and Sauer observed that a null mutation of fur produced one of the greatest growth defects among the 137 strains tested, and this was correlated with a significantly (23%) reduced flux through the TCA cycle and a 3-fold reduction in citrate synthase activity (14). These dramatic effects contrasted with the minimal changes noted in the vast majority of strains, consistent with the notion that B. subtilis has a very robust metabolism: there are sufficient opportunities for metabolic rerouting that most mutations tested did not lead to measurable growth effects. Although these previous results indicated that the fur mutation had significant effects on TCA cycle activity, the regulatory pathways that led to these effects were not defined.
Here we extend our characterization of the FsrA-mediated iron-sparing response using transcriptomic, fluxomic, and molecular genetic analyses. Our results suggest that iron limitation leads to a physiologically significant repression of the TCA cycle. In addition, the FsrA sRNA mediates repression of glutamate synthase (which serves as the key link between central carbon and nitrogen metabolism) and a dicarboxylate transporter (DctP) that is important for growth on TCA cycle intermediates. Our results support a model in which the FsrA small RNA, in conjunction with the FbpABC coregulators, remodels central metabolism as a strategy to prioritize the usage of iron.
MATERIALS AND METHODS
Bacterial strains, media, and growth conditions.
Bacterial strains used in this study are listed in Table 1. Escherichia coli DH5α was used for routine DNA cloning (35). B. subtilis CU1065 mutant strains were constructed by using long-flanking homology PCR (6). Erythromycin (1 μg/ml) and lincomycin (25 μg/ml) (for macrolide-lincosamide-streptomycin B [MLS] resistance), spectinomycin (100 μg/ml), kanamycin (10 μg/ml), and chloramphenicol (5 μg/ml) were used for the selection of various B. subtilis strains unless otherwise indicated. Liquid media were inoculated from an overnight preculture and incubated at 37°C with shaking at 225 rpm. Growth media used in this study include LB medium, modified competence medium (MC), minimal growth medium (morpholinepropanesulfonic acid [MOPS]-based with a glucose carbon source [MM] [8]), fumarate minimal growth medium (MOPS based with a 2% fumarate carbon source [fumarate MM]), succinate minimal growth medium (MOPS-based with 2% succinate as a carbon source [succinate MM]) (5), Belitsky minimal medium (40), and M9 minimal growth medium (19, 24). Growth curves were done using a Bioscreen C MBR system for 24 h and recording the optical density at 600 nm (OD600) every 15 min.
Table 1.
Strains and primers used in this study
| Strain or plasmid | Relevant characteristic(s) | Source or reference |
|---|---|---|
| B. subtilis | ||
| CU1065 | W168 att SPβtrpC2 (WT) | 42 |
| HB2501 | CU1065 fur::kan | 2 |
| HB5733 | CU1065 fur::kanfsrA::cat | 15 |
| HB5735 | CU1065 fur::kanfbpAB::tet | 15 |
| HB5737 | CU1065 fur::kan fbpC::MLS | 15 |
| HB5750 | CU1065 fur::kan fsrA::cat fbpC::MLS | 15 |
| HB5751 | CU1065 fur::kan fsrA::cat fbpAB::tet | 15 |
| HB5752 | CU1065 fur::kan fsrA::cat fbpAB::tet fbpC::MLS | 15 |
| HB8264 | CU1065 fur::kan fbpAB::tet fbpC::MLS | 15 |
| HB12551 | CU1065 amyE::dctP-FLAG (pPL82) | This study |
| HB12558 | CU1065 fur::kanamyE::dctP-FLAG (pPL82) | This study |
| HB12562 | CU1065 dctP::pMUTIN-FLAG | This study |
| HB12563 | CU1065 fur::kan dctP::pMUTIN-FLAG | This study |
| HB12564 | CU1065 fur::kanfsrA::cat dctP::pMUTIN-FLAG | This study |
| HB12573 | CU1065 fur::kanfsrA::catamyE::fsrA | This study |
| HB11008 | CU1065 fur::kan PgltA1::pMUTIN4 | This study |
| HB11009 | CU1065 fur::kan PgltA2::pMUTIN4 | This study |
| HB11010 | CU1065 fur::kan PgltA3::pMUTIN4 | This study |
| HB11018 | HB11008 fsrA::cat thrC::fsrAspc complementation of gltA1 | This study |
| HB11019 | HB11009 fsrA::cat thrC::fsrAspc complementation of gltA2 | This study |
| HB11020 | HB11010 fsrA::cat thrC::fsrAspc complementation of gltA3 | This study |
| E. coli | ||
| DH5α | ϕ80 Δ(lacZ)M15 Δ(argF–lac)U169 endA1recA1hsdR17(rK− mK+) deoRthi-1 supE44 gyrA96 relA1 | 35 |
| Plasmids | ||
| pDG1730 | Integration vector for amyE locus | BGSC |
| pMUTIN-FLAG | Integration vector at locus generating a C-terminal flag tagged ORF | BGSC |
| pPL82 | IPTG-inducible [Pspac(hy)] integration vector for amyE locus | 33 |
| Primers | ||
| dctPpPL82FWD | GCGCTCTAGAAGGAGGAGGATATGAAACTGTTTAAAAA | XbaI site added |
| dctPpPL82REV | GCGCATCGATTTATTATTTATCATCATCATCTTTATAATCGACTGCTGTTTTCATTTT | ClaI and FLAG sequence added |
| dctP_pMUTIN-FLAG_FWD | GCGCGGTACCTTCGCTTCATTAAGGATGAG | KpnI site added |
| dctP_pMUTIN-FLAG_REV | GCGCATCGATGACTGCTGTTTTCATTTTTTTC | ClaI site added |
| fsrA_pDG1730_FWD | GCGCGAATTCTGATGAAGAAGGCGATCAG | EcoRI site added |
| fsrA_pDG1730_REV | GCGCGGATCCGTTCGGCACTCAATGTTTC | BamHI site added |
For 13C-labeling experiments, cultures were grown in 250-ml baffled shake flasks containing 20 ml citrate-amended M9, supplemented either with 100% (wt/wt) [1-13C]glucose (99%; Cambridge Isotope Laboratories) or with a mixture of 20% (wt/wt) [U-13C]glucose (99%; Cambridge Isotope Laboratories) and 80% (wt/wt) natural-abundance glucose. Citrate (3.4 mM) is required in these studies to increase iron availability and thereby decrease the expression of the Fur regulon in wild-type cells (data not shown).
DNA manipulations.
Routine molecular biology procedures were performed as previously described (35). Isolation of B. subtilis chromosomal DNA and transformation were carried out as previously described (10). Restriction enzymes, DNA ligase, and DNA polymerases were all used according to the manufacturer's instructions (New England BioLabs). Site-directed mutagenesis was done by PCR and overlap extension as previously described (20). Primers used in the construction of strains are included in Table 1 and Table S1 in the supplemental material.
For FsrA complementation, fsrA was PCR amplified to include its native promoter and terminator stem-loop and inserted between the EcoRI and BamHI sites of pDG1730 (17). The construct was then integrated ectopically at the amyE locus.
Due to the large size of the gltAB region, the gltAB promoter region containing all regulatory elements, and 175 bp downstream of the start codon was cloned into pMUTIN4 (41) and integrated into the gltAB locus using Campbell integration. The gltAB promoter region was isolated from the genome of the mutants by PCR, and the correct clones were identified by DNA sequencing.
The inducible dctP-FLAG construct was generated by PCR amplification of the dctP gene, including the ribosome binding site (RBS) and start codon in the forward primer and by addition of the FLAG epitope tag sequence on the reverse primer. This amplified product was cloned between the XbaI and ClaI sites of the pPL82 expression vector and integrated into the amyE locus (33). The pMUTIN-FLAG dctP construct was generated by PCR amplification of the dctP open reading frame excluding the start and stop codons and remaining in frame at the 3′ end. Addition of KpnI and ClaI sites to the forward and reverse primers, respectively, allowed for the integration of the amplified product into the multicloning site of the pMUTIN-FLAG vector. This generated a C-terminal FLAG epitope-tagged dctP gene when integrated into the B. subtilis genome at its native locus. The sequences for all mutant constructs were verified by DNA sequencing (Cornell Life Sciences Core Laboratories Center).
RNA isolation and microarray analysis.
Strains CU1065 (wild type [WT]), HB2501 (fur), HB5733 (fur fsrA), HB5735 (fur fbpAB), HB5737 (fur fbpC), and HB8264 (fur fbpABC) were inoculated into LB and grown at 37°C with vigorous shaking until an OD600 of ∼0.4 (Spectronic 21) was reached, and RNA isolation was performed using the RNeasy minikit (Qiagen). RNA was DNase treated with Turbo DNA-free (Ambion) and precipitated overnight. The RNA was dissolved in RNase-free water and quantified using a NanoDrop spectrophotometer (Nanodrop Tech. Inc., Wilmington, DE). RNA was isolated from three biological replicates.
cDNA synthesis was performed using the SuperScript Plus indirect cDNA labeling system (Invitrogen) as per the manufacturer's instructions with 20 μg of total RNA and then purified using the Qiagen MiniElute kit (Qiagen, MD) and quantified with NanoDrop. Total cDNA was labeled overnight with Alexa Fluor 555 or Alexa Fluor 647 (Invitrogen), purified using the Qiagen MiniElute kit, and quantified with NanoDrop. Equal amounts (100 to 150 pmol) of labeled cDNA (fur and WT, fur and fur fsrA, fur and fur fbpAB, fur and fur fbpC, and fur and fur fbpABC) were combined to a final volume of 15 μl, and 1 μl salmon sperm DNA (10 mg/ml; Invitrogen) plus 16 μl 2× hybridization buffer (50% formamide, 10× SSC [1× SSC is 0.15 M NaCl plus 0.015 M sodium citrate], and 0.1% sodium dodecyl sulfate [SDS]) were added. The cDNA mix was denatured at 95°C and hybridized for 16 to 18 h at 42°C to DNA microarray slides which had been prehybridized for at least 30 min at 42°C in 1% bovine serum albumin, 5× SSC, and 0.1% SDS, washed in water, and dried. Following hybridization, the slides were washed sequentially in 2× SSC plus 0.1% SDS for 5 min at 42°C, 2× SSC plus 0.1% SDS for 5 min at room temperature, 2× SSC for 5 min at room temperature, and 0.2× SSC for 5 min at room temperature and finally dipped in water and spun until dry. Arrays were scanned using a GenePix 4000B array scanner (Axon Instruments, Inc.). Our arrays are based on a B. subtilis oligonucleotide library manufactured by Sigma-Genosys consisting of 4,128 oligonucleotides (65-mers) representing 4,106 B. subtilis genes, 10 control oligonucleotides (from E. coli and Brome mosaic virus), and 12 random oligonucleotides. A single oligonucleotide was designed to represent each of the B. subtilis genes as annotated in the genome data, release R16.1 (26 April 2001), at the SubtiList website (http://genolist.pasteur.fr/SubtiList/) (29). The arrays were printed onto poly-l-lysine-coated Corning CMT-Gap slides at the W.M. Keck Foundation Biotechnology Resource Laboratory, Yale University. Each array contains 8,447 features corresponding to duplicates of each open reading frame-specific oligonucleotide, additional oligonucleotides of control genes, and 50% dimethyl sulfoxide blank controls.
Raw data files were produced from the scanned images using the GenePix Pro 4.0 software package (GPR files), and the red/green fluorescence intensity values were normalized such that the ratio of medians of all features was equal to 1. The normalized data were exported to Excel for analysis. The data sets were filtered to remove those genes that were not expressed at levels significantly above background under either condition (sum of mean fluorescence intensity, <100). Mean signal intensities were determined for triplicate microarray experiments with two spots per slide (6 values). We filtered out those genes where the standard deviation of the signal intensity was greater than the mean value.
Hierarchical clustering analysis.
Hierarchical clustering was performed using the software program Cluster 3.0 (11) from transcriptome data sets derived from this work. After hierarchical clustering, the output was visualized using the TreeView program (12). Studies were carried out using those genes that were at least 1.25-fold repressed in the fur mutant (relative to the WT) and also at least 2-fold induced in any one of the four strains altered in components of the iron-sparing response. Genes considered in the analysis must have an unfiltered fold change calculation for three of the four microarray experiments. Genes where expression levels have been previously observed to be strongly affected by the growth rate (encoding ribosomal proteins, rRNA, and purine and pyrimidine synthesis enzymes) were excluded from the analysis.
Bioinformatic analysis of FsrA pairing with putative targets.
Predicted targets of the iron-sparing response from reference 15 or from the transcriptome analysis described in this study were selected for pairing analysis. Secondary structure models were predicted by joining a region encompassing the translation initiation region (TIR) (from ∼−60 to +10 nucleotides [nt] from the start of translation) of each mRNA to the FsrA sequence via a short linker (10 CA repeats). Secondary structures predicted using the mFold software program (50) were examined for extended pairing between the TIR and FsrA. If pairing was observed, the interaction was extended and refined using the program RNAhybrid (34).
Northern blot experiments.
B. subtilis wild-type strain CU1065 and fur, fur fsrA, and fur fbpABC cells were grown in Belitsky minimal medium (40), and samples were harvested for RNA isolation at OD500s of 0.4, 1.0, and 2.0, corresponding to the exponential growth phase, transition phase, and stationary phase, respectively. RNA isolation and Northern blot analyses were performed as described previously (44). Hybridizations specific for sdhA, citB, and lutB were performed with the digoxigenin-labeled RNA probes synthesized in vitro using T7 RNA polymerase from the T7 promoter containing internal PCR products of the respective genes using the following primer pairs: CATCAAACCCATACGTGCTG (citB-for), CTAATACGACTCACTATAGGGAGATACGTCGTAAATCCGCCTTC (citB-T7-rev), CGGGAATCATCTTTGGAAAA (sdhA-for), CTAATACGACTCACTATAGGGAGAAGCGCTCCATTAACTCCTGA (sdhA-T7-rev), GAAGGAAGGCTGTGAAGTCG (lutB-for), and CTAATACGACTCACTATAGGGAGACCAAGTCCGAATGCTTTCAT (lutB-T7-rev).
Analytical techniques and sample preparation.
Maximum specific growth rate, biomass yield on glucose, specific glucose consumption, and by-product formation rates were determined by regression analysis during the exponential growth phase in batch cultures. Glucose and acetate concentrations were determined from culture supernatants along the growth curve on an HPLC HP1100 system (Agilent Technologies, Santa Clara, CA). Detection was performed using a refractive index for glucose and a UV detector at 240 nm for acetate. Cellular dry weights were calculated from the OD600 values multiplied by a conversion factor that was previously determined.
Metabolic flux analysis.
To assess 13C patterns in proteinogenic amino acids, cell pellets from 5 ml of culture aliquots were harvested during growth at an OD600 of 1, hydrolyzed in 6 M HCl, and derivatized with N-(ter-butyldimethylsilyl)-methyltrifluoroacetamide as described elsewhere (48). Derivatized amino acids were analyzed for 13C-labeling patterns with a series 8000 gas-chromatograph (GC) combined with an MD800 mass spectrometer (MS) (Fisons Instruments). The GC-MS-derived mass isotope distributions of proteinogenic amino acids were then corrected for naturally occurring isotopes. Flux ratio analysis and subsequent 13C-constrained net flux analysis were conducted by using the software package FiatFlux (48, 49). Ratios of converging fluxes were directly calculated from 13C patterns and then used together with measured physiological rates as constraints to estimate the flux distribution from the stoichiometric matrix. Fluxes into biomass were calculated from the known metabolite requirements for macromolecular compounds and the growth rate-dependent RNA and protein contents (13). Using the FiatFlux software program (49), the sum of the weighted square residuals of the constraints from both metabolite balances and flux ratios was minimized using the MATLAB function, and the residuals were weighted by dividing through the experimental error (48). The computation was repeated at least five times with randomly chosen initial flux distributions to ensure identification of the global minimum. Two independent experiments have been analyzed.
Growth curve generation and comparison.
Fresh single colonies were picked from selective LB plates and cultivated statically at 30°C overnight in 5 ml MM. They were then shifted to 37°C with shaking and grown to mid-exponential phase (OD600 of ∼0.4; Spectronic 21). Cells were recovered from 1 ml of each culture, washed in 0.75 ml 0.88% NaCl, and then resuspended and diluted to a standard OD600 of 0.1 (Perkin Elmer) in 0.88% NaCl. Thirty microliters of cells were inoculated into 170 μl of either fumarate MM or succinate MM in a 100-well microtiter plate, and growth was monitored with shaking at 37°C using a BioScreen C plate reader.
Western blot analysis.
Strains for Western blot analysis were grown overnight in 1 ml LB broth plus MLS (when appropriate) at 37°C shaking. A 0.5-ml overnight culture was inoculated into 50 ml LB broth, grown to an OD600 of ∼0.4, and spun down at 5,000 rpm for 5 min in an Eppendorf 5804R swinging bucket rotor centrifuge. The pellet was resuspended in 1 ml of MM supplemented with 0.2 mM KPO4 (pH 7.0), 40 mM MnCl2, and 1 mM FeSO4 (MMa) and centrifuged for 2 min at 5,900 × g. The pellet was then resuspended in 1 ml of MMb (1× Bacillus salts [5], 40 mM MOPS [pH 7.4], and 2% [wt/vol] glucose) and centrifuged for 2 min at 5,900× g. The pellet was then resuspended in 1 ml of MMa with the addition of 20% sucrose and 1 mg/ml lysozyme and incubated with shaking at 37°C for 40 min. Formation of protoplasts was verified by microscopy, and the protoplasts were centrifuged for 4 min at 4,600× g at 4°C. The protoplasts were resuspended in 200 μl TBS (50 mM Tris-HCl [pH 7.4], 150 mM NaCl, 1 mM EDTA, 1 mM dithiothreitol [DTT], and 0.1 mM phenylmethylsulfonyl fluoride [PMSF]), briefly sonicated, and then ultracentrifuged at 45,000 rpm for 30 min (TLA 100.3 fixed-angle rotor for a Beckman TL-100 ultracentrifuge) to separate the membrane and cytoplasmic fractions. The membrane fraction was resuspended in 200 μl TBS. A Bradford assay was carried out with the membrane fraction to determine total recovered protein, and 10 μg of total protein was used for SDS-PAGE. Protein levels were determined after membrane transfer and Western blot analysis using commercially obtained anti-FLAG primary antibodies (Sigma).
Microarray data accession number.
All original raw data files were deposited into the GEO database as series GSE27416.
RESULTS AND DISCUSSION
Scope of FsrA-dependent iron-sparing response as monitored at the transcriptome level.
Under conditions of iron sufficiency, the fsrA, fbpAB, and fbpC operons are repressed and their products are inactive. We therefore used a fur mutant strain, in which these genes are constitutively expressed (2), as the starting point for our analysis. This strain is said to express an iron-sparing response in which multiple iron-dependent proteins are repressed (15). In most cases tested previously, this translational repression was accompanied by a decrease in steady-state mRNA levels (15). We therefore focused out attention on those genes with reduced mRNA levels in the fur mutant as visualized by transcriptomics (Fig. 1, fur/wt). Since the level of decrease in steady-state mRNA levels is often quite small, we selected all genes with mRNA levels reduced by at least 1.25-fold in a fur mutant (corresponding to less than 3% of coding regions). The resulting set of genes included most of those previously identified as targets of the iron-sparing response (15).
Fig 1.

Hierarchical cluster analysis of transcriptional changes in iron-sparing response mutant strains. A hierarchical cluster analysis (generated using Treeview) represents genes that are at least 1.25-fold repressed in the fur-versus-WT microarray experiment and induced at least 2.0-fold under at least one of the following conditions: fur versus fur fsrA, fur versus fur fbpAB, fur versus fur fbpC, or fur versus fur fbpABC. Clusters with similar regulatory patterns are indicated by brackets and represent genes mostly affected by FsrA (R), FbpC (C), FsrA and FbpAB (RAB), and FsrA and FbpABC (RABC). Red intensity indicates increasing expression, while green intensity indicates decreased expression. Black indicates no change or no data for the gene/array indicated. Genes are listed to the right of the cluster, and the corresponding regulators (where known) are indicated to the right of each gene.
To determine whether this observed downregulation involved any of the fsrA, fbpAB, or fbpC operons, we compared the transcriptome of a fur mutant with strains additionally inactivated for one or more components of the iron-sparing response. Of the 116 genes with at least a 1.25-fold reduction in mRNA levels, 78 displayed an increase in mRNA in a strain additionally lacking one or more of the effectors of the iron-sparing response. Cluster analysis of those genes that were at least 2.0-fold upregulated (relative to levels for the fur mutant) in any one of four genetic backgrounds tested allowed us to define clusters of coordinately regulated genes. These gene sets define mRNA targets whose levels are affected primarily by the Fur-regulated FsrA small RNA (cluster R), FbpAB (cluster AB), or FbpC (cluster C). For other genes, the greatest increases in mRNA levels were observed in response to mutations in either FsrA or one or more of the presumed coregulators. These clusters include FsrA/FbpAB-coregulated genes (cluster RAB) and FsrA/FbpC-coregulated genes (cluster RC) (Fig. 1).
In general, FsrA is postulated to function as an antisense RNA to preclude translation of those target genes where it has significant complementarity in the translation initiation region (TIR). The roles of the FbpA, -B, and -C proteins are less clear. Some or all may work as RNA chaperones to increase the efficacy of FsrA action, they may work in conjunction with other yet-to-be-identified sRNAs, or they may work as part of protein-based translational repression or RNA destabilization pathways.
Consistent with our previous findings for the sdh operon (15), mutation of fsrA leads to significant upregulation, and the effects of FsrA on expression are largely independent of FbpABC (cluster R). The leuC gene and pdh operon also belong to cluster R. SdhCBA and PdhABCD both play a role in carbon metabolism, and their activities are expected to be correlated with the activity of the TCA cycle. We note that leuC is the penultimate gene of the ilv-leu operon, and the LeuC protein was previously found to be strongly repressed in an FsrA-dependent manner by proteomics studies (15). This operon is also subject to complex RNA processing of the primary transcript (27). Some genes of the ilv-leu operon had low RNA levels under the growth conditions used for the transcriptome analysis and were removed during data filtering.
Most of the other genes upregulated in the fur fsrA mutant (compared to fur alone) appeared to also be (variably) upregulated in the fur fbpAB and/or fur fbpC mutants (including clusters RAB and RC, as well as some genes in clusters AB and C). This may mean that the effect of FsrA on these targets is stimulated by or requires one or more of these basic proteins as coregulators. For most operons that appear to be repressed in the fur mutant strain in a process involving FsrA and/or FbpABC, neither the mechanism nor the physiological relevance of the noted regulation is yet established. We have shown previously that the FsrA sRNA is complementary to, and anneals with, the leader region of the sdh operon (15). We further show, in the accompanying article, that translational repression of the lutABC operon by FsrA requires FbpB in cells with wild-type levels of FsrA but not when FsrA is overexpressed by 2- to 3-fold (38). These results are consistent with a role for FbpB in augmenting the action of FsrA, at least for this one target.
The transcriptome analysis reveals a significant number of additional genes where the mRNA level is affected primarily by FbpAB (cluster AB), FbpC (cluster C), or all three coregulators in a manner largely independent of FsrA. For example, cluster C includes the eps operon, encoding functions for extracellular polysaccharide biosynthesis, and the qcrABC operon, responsible for the production of the Fe-S-containing quinone-cytochrome c reductase. For cluster C genes, the effects of FbpC are greater than those of FsrA, which is inconsistent with FbpC acting through FsrA and suggests that FbpC (either as a transcript or as the peptide product) has additional, FsrA-independent regulatory activity. Similarly, the lutABC operon is in the AB cluster, which reflects the fact that the levels of the corresponding RNA are affected most strongly by FbpB, as described in the accompanying article (38). In general, there is an imperfect correlation between changes noted at the RNA level (e.g., Fig. 1) and at the protein level (15). This may indicate that translational repression by annealing of FsrA to its mRNA targets has variable effects on mRNA stability. Presumably, the subset of mRNAs where FsrA (or other effectors of the iron-sparing response) leads to destabilization are most easily detected at the transcriptome level. The mechanisms of coupling between sRNA and subsequent effects on RNA degradation are not yet well defined for B. subtilis (1). For E. coli, however, annealing of the sRNAs to target transcripts leads to an Hfq-dependent recruitment of an RNA degradosome that cleaves the mRNA at sites distal to the RNA pairing interaction (22, 32).
As expected, many of the mRNAs that are present at a lower level in response to FsrA, FbpAB, and/or FbpC encode known or likely metalloproteins. Examples include the metalloprotein Map (methionine aminopeptidase) and the iron-containing enzyme CydAB (a 3-heme-containing cytochrome bd) (23). It has been hypothesized that Map and its paralog, YflG, both function as methionine aminopeptidases, each requiring a different metal cofactor (46). The regulation of map as part of the iron-sparing response, as well as studies demonstrating activity for Fe(II)-metallated Map orthologs (45, 47), suggests that the Map cofactor may be iron. In general, many of the proteins targeted by the iron-sparing response encode relatively abundant, iron-containing enzymes, as also noted based on our previous proteome analyses (15).
To confirm the results observed in the transcriptome studies, we performed Northern blot analysis of three operons (Fig. 2). We included the sdhCAB operon, since the corresponding leader region was shown previously to anneal with FsrA (15). We also monitored the aconitase (citB) mRNA, since previous results suggested that this gene was a target for the iron-sparing response (15), but this was not apparent in the DNA microarray-based analysis (this gene signal was not reliably detected with these microarrays). Third, we included the lutABC transcript, which is also a target of FsrA-mediated regulation, as shown by monitoring, at the RNA and protein level, a lutA-FLAG fusion allele (38). In each case tested, the level of mRNA was reduced significantly in the fur mutant strain, and this reduction was in each case dependent on FsrA: mRNA levels returned to near-wild-type levels in the fur fsrA double mutant. The lutABC operon also returned to near-wild-type levels in a strain containing FsrA but lacking the FbpA, -B, and -C proteins. A lesser dependence on the Fbp proteins was also noted for the sdhCAB transcript. These results again highlight the combinatorial complexity originally noted in our proteome data (15).
Fig 2.

Northern analysis of selected FsrA regulon members. Equal amounts of total RNA isolated from wild-type and fur, fur fsrA, and fur fbpABC mutant strains were hybridized with antisense RNA probes specific for sdhA, citB, and lutC, as indicated. Cells were grown in Belitsky minimal medium and harvested at OD500s of 0.4, 1.0, and 2.0, corresponding to the log phase (lane 1), transition phase (lane 2), and stationary phase (lane 3). The arrows point to the expected sizes of the specific transcripts.
Bioinfomatic analysis supports a direct role for FsrA at many targets.
We anticipated that some of the effects noted at the transcriptional level were likely due to the direct action of FsrA as an antisense RNA, with other effects being secondary in nature. In most bacterial systems, small trans-acting RNAs function by annealing at or near the TIR (26). Subsequent to hybrid formation, the duplex RNA can be targeted for degradation, which can account for the observed reduction in steady-state mRNA levels (26). Moreover, mRNAs that are not actively translated often have a shorter half-life than those that are being translated (7).
In an initial attempt to understand the mechanism behind the regulation by fsrA, we sought to determine if FsrA was complementary to the TIR of various mRNA targets. Using both mFold and RNAhybrid, pairings were predicted that could account for the translational repression of several targets (Fig. 3). It is interesting to note that all of the pairings presented here involve a C-rich unstructured loop region of FsrA (15) and regions overlapping the RBS of the target operon. This suggests that FsrA may nucleate interaction with its targets via this open loop structure. Similar C-rich motifs have been found in S. aureus sRNAs and are predicted to act in a similar manner (16).
Fig 3.

Predicted RNA pairings for FsrA and selected FsrA regulon members. (A) Secondary structure of FsrA, including the terminator hairpin (T). A region including the second of two tetracytidine repeats is underlined. (B) Predicted RNA-RNA hybrids between FsrA (3′ to 5′; with the CCCCUCU sequence in bold and underlined for indexing) and the TIR of the indicated target mRNA (5′ to 3′).
FsrA regulates the expression of glutamate synthase by RNA-RNA hybrid formation.
To test the pairing predictions, we focused on the gltAB operon leader region. The levels of the gltAB mRNA were found previously to be reduced ∼2- to 3-fold in a fur mutant or in response to iron deprivation (2).
To determine if glutamate synthase (GltAB) is regulated as part of the iron-sparing response, we first monitored the abilities of the wild type and the fur, fur fsrA, fur fbpAB, fur fbpC, and fur fbpAB fbpC mutants to grow in the presence of different nitrogen sources. Consistent with a deficiency of GltAB activity, the fur mutant was unable to grow in glucose minimal medium with ammonium as the sole nitrogen source (Fig. 4A). Growth was restored by addition of glutamate, glutamine, or Casamino Acids but not by α-ketoglutarate (data not shown), as shown previously for a gltAB mutant (3). The growth defect of the fur mutant with ammonium as a nitrogen source was suppressed by an fsrA mutation (Fig. 4A) but not by the mutation of fbpAB, fbpC, or fbpABC (data not shown).
Fig 4.

FsrA interacts directly with the gltAB leader region. Growth of the indicated strains was monitored in MM with ammonia as a sole nitrogen source. Cells were inoculated from overnight cultures into MM without glutamate, and the OD600s were recorded using the Bioscreen C MBR system for 24 h. The wild type and the fur and fur fsrA mutants are shown in all panels. The fur fsrA mutant was complemented with a WT copy at the thrC locus as shown in panel A. Mutants in the gltAB leader region (designated 1, 2, and 3, as in Fig. 3) and the corresponding compensatory changes in FsrA (to restore the predicted pairing) are shown in panels A, B, and C, respectively.
RNA pairing analysis identified several regions of complementarity between FsrA and the gltAB leader region. We targeted three of these regions for analysis (Fig. 3B), while avoiding the regions comprising the gltAB ribosome-binding site and its complement in FsrA. For two of the leader region mutations (gltA2 and gltA3), the mutations appeared to reduce or prevent FsrA-mediated repression and the cells grew on ammonium as a nitrogen source. As predicted by the RNA-RNA pairing model, introduction of compensatory mutations into FsrA restored the repression of gltAB, as evidenced by a failure to grow on ammonium (Fig. 4B and C). In contrast, mutation gltA1 in the gltAB leader appeared to reduce GltAB function (as reflected in the decreased growth rate on ammonium), but this growth defect was independent of FsrA, and restoring the complementarity by mutation of FsrA did not have a dramatic effect on growth, at least in the early stages. Downregulation of glutamate synthase in response to iron deprivation has been previously found in the yeast Saccharomyces cerevisiae (37), likely as part of the iron-sparing response orchestrated by the RNA binding Cth1 and Cth2 proteins (31).
Different regions of FsrA regulate the sdhCAB and gltAB operons.
Expression of both sdhCAB and gltAB is repressed by FsrA (15; this work). RNA hybrid predictions (Fig. 3) suggest that largely distinct regions of FsrA interact with the sdhC (15) and gltAB leader sequences. The RNA hybrid analysis predicts that the FsrA mutations that suppress gltA2 should not affect the ability of FsrA to repress the sdhCAB operon. We therefore monitored the abilities of wild-type and mutant FsrA alleles to prevent growth on succinate as a carbon source. As expected, the wild type grew normally on succinate (OD600 = 2.6 ± 0.16), whereas the fur mutant was unable to grow (OD600 = 0.2 ± 0.1). The fur fsrA mutant grew as well as the wild type. An inability to grow on succinate was restored by provision of either wild-type fsrA or a mutated copy (complementary to gltA2). We conclude that distinct regions of FsrA interact with the sdhCAB and gltAB leader regions.
FsrA decreases flux through the TCA cycle.
The repression of the Sdh complex by FsrA, together with the downregulation noted for aconitase (CitB) (Fig. 2) and pyruvate dehydrogenase (Pdh), suggests that the iron-sparing response may significantly perturb carbon metabolism and specifically the TCA cycle. This is consistent with prior results demonstrating that a fur mutant strain has reduced flux through the TCA cycle (14).
We performed a 13C-based flux analysis (36) to determine if the reduced TCA cycle activity is due to FsrA and/or FbpABC. For this purpose, 13C-labeling experiments with exponentially growing cultures were carried out in medium containing 80% natural abundance glucose and 20% [U-13C]glucose and, in another series, with 100% [1-13C]glucose. From each culture, proteins were isolated and the 13C distribution in proteinogenic amino acids was determined by mass spectrometry as described previously (48). Fluxes from two independent experiments were obtained by 13C-constrained flux analysis using the software program FiatFlux (49). This analysis relies on the fact that the precise pattern of labeling in amino acids reports on the relative activities of various metabolic pathways, which, in turn, can be fit to a flux model based on the known metabolic pathways for a given organism. The complete net flux distribution for the wild-type strain and its isogenic mutants is given in Fig. S1 in the supplemental material, and selected fluxes are shown in Fig. 5.
Fig 5.
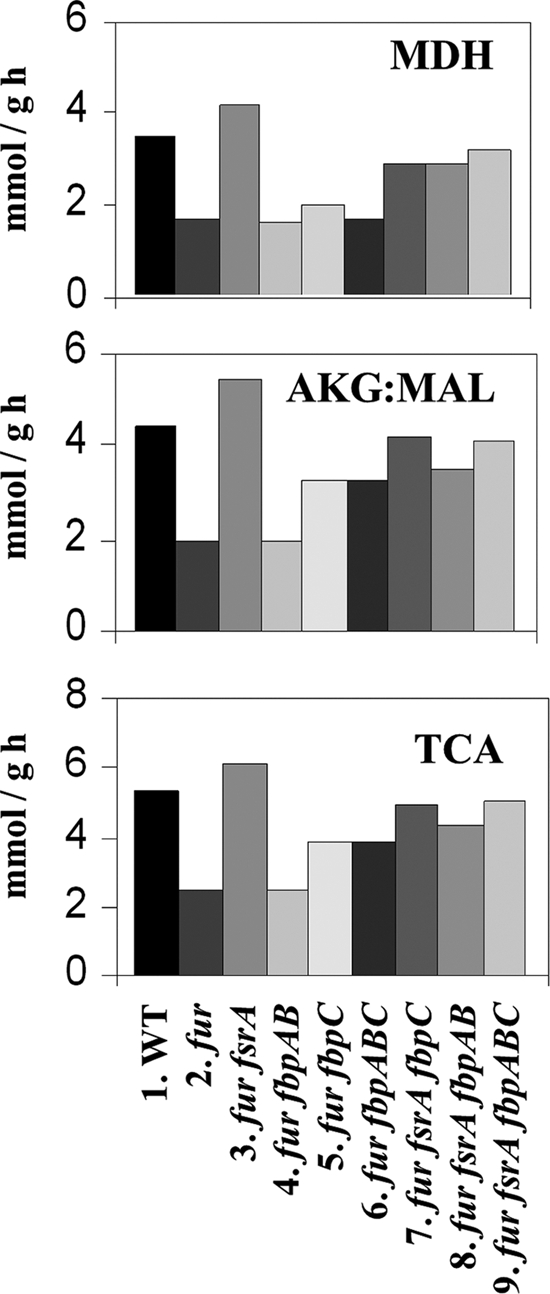
Absolute metabolic fluxes in B. subtilis mutants during exponential growth in glucose batch culture. Selected fluxes are given for the enzymes that catalyze the indicated reactions: MDH, flux measured from malate to oxaloacetate; AKG:MAL, flux measured from α-ketoglutarate to malate; and TCA, flux through the TCA cycle. Strains tested for flux analysis are described below the graph. One of two replicate experiments is shown. Generally, the 95% confidence intervals were between 10 and 15% of the values shown for the major fluxes. Larger confidence intervals were estimated for reactions with low fluxes. The complete solution for the flux analyses in two replicate experiments is shown in the supplemental material.
The most apparent perturbations in the flux analysis are due to the fur mutation (relative to the WT) and are best observed in glycolysis and the TCA cycle (Fig. 5; see also Fig. S1 in the supplemental material). The fur fsrA mutant but not the fur fbpAB or fur fbpC mutant generally reverts the fur flux phenotype to wild-type levels, and this is most notable for the TCA cycle-related fluxes (Fig. 5). Even the fbpABC triple mutation was less effective than the fsrA single mutation in restoring the fluxes of the fur mutant to their wild-type pattern. In contrast, fluxes through the pentose phosphate pathway remained at a relatively constant level (see Fig. S1 in the supplemental material). These results suggest that FsrA is the major regulator of flux through the TCA cycle during conditions of iron deprivation.
Consistent with previous data (14) and with the altered fluxes through the TCA cycle, the fur mutation roughly halves the growth rate on glucose as the sole carbon source (Table 2). Mutating fsrA in the fur mutant background partially restores the growth phenotype, but a full restoration of rapid growth is achieved only for those fur fsrA mutants that are additionally lacking either FbpAB, FbpC, or all three (Table 2). These results provide evidence that FbpAB and FbpC have physiological functions independent of FsrA. This further indicates that optimal growth requires the restoration of expression of both TCA cycle enzymes (repressed by FsrA) and other pathways (repressed by FbpABC-mediated pathways).
Table 2.
Physiological parameters of B. subtilis growth on citrate-supplemented M9 mediuma
| Genotype | Growth rate (μ) | Biomass yield, g (g glucose)−1 | Glucose uptake (mmol g−1 h−1) | Acetate secretion |
|---|---|---|---|---|
| WT | 0.64 ± 0.01 | 0.42 ± 0.09 | 9.7 ± 2 | 3.8 ± 0.65 |
| fur | 0.36 ± 0.02 | 0.35 ± 0.05 | 7.0 ± 1.3 | 3.0 ± 0.5 |
| fur fsrA | 0.50 ± 0.007 | 0.36 ± 0.02 | 7.8 ± 0.5 | 2.0 ± 0.2 |
| fur fbpC | 0.44 ± 0.002 | 0.32 ± 0.02 | 6.1 ± 0.3 | 3.8 ± 0.8 |
| fur fbpAB | 0.42 ± 0.04 | 0.40 ± 0.05 | 6.4 ± 1.2 | 2.7 ± 1 |
| fur fbpABC | 0.41 ± 0.01 | 0.36 ± 0.01 | 8.4 ± 2 | 4.3 ± 1.5 |
| fur fsrA fbpC | 0.61 ± 0.03 | 0.51 ± 0.04 | 7.4 ± 1.8 | 3.2 ± 0.8 |
| fur fsrA fbpAB | 0.65 ± 0.04 | 0.50 ± 0.04 | 7.8 ± 0.9 | 2.9 ± 0.09 |
| fur fsrA fbpABC | 0.64 ± 0.03 | 0.43 ± 0.07 | 8.3 ± 1.6 | 2.5 ± 0.6 |
Values are means ± SD.
Role of DctP in C4-dicarboxylate uptake and utilization.
Downregulation of Sdh can explain our previous observation that a fur mutant strain grows very poorly on minimal medium with succinate as the carbon source. However, we have also observed that a fur mutant is severely impaired in growth on fumarate (15), which is the product of the Sdh reaction. A hint of a possible mechanism is provided from earlier transcriptome studies which indicated that a C4-dicarboxylate permease (DctP) is strongly downregulated in a fur mutant (2). We therefore hypothesized that the inability to grow on succinate or fumarate might be due to repression of DctP rather than (or in addition to) Sdh.
To monitor the effects of fur and the iron-sparing response on DctP levels, Western blot analysis was used with strains expressing a DctP-FLAG protein. A marked reduction in the level of DctP-FLAG was observed in the membrane fractions of the fur mutant compared to that for the WT (Fig. 6). Protein levels increased with the additional mutation of fsrA (Fig. 6) but not in fbpAB or fbpC mutant strains (data not shown). This indicates that dctP (which was removed during filtering of our microarray data) is likely a member of Cluster R (as is the sdh operon) and is regulated primarily by FsrA. Consistent with this hypothesis, the inability of a fur mutant to grow on succinate or fumarate can be rescued in a fur fsrA double mutant strain but not by a fur fbpAB or fur fbpC double mutant strain (Fig. 7 and data not shown).
Fig 6.

Western analysis of DctP-FLAG. Western blot analysis was used to monitor the expression of DctP-FLAG in various mutant backgrounds. Ten micrograms total protein from membrane fractions was loaded per lane. Each lane is labeled with the strain background, and a wild-type strain carrying no FLAG construct was included as a negative control. The first lane is the molecular mass marker (in kDa). Development was carried out with anti-FLAG primary antibody and alkaline phosphatase-linked secondary anti-rabbit antibody.
Fig 7.

Growth phenotypes of selected mutant strains. (A) Growth curves of mutant strains affected in the iron-sparing response in succinate MM. The strains used in this experiment are as follows: WT (open diamond), fur mutant (cross), fur fsrA mutant (open triangle), and fur fsrA +fsrA strain (HB12573, filled triangle). (B) Growth curves of mutant strains affected in the iron-sparing response in fumarate MM. Strain designations are as in panel A. (C and D) Comparison of growth in succinate MM (C) or fumarate MM (D). Column labels indicate amounts of IPTG added. Columns represent final OD600s after 24 h of growth at 37°C. The strains used in this experiment are as follows: WT +Pspac-dctP-FLAG (HB12551, white) and fur +Pspac-dctP-FLAG (HB12558, gray). All growth data presented here are the averages and standard deviations for three biological replicates.
To directly test if regulation of DctP was responsible for these growth effects, we generated an isopropyl-β-d-thiogalactopyranoside (IPTG)-inducible dctP-FLAG construct and integrated it ectopically in WT and fur mutant strains. Growth of both strains was measured after 24 h in both succinate MM and fumarate MM with and without the addition of 1.0 mM IPTG. Induction of dctP-FLAG led to significant restoration of growth in fumarate MM but not in succinate MM (Fig. 7C). This suggests that repression of DctP is at least in part limiting for growth on fumarate. Conversely, induction of DctP is not sufficient to overcome the growth restriction on succinate, presumably because FsrA additionally represses SdhCBA translation.
Concluding remarks.
Transcriptome analysis of the fur mutant strain compared to the wild type reveals derepression of those genes repressed by Fur (including many operons encoding iron uptake functions) and downregulation of numerous other operons, consistent with findings of prior studies (2). The discovery of the iron-sparing response, mediated by FsrA and/or FbpABC, provides a mechanistic explanation for much of this downregulation: mRNAs that are targeted by the FsrA sRNA for translational repression are presumably degraded more rapidly, which thereby reduces the steady-state mRNA level.
The genes targeted by the iron-sparing response include those encoding aconitase (citB), glutamate synthase (gltAB), succinate dehydrogenase (sdhCAB), and C4-dicarboxylate permease (dctP), which all may affect fluxes through the TCA cycle (Fig. 8). The results presented here confirm that these effects, as observed in transcriptomics and noted previously in proteomics studies (15), are indeed responsible for a substantially reduced flux through the TCA cycle. The repression of TCA cycle enzymes is physiologically significant: the fur mutant has a reduced growth rate and yield on glucose and is unable to grow on either succinate or fumarate as a carbon source. The inability to grow on fumarate may result at least in part from downregulation of the DctP dicarboxylate permease. Our results further highlight the complex nature of the B. subtilis iron-sparing response, which, though largely dependent on the FsrA sRNA, additionally involves the poorly characterized FbpABC proteins. These coregulators may function at some targets as part of a common pathway with FsrA, possibly by acting as RNA chaperones or in recruitment of the RNA degradation machinery. In other cases, FbpABC have effects independent of FsrA and may act directly as RNA-binding proteins or in conjunction with yet-to-be-identified sRNA partners.
Fig 8.

A simplified metabolic model highlighting key points of Fur regulation. Under iron-deficient conditions, the Fur-regulated fsrA, fbpAB, and fbpC genes are derepressed. FsrA is a primary effector in mediating the translational repression of two TCA cycle enzymes, aconitase (CitB) and succinate dehydrogenase (SdhCAB). FsrA additionally represses expression of glutamate synthase (GltAB), which synthesizes glutamate from glutamine and the TCA cycle intermediate α-ketoglutarate, and DctP, a component of the dicarboxylate permease which imports succinate and fumarate. FsrA together with FbpB also represses synthesis of the LutABC lactate oxidase enzymes, which allow the use of lactate as an energy and carbon source.
Supplementary Material
ACKNOWLEDGMENTS
This work was supported by a grant from the National Institutes of Health (GM059323 to J.D.H.) and by a grant from the Deutsche Forschungsgemeinschaft (AN746/2-1 to H.A.). G.T.S. was partially supported by the NIH Predoctoral Training in Cellular and Molecular Biology grant GM007273.
Footnotes
Published ahead of print 2 March 2012
Supplemental material for this article may be found at http://jb.asm.org/.
REFERENCES
- 1. Anderson KL, Dunman PM. 2009. Messenger RNA turnover processes in Escherichia coli, Bacillus subtilis, and emerging studies in Staphylococcus aureus. Int. J. Microbiol. 2009:525491. [DOI] [PMC free article] [PubMed] [Google Scholar]
- 2. Baichoo N, Wang T, Ye R, Helmann JD. 2002. Global analysis of the Bacillus subtilis Fur regulon and the iron starvation stimulon. Mol. Microbiol. 45:1613–1629 [DOI] [PubMed] [Google Scholar]
- 3. Bohannon DE, Rosenkrantz MS, Sonenshein AL. 1985. Regulation of Bacillus subtilis glutamate synthase genes by the nitrogen source. J. Bacteriol. 163:957–964 [DOI] [PMC free article] [PubMed] [Google Scholar]
- 4. Brush A, Paulus H. 1971. The enzymic formation of O-acetylhomoserine in Bacillus subtilis and its regulation by methionine and S-adenosylmethionine. Biochem. Biophys. Res. Commun. 45:735–741 [DOI] [PubMed] [Google Scholar]
- 5. Bsat N, Chen L, Helmann JD. 1996. Mutation of the Bacillus subtilis alkyl hydroperoxide reductase (ahpCF) operon reveals compensatory interactions among hydrogen peroxide stress genes. J. Bacteriol. 178:6579–6586 [DOI] [PMC free article] [PubMed] [Google Scholar]
- 6. Butcher BG, Helmann JD. 2006. Identification of Bacillus subtilis σW-dependent genes that provide intrinsic resistance to antimicrobial compounds produced by bacilli. Mol. Microbiol. 60:765–782 [DOI] [PubMed] [Google Scholar]
- 7. Carrier TA, Keasling JD. 1997. Controlling messenger RNA stability in bacteria: strategies for engineering gene expression. Biotechnol. Prog. 13:699–708 [DOI] [PubMed] [Google Scholar]
- 8. Chen L, James LP, Helmann JD. 1993. Metalloregulation in Bacillus subtilis: isolation and characterization of two genes differentially repressed by metal ions. J. Bacteriol. 175:5428–5437 [DOI] [PMC free article] [PubMed] [Google Scholar]
- 9. Commichau FM, Gunka K, Landmann JJ, Stulke J. 2008. Glutamate metabolism in Bacillus subtilis: gene expression and enzyme activities evolved to avoid futile cycles and to allow rapid responses to perturbations of the system. J. Bacteriol. 190:3557–3564 [DOI] [PMC free article] [PubMed] [Google Scholar]
- 10. Cutting S, Vander Horn PB. 1990. Molecular biological methods for Bacillus. Wiley, Chichester, United Kingdom [Google Scholar]
- 11. de Hoon MJ, Imoto S, Nolan J, Miyano S. 2004. Open source clustering software. Bioinformatics 20:1453–1454 [DOI] [PubMed] [Google Scholar]
- 12. Eisen MB, Spellman PT, Brown PO, Botstein D. 1998. Cluster analysis and display of genome-wide expression patterns. Proc. Natl. Acad. Sci. U. S. A. 95:14863–14868 [DOI] [PMC free article] [PubMed] [Google Scholar]
- 13. Emmerling M, et al. 2002. Metabolic flux responses to pyruvate kinase knockout in Escherichia coli. J. Bacteriol. 184:152–164 [DOI] [PMC free article] [PubMed] [Google Scholar]
- 14. Fischer E, Sauer U. 2005. Large-scale in vivo flux analysis shows rigidity and suboptimal performance of Bacillus subtilis metabolism. Nat. Genet. 37:636–640 [DOI] [PubMed] [Google Scholar]
- 15. Gaballa A, et al. 2008. The Bacillus subtilis iron-sparing response is mediated by a Fur-regulated small RNA and three small, basic proteins. Proc. Natl. Acad. Sci. U. S. A. 105:11927–11932 [DOI] [PMC free article] [PubMed] [Google Scholar]
- 16. Geissmann T, et al. 2009. A search for small noncoding RNAs in Staphylococcus aureus reveals a conserved sequence motif for regulation. Nucleic Acids Res. 37:7239–7257 [DOI] [PMC free article] [PubMed] [Google Scholar]
- 17. Guerout-Fleury AM, Frandsen N, Stragier P. 1996. Plasmids for ectopic integration in Bacillus subtilis. Gene 180:57–61 [DOI] [PubMed] [Google Scholar]
- 18. Hansson M, Rutberg L, Schroder I, Hederstedt L. 1991. The Bacillus subtilis hemAXCDBL gene cluster, which encodes enzymes of the biosynthetic pathway from glutamate to uroporphyrinogen III. J. Bacteriol. 173:2590–2599 [DOI] [PMC free article] [PubMed] [Google Scholar]
- 19. Harwood C, Archibald A. 1990. Molecular biological methods for Bacillus. John Wiley & Sons Ltd., Chichester, United Kingdom [Google Scholar]
- 20. Ho SN, Hunt HD, Horton RM, Pullen JK, Pease LR. 1989. Site-directed mutagenesis by overlap extension using the polymerase chain reaction. Gene 77:51–59 [DOI] [PubMed] [Google Scholar]
- 21. Iijima T, Diesterhaft MD, Freese E. 1977. Sodium effect of growth on aspartate and genetic analysis of a Bacillus subtilis mutant with high aspartase activity. J. Bacteriol. 129:1440–1447 [DOI] [PMC free article] [PubMed] [Google Scholar]
- 22. Ikeda Y, Yagi M, Morita T, Aiba H. 2011. Hfq binding at RhlB-recognition region of RNase E is crucial for the rapid degradation of target mRNAs mediated by sRNAs in Escherichia coli. Mol. Microbiol. 79:419–432 [DOI] [PubMed] [Google Scholar]
- 23. Juty NS, Moshiri F, Merrick M, Anthony C, Hill S. 1997. The Klebsiella pneumoniae cytochrome bd′ terminal oxidase complex and its role in microaerobic nitrogen fixation. Microbiology 143:2673–2683 [DOI] [PubMed] [Google Scholar]
- 24. Kearns DB, Chu F, Rudner R, Losick R. 2004. Genes governing swarming in Bacillus subtilis and evidence for a phase variation mechanism controlling surface motility. Mol. Microbiol. 52:357–369 [DOI] [PubMed] [Google Scholar]
- 25. Krom BP, Warner JB, Konings WN, Lolkema JS. 2000. Complementary metal ion specificity of the metal-citrate transporters CitM and CitH of Bacillus subtilis. J. Bacteriol. 182:6374–6381 [DOI] [PMC free article] [PubMed] [Google Scholar]
- 26. Liu JM, Camilli A. 2010. A broadening world of bacterial small RNAs. Curr. Opin. Microbiol. 13:18–23 [DOI] [PMC free article] [PubMed] [Google Scholar]
- 27. Mader U, Hennig S, Hecker M, Homuth G. 2004. Transcriptional organization and posttranscriptional regulation of the Bacillus subtilis branched-chain amino acid biosynthesis genes. J. Bacteriol. 186:2240–2252 [DOI] [PMC free article] [PubMed] [Google Scholar]
- 28. Masse E, Gottesman S. 2002. A small RNA regulates the expression of genes involved in iron metabolism in Escherichia coli. Proc. Natl. Acad. Sci. U. S. A. 99:4620–4625 [DOI] [PMC free article] [PubMed] [Google Scholar]
- 29. Moszer I, Glaser P, Danchin A. 1995. SubtiList: a relational database for the Bacillus subtilis genome. Microbiology 141:261–268 [DOI] [PubMed] [Google Scholar]
- 30. Ollinger J, Song KB, Antelmann H, Hecker M, Helmann JD. 2006. Role of the Fur regulon in iron transport in Bacillus subtilis. J. Bacteriol. 188:3664–3673 [DOI] [PMC free article] [PubMed] [Google Scholar]
- 31. Pedro-Segura E, et al. 2008. The Cth2 ARE-binding protein recruits the Dhh1 helicase to promote the decay of succinate dehydrogenase SDH4 mRNA in response to iron deficiency. J. Biol. Chem. 283:28527–28535 [DOI] [PMC free article] [PubMed] [Google Scholar]
- 32. Prevost K, Desnoyers G, Jacques JF, Lavoie F, Masse E. 2011. Small RNA-induced mRNA degradation achieved through both translation block and activated cleavage. Genes Dev. 25:385–396 [DOI] [PMC free article] [PubMed] [Google Scholar]
- 33. Quisel JD, Burkholder WF, Grossman AD. 2001. In vivo effects of sporulation kinases on mutant Spo0A proteins in Bacillus subtilis. J. Bacteriol. 183:6573–6578 [DOI] [PMC free article] [PubMed] [Google Scholar]
- 34. Rehmsmeier M, Steffen P, Hochsmann M, Giegerich R. 2004. Fast and effective prediction of microRNA/target duplexes. RNA 10:1507–1517 [DOI] [PMC free article] [PubMed] [Google Scholar]
- 35. Sambrook J, Fritsch EF, Maniatis T. 1989. Molecular cloning: a laboratory manual, 2nd ed. Cold Spring Harbor Laboratory, Cold Spring Harbor, NY [Google Scholar]
- 36. Sauer U. 2006. Metabolic networks in motion: 13C-based flux analysis. Mol. Syst. Biol. 2:62. [DOI] [PMC free article] [PubMed] [Google Scholar]
- 37. Shakoury-Elizeh M, et al. 2004. Transcriptional remodeling in response to iron deprivation in Saccharomyces cerevisiae. Mol. Biol. Cell 15:1233–1243 [DOI] [PMC free article] [PubMed] [Google Scholar]
- 38. Smaldone GT, Antelmann H, Gaballa A, Helmann JD. 2012. The FsrA sRNA and FbpB protein mediate the iron-dependent induction of the Bacillus subtilis LutABC iron-sulfur-containing oxidases. J. Bacteriol. 194:2586–2593. [DOI] [PMC free article] [PubMed] [Google Scholar]
- 39. Sonenshein AL. 2007. Control of key metabolic intersections in Bacillus subtilis. Nat. Rev. Microbiol. 5:917–927 [DOI] [PubMed] [Google Scholar]
- 40. Stulke J, Hanschke R, Hecker M. 1993. Temporal activation of beta-glucanase synthesis in Bacillus subtilis is mediated by the GTP pool. J. Gen. Microbiol. 139:2041–2045 [DOI] [PubMed] [Google Scholar]
- 41. Vagner V, Dervyn E, Ehrlich SD. 1998. A vector for systematic gene inactivation in Bacillus subtilis. Microbiology 144:3097–3104 [DOI] [PubMed] [Google Scholar]
- 42. Vander Horn PB, Zahler SA. 1992. Cloning and nucleotide sequence of the leucyl-tRNA synthetase gene of Bacillus subtilis. J. Bacteriol. 174:3928–3935 [DOI] [PMC free article] [PubMed] [Google Scholar]
- 43. Weinberger S, Gilvarg C. 1970. Bacterial distribution of the use of succinyl and acetyl blocking groups in diaminopimelic acid biosynthesis. J. Bacteriol. 101:323–324 [DOI] [PMC free article] [PubMed] [Google Scholar]
- 44. Wetzstein M, et al. 1992. Cloning, sequencing, and molecular analysis of the dnaK locus from Bacillus subtilis. J. Bacteriol. 174:3300–3310 [DOI] [PMC free article] [PubMed] [Google Scholar]
- 45. Ye QZ, Xie SX, Ma ZQ, Huang M, Hanzlik RP. 2006. Structural basis of catalysis by monometalated methionine aminopeptidase. Proc. Natl. Acad. Sci. U. S. A. 103:9470–9475 [DOI] [PMC free article] [PubMed] [Google Scholar]
- 46. You C, et al. 2005. The two authentic methionine aminopeptidase genes are differentially expressed in Bacillus subtilis. BMC Microbiol. 5:57. [DOI] [PMC free article] [PubMed] [Google Scholar]
- 47. Yuan H, Chai S, Lam C, Howard XH, Ye Q. 2011. Two methionine aminopeptidases from Acinetobacter baumannii are functional enzymes. Bioorg. Med. Chem. Lett. 21:3395–3398 [DOI] [PMC free article] [PubMed] [Google Scholar]
- 48. Zamboni N, Fendt SM, Ruhl M, Sauer U. 2009. 13C-based metabolic flux analysis. Nat. Protoc. 4:878–892 [DOI] [PubMed] [Google Scholar]
- 49. Zamboni N, Fischer E, Sauer U. 2005. FiatFlux—a software for metabolic flux analysis from 13C-glucose experiments. BMC Bioinformatics 6:209. [DOI] [PMC free article] [PubMed] [Google Scholar]
- 50. Zuker M. 2003. Mfold web server for nucleic acid folding and hybridization prediction. Nucleic Acids Res. 31:3406–3415 [DOI] [PMC free article] [PubMed] [Google Scholar]
Associated Data
This section collects any data citations, data availability statements, or supplementary materials included in this article.