Figure 5.
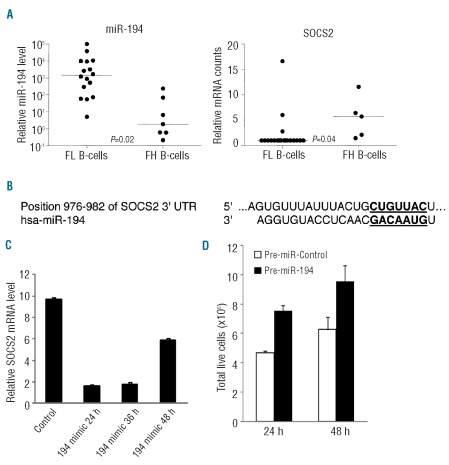
SOCS2 is regulated by miR-194 affecting tumor cell growth. (A), SOCS2 and miR-194 expression in patients’ FL tumor cells and control FH B cells. Relative signal intensity of miR-194 was obtained from a microRNA array and relative mRNA counts of SOCS2 were obtained from a NanoString nCounter assay. Lines indicate median values. P=0.02, 5.8-fold for miR-194; and P=0.04, 2.9-fold for SOCS2. FL, follicular lymphoma; FH, follicular hyperplasia. (B), The predicted conserved miR binding sites in 3′ untranslated (3′ UTR) of SOCS2 mRNA. The matched putative miRNA binding sequence in 3′ UTR of SOCS2 mRNA and miRNA seed sequence are in bold and underlined. (C) and (D), SOCS2 expression is regulated by miR-194 affecting tumor cell growth. OCI-Ly8 cells were transfected with miR-194 mimic oligonucleotides; the changes in SOCS2 mRNA level at 24, 36 and 48 h after transfection were determined by TaqMan quantitative real-time PCR assay. Mean and standard deviation of triplicate experiments are shown (C). Total live cells were counted 24 and 48 h after transfection using a Scepter hand-held automated cell counter and by trypan blue staining. Mean and standard deviation of triplicate counts are shown (D).

