

Abstract
Purpose. To investigate the effect of low tube voltage (80 kV) on image quality, radiation dose, and low-contrast detectability (LCD) at abdominal computed tomography (CT). Materials and Methods. A phantom containing low-contrast objects was scanned with a CT scanner at 80 and 120 kV, with tube current-time product settings at 150–650 mAs. The differences between image noise, contrast-to-noise ratio (CNR), and scores of LCD obtained with 80 kV at 150–650 mAs and those obtained with 120 kV at 300 mAs were compared respectively. Results. The image noise substantially increased with low tube voltage. However, with identical dose, use of 80 kV resulted in higher CNR compared with CNR at 120 kV. There were no statistically significant difference in CNR and scores of LCD between 120 kV at 300 mAs and 80 kV at 550–650 mAs (P > 0.05). The relative dose delivered at 80 kV ranged from 58% at 550 mAs to 68% at 650 mAs. Conclusion. With a reduction of the tube voltage from 120 kV to 80 kV at abdominal CT, the radiation dose can be reduced by 32% to 42% without degradation of CNR and LCD.
1. Introduction
There has been a remarkable increase in use of multidetector computed tomography (MDCT) since its introduction. MDCT has greater diagnostic capability and enables extended clinical applications, but it also has the potential to lead to an increase in radiation dose owing to the routine use of thinner sections, the extended volume of acquisition, and multiple-phase acquisitions. According to the literature, currently, CT represents about 7% of all radiologic examinations in the world but contributes more than 40% of the collective effective dose [1]. The theoretic risk to patients for radiation-indeed cancer from CT examination is not negligible [2–4].
In particular, the radiation dose from hepatic CT examinations has notably increased because multiple-phase dynamic-enhanced CT scan was routinely performed in patients who are suspected of having hepatic tumors. The estimated risk of cancer death for those undergoing CT is 12.5/10,000 population for each pass of the CT scan through the abdomen [5]. Therefore, concerns regarding a reduction in radiation dose have been recently raised during abdominal CT acquisitions.
Although decreasing tube current is the most means of reducing CT radiation dose [6–9], this alteration also reduces the contrast-to-noise ratio (CNR), which may affect the diagnostic outcome of the examination. This is especially true in abdominal studies, where low-contrast areas are severely affected by the CNR [10]. Some studies [11–15] suggest that scanning with low tube voltage is possible to reduce dose without markedly affecting image quality; however, there are few reports on the effect of low tube voltage on abdominal image quality and low-contrast detectability (LCD). Thus, the purpose of this study was to investigate the effect of low tube voltage with 80 kV on image noise (SD, standard deviation of CT number), CNR, radiation dose, and LCD at abdominal MDCT.
2. Materials and Methods
The institutional review board approved this study, and informed consent was obtained from all participating radiologists.
2.1. Description of Phantom
We used a phantom (Catphan 500; Phantom Laboratory, Cambridge, NY) with an additional annulus provided by the manufacturer to simulate the X-ray absorption of a standard abdomen (giving a total test object diameter of 30 cm). The phantom contains a CTP515 module, which consists of a 40 mm thick and 200 mm diameter slice of tissue equivalent background material containing a series of cylinders of various diameters to measure low-contrast performance. The cylinders varied in diameters from 2.0 to 15.0 mm and deviated from nominal contrast levels by 0.3%, 0.5%, and 1.0% (Figure 1). In our study, in order to avoid a partial volume effect, only the 15.0 mm diameter object with a contrast difference of 1.0% (having an attenuation difference with the background of 10 HU) was chosen to be analyzed. The phantom was always positioned at the isocenter of the gantry.
Figure 1.
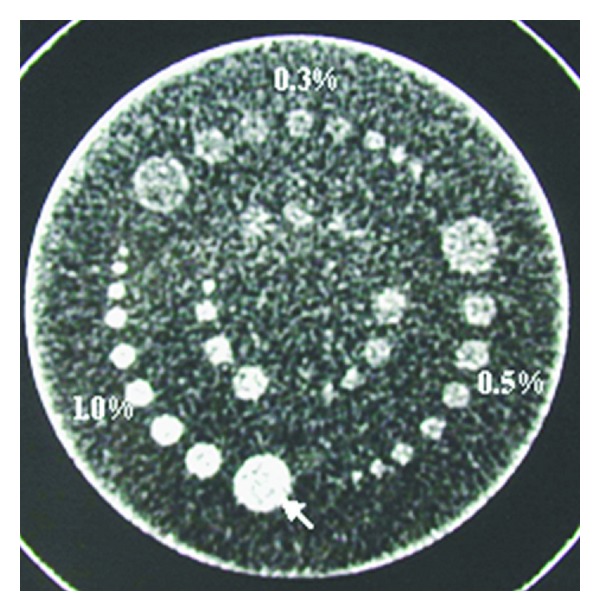
An axial CT image of the low-contrast module. It contains three groups of cylinders with various diameters from 2.0 to 15.0 mm. The nominal contrast levels of these groups are 0.3%, 0.5%, and 1.0%. In our study, only the 15.0 mm diameter object with a contrast difference of 1.0% (white arrow) was chosen to be analyzed.
2.2. CT Scanning
The phantom was scanned three times for each protocol with a 16-section MDCT scanner (LightSpeed; GE Medical Systems). The scanning parameters were configuration of 16 (detectors) ×1.5 mm (detector collimation), rotation time of 0.75 second, section thickness of 5.0 mm, section interval of 5.0 mm, pitch of 0.659, scan field of view of 50 cm, reconstruction algorithm (kernel) B30f (medium-sharp), and pixel matrix size of 512 × 512. Scanning was performed at the standard tube voltage of 120 kV and at the low tube voltage of 80 kV, with corresponding tube current-time product settings at 150, 200, 250, 300, 350, 400, 450, 500, 550, 600, and 650 mAs, respectively.
2.3. Measurement of Radiation Dose
We used the CT dose index volume (CTDIvol) based on the manufacturer's data for estimation of radiation dose. The corresponding CTDIvol of each acquisition conditions indicated on the monitor screen was recorded. The CTDIvol obtained at standard tube voltage protocol was compared with that obtained at low tube voltage protocol.
2.4. Measurement of CNR
For each scanning technique, we measured the CT number of the low-contrast object in 15 mm diameter and the background of the module. The region of interest used to perform the measurements was kept at 100 mm2. CNRs were calculated as follows: CNR = (ROIm − ROIb)/SDb, where ROIm and ROIb are the CT numbers of the low-contrast object in a 15 mm diameter region of interest and of the background region of interest, respectively, and SDb is the standard deviation of the attenuation values of the background [16]. A CNR was calculated on the three images of each set of acquisition parameters. The measurement was repeated three times on each image, giving nine measurements for each acquisition condition. From these nine measurements, a mean CNR was calculated for each set of acquisition conditions [17].
2.5. Assessment of LCD
For the subjective assessments of LCD, we evaluated the images obtained at 120 kV and 300 mAs and the images obtained at 80 kV and 150–650 mAs. Two experienced observers who were blind to each set of scanning parameters were asked to review independently the images. The visualization of each object was graded on a 3-point scoring scale by each observer: a score of 3.0 was obtained when the object was clearly visible and appeared as a perfect circle, a score of 2.0 was obtained when the object was not clearly visible, and a score of 1.0 was obtained when the object could not be detected. A total of 36 images (twelve sets of three images each) were respectively assessed by each observer. The final score of LCD of each acquisition sets was calculated by averaging the results of the two observers. The time for reading the images was not limited, and each observer could freely adjust the window levels and window widths on the monitor screen.
2.6. Statistical Analysis
We used a two-tailed Student's t test to evaluate differences in SD, CNR, and CTDIvol between scanning performed with 80 kV and scanning performed with 120 kV. Both the relationship between SD and tube current-time product settings and the relationship between CNR and CTDIvol were investigated using the linear regression analysis and Pearson correlation coefficient (r). For subjective assessment, the Mann-Whitney U test was used to analyze differences in subjective scores between standard setting (120 kV, 300 mAs) and low tube voltage settings (80 kV, 150–650 mAs). Interobserver variation was assessed using Cohen kappa statistics. Kappa values less than 0.20 indicated poor agreement; 0.21–0.40, fair agreement; 0.41–0.60, moderate agreement; 0.61–0.80, good agreement; 0.81–1.00, excellent agreement. All statistical analyses were performed with a commercially available software package (SPSS, version 15.0), and a P value of less than 0.05 was considered to be statistically significant.
3. Results
3.1. Radiation Dose
The CTDIvol obtained from each set of acquisition conditions is shown in Table 1. At equal tube current-time product settings, the CTDIvol obtained at 80 kV was approximately 32% of that at 120 kV. Compared with the CTDIvol obtained at 120 kV and 300 mAs, the relative CTDIvols obtained at 80 kV were 16% at 150 mAs, 21% at 200 mAs, 27% at 250 mAs, 32% at 300 mAs, 37% at 350 mAs, 42% at 400 mAs, 47% at 450 mAs, 53% at 500 mAs, 58% at 550 mAs, 63% at 600 mAs, and 68% at 650 mAs.
Table 1.
The CTDIvol values obtained at each set of acquisition conditions.
| Tube current-time product (mAs) | CTDIvol (mGy) | |
|---|---|---|
| 120 kVp | 80 kVp | |
| 150 | 10.19 | 3.24 |
| 200 | 13.59 | 4.33 |
| 250 | 16.99 | 5.41 |
| 300 | 20.39 | 6.49 |
| 350 | 23.55 | 7.49 |
| 400 | 26.91 | 8.57 |
| 450 | 30.28 | 9.64 |
| 500 | 33.64 | 10.71 |
| 550 | 37.00 | 11.78 |
| 600 | 40.37 | 12.85 |
| 650 | 43.73 | 13.92 |
3.2. Image Quality Results
The results of CT numbers, image noise, and CNR at each scanning technique are listed in Table 2. As expected, the image noise was inversely correlative to tube current. At identical tube current, the lowest and the highest noise were seen at 120 kV and 80 kV, respectively (Figure 2). Compared with the noise obtained with 120 kV at 300 mAs, the noise obtained with 80 kV at 150–650 mAs was significantly higher (P < 0.001) (Table 2). There was a direct correlation between the CNR and the CTDIvol, with Pearson correlation coefficient r = 0.95 (P < 0.001) at 80 kV and r = 0.96 (P < 0.001) at 120 kV. At identical CTDIvol, use of 80 kV tube voltage resulted in higher CNR compared with CNR at 120 kV. At identical CNR, the CTDIvol at 80 kV was substantially lower than that at 120 kV (Figure 3). By using a two-tailed Student's t test, the CNRs obtained at 80 kV and 150–500 mAs were significantly lower than that at 120 kV and 300 mAs (P < 0.05) (Table 2). However, there was no statistically significant difference between the CNR obtained with 120 kV at 300 mAs and the CNR obtained with 80 kV at 550 mAs, 600 mAs, and 650 mAs (P > 0.05) (Table 2).
Table 2.
The CT numbers, image noise, and CNR obtained at each set of acquisition conditions.
| Tube current-time product (mAs) | CT number | P value | Image noise | P value* | CNR | P value* | |||
|---|---|---|---|---|---|---|---|---|---|
| 120 kV | 80 kV | 120 kV | 80 kV | 120 kV | 80 kV | ||||
| 150 | 56.12 | 27.56 | <0.001 | 5.10 | 9.60 | <0.001 | 0.89 | 0.62 | <0.001 |
| 200 | 56.34 | 27.73 | <0.001 | 4.45 | 8.20 | <0.001 | 1.20 | 0.79 | <0.001 |
| 250 | 56.21 | 28.17 | <0.001 | 4.09 | 7.61 | <0.001 | 1.46 | 0.87 | 0.006 |
| 300 | 56.76 | 28.35 | <0.001 | 3.61 | 6.50 | <0.001 | 1.73 | 1.04 | 0.029 |
| 350 | 56.93 | 28.21 | <0.001 | 3.37 | 5.88 | <0.001 | 1.95 | 1.00 | 0.025 |
| 400 | 56.77 | 28.41 | <0.001 | 3.15 | 5.70 | <0.001 | 1.97 | 1.04 | 0.028 |
| 450 | 56.69 | 28.43 | <0.001 | 2.91 | 4.96 | <0.001 | 2.11 | 1.07 | 0.031 |
| 500 | 57.00 | 28.36 | <0.001 | 2.77 | 4.82 | <0.001 | 2.29 | 1.19 | 0.042 |
| 550 | 56.78 | 28.68 | <0.001 | 2.75 | 4.97 | <0.001 | 2.21 | 1.38 | 0.224 |
| 600 | 57.14 | 28.78 | <0.001 | 2.65 | 4.76 | <0.001 | 2.33 | 1.40 | 0.272 |
| 650 | 57.14 | 28.86 | <0.001 | 2.48 | 4.27 | <0.001 | 2.47 | 1.53 | 0.501 |
*The P values are those obtained with 80 kV at the 150–650 mAs settings compared with the values obtained with 120 kV and 300 mAs.
Figure 2.
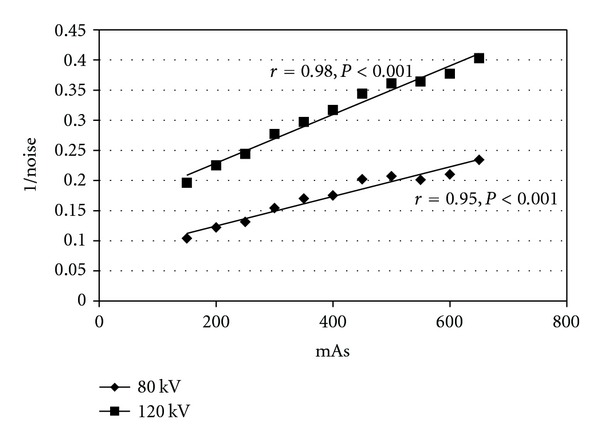
Graph shows inversely correlative between tube current (mAs) and image noise. At identical tube current, image noise obtained at 80 kV is higher than that at 120 kV.
Figure 3.
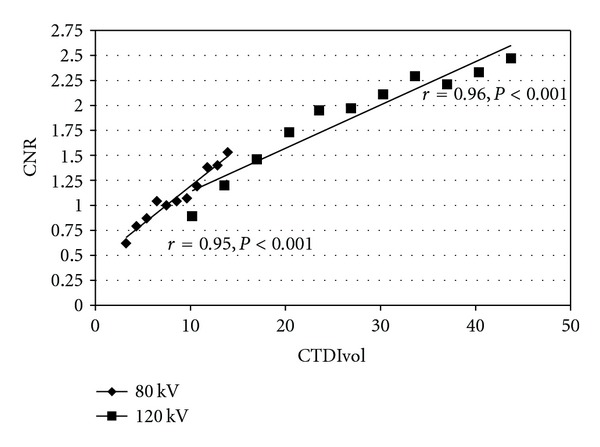
Graph shows relationship between CTDIvol and CNR. The Pearson correlation coefficient (r) and the corresponding P values were r = 0.95 and P < 0.001 at 80 kV and r = 0.96 and P < 0.001 at 120 kV.
3.3. LCD Results
The subjective scores of LCD assigned by two observers are shown in Table 3. The mean score of the three images assigned at 120 kV and 300 mAs was 2.83 ± 0.41. At 80 kV, the mean score (1.00 ± 0.00 at 150–250 mAs, 1.83 ± 0.41 at 300 mAs, 2.00 ± 0.00 at 350 mAs, 2.33 ± 0.52 at 400–500 mAs) was significantly lower than that at 120 kV and 300 mAs (P = 0.001 at 150–350 mAs; P = 0.019 at 400–500 mAs) (Table 3). However, there was no statistically significant difference between the mean score at 120 kV and 300 mAs and the mean score assigned at 80 kV and the other tube current settings that we investigated (P = 0.138 at 550 mAs; P = 0.317 at 600 mAs; P = 1.0 at 650 mAs) (Table 3). Using Cohen kappa statistics, the interobserver agreement in regard to subjective assessment of LCD was good (κ = 0.67).
Table 3.
The subjective scores of LCD.
| Tube voltage/tube current-time product | Subjective score of LCD | Mean | P value* | |
|---|---|---|---|---|
| Observer A | Observer B | |||
| 80 kV/150 mAs | 3.0 (1.0, 1.0, 1.0) | 3.0 (1.0, 1.0, 1.0) | 1.00 ± 0.00 | 0.001 |
| 80 kV/200 mAs | 3.0 (1.0, 1.0, 1.0) | 3.0 (1.0, 1.0, 1.0) | 1.00 ± 0.00 | 0.001 |
| 80 kV/250 mAs | 3.0 (1.0, 1.0, 1.0) | 3.0 (1.0, 1.0, 1.0) | 1.00 ± 0.00 | 0.001 |
| 80 kV/300 mAs | 5.0 (1.0, 2.0, 2.0) | 6.0 (2.0, 2.0, 2.0) | 1.83 ± 0.41 | 0.001 |
| 80 kV/350 mAs | 6.0 (2.0, 2.0, 2.0) | 6.0 (2.0, 2.0, 2.0) | 2.00 ± 0.00 | 0.001 |
| 80 kV/400 mAs | 7.0 (2.0, 3.0, 2.0) | 7.0 (2.0, 3.0, 2.0) | 2.33 ± 0.52 | 0.019 |
| 80 kV/450 mAs | 7.0 (3.0, 2.0, 2.0) | 7.0 (2.0, 2.0, 3.0) | 2.33 ± 0.52 | 0.019 |
| 80 kV/500 mAs | 8.0 (2.0, 3.0, 3.0) | 6.0 (2.0, 2.0, 2.0) | 2.33 ± 0.52 | 0.019 |
| 80 kV/550 mAs | 8.0 (3.0, 3.0, 2.0) | 8.0 (3.0, 2.0,3.0) | 2.67 ± 0.52 | 0.138 |
| 80 kV/600 mAs | 9.0 (3.0, 3.0, 3.0) | 8.0 (2.0, 3.0, 3.0) | 2.83 ± 0.41 | 0.317 |
| 80 kV/650 mAs | 9.0 (3.0, 3.0, 3.0) | 9.0 (3.0, 3.0, 3.0) | 3.00 ± 0.00 | 1.000 |
| 120 kV/300 mAs | 9.0 (3.0, 3.0, 3.0) | 9.0 (3.0, 3.0, 3.0) | 3.00 ± 0.00 | — |
*The P values are those obtained with 80 kV at the 150–650 mAs settings compared with the values obtained with 120 kV and 300 mAs. There was good agreement between observer A and observer B in regard to subjective assessment of LCD (κ = 0.67).
4. Discussion
Improvement in MDCT technology now allows CT examinations to be easily and fast performed, leading to a possible increase of the radiation dose to patients. In particular, the radiation exposure and risk of cancer death from hepatic CT examinations have notably increased because multiple-phase dynamic-enhanced CT scan is routinely performed. Managing patient dose is therefore a major concern in abdominal MDCT examinations.
In our study, we used the CT dose index volume (CTDIvol) based on the manufacturer's data for estimation of radiation dose. CTDI, expressed in terms of air kerma in milligray, was obtained at the periphery (CTDIp) and at the centre (CTDIc) of a special 100 mm long pencil-shaped ionisation chamber. The weighted CTDIw is obtained as the sum of one-third of CTDIc and two-thirds of CTDIp. The CTDIvol, which is CTDIw divided by the pitch, represents the average volume dose (air kerma) within a specified CT dosimetry phantom [18]. CTDIvol is a good measure of CT radiation dose for applications where the patient table is incremented during the scan. Adoption of CTDIvol as the intensity of the radiation dose would facilitate accurate comparisons of radiation doses used for different tube voltages. For instance, in our study, it is easy for us to compare the difference of radiation dose between 80 kV and 120 kV tube voltage. Results of our study showed that it was possible to reduce radiation exposure substantially by decreasing the tube voltage from 120 kV to 80 kV. However, it has limitations. Because the CTDIvol is an averaged dose to a homogeneous cylindrical phantom, the measurements are only an approximation of patient dose. Another limitation is that CTDIvol phantom does not provide a sufficiently long scatter path relative to the typical length of a human; hence, patient dose may be underestimated with CTDIvol [19]. Therefore, the results of radiation dose based on the CTDIvol in our study could not be accurate represented patient dose. Furthermore, the difference of the radiation dose between the central and peripheral cavities of the phantom also could not be discerned by using the CTDIvol as estimation of radiation dose.
In present study, our findings showed that there was a direct correlation between the CNR and the CTDIvol, which was consistent with previous studies [16, 20]. Although the mean CNR was decreased when CT acquisition was performed at a tube voltage of 80 kV and an identical tube current setting, CNR improved substantially when identical CTDIvol was used. Compared with CNR obtained at 120 kV and 300 mAs, there was no statistically significant difference at 80 kV and 550 mAs, 600 mAs, and 650 mAs (P > 0.05). This suggest that image quality including CNR acquired at 80 kV with tube current higher than 550 mAs is equivalent to that acquired at 120 kV and 300 mAs. Furthermore, the relative radiation dose obtained at 80 kV and 550 mAs, 600 mAs, and 650 mAs was 58%, 63%, and 68% of that at 120 kVp and 300 mAs, respectively. Therefore, we postulate that scanning with a low tube voltage as low as 80 kV is feasible in abdominal CT examination without loss of diagnostic accuracy when the tube current is higher than 550 mAs allowing reduction in the radiation dose by 32% to 42%.
LCD is one of the most important factors in abdominal CT, especially when looking for small lesions in abdominal organs such as liver, spleen, pancreas, or kidneys. This LCD is not only relevant for unenhanced series but also contrast enhanced series, as contrast between normal and abnormal tissue may be only slightly increased by iodine [21]. Awai et al. [22] reported that in enhanced hepatic CT, tumor-to-liver contrast was 5–40 HU. In present study, the object with a contrast difference of 1.0% (having an attenuation difference with the background of 10 HU) was chosen to be analyzed. When the two experienced observers subjectively assessed the visibilities of low-contrast images, the subjective scores of LCD assigned at 80 kV and 550, 600, and 650 mAs did not differ significantly from those assigned at 120 kV and 300 mAs. Furthermore, the mean score of LCD obtained at 80 kV and 650 mAs was slightly higher than that at 120 kV and 300 mAs. These results suggested that a reduction from 120 kV to 80 kV also could result in up to 42% dose reduction without compromising LCD. Funama et al. [16] showed that a 35% reduction in the radiation dose could be achieved when scanning was performed at 90 kV rather than at 120 kV without degradation of LCD. Our findings agree with Funama and suggest that lower tube voltage can be used in abdominal CT thereby achieving dose reduction while maintaining acceptable image quality. In this study, we found no statistically significant difference in both CNR and LCD at 120 kV and 300 mAs compared with those at 80 kV and 550–650 mAs. This is probably because CNR and LCD are parallel to each other, which is consistent with Verdun's result [17]. He found that there was a significant correlation between the mean CNR measurements and the subjective scores of LCD (r = 0.95, P < 0.05).
The main drawback of the low tube voltage technique is the increase in image noise caused by the reduced photon flux. In our study, we found that the noise values obtained with 80 kV at the 150–650 mAs settings were significant higher than that obtained with 120 kV and 300 mAs (P < 0.001). As previously reported [10, 20], we found that there was an inversely correlative relationship between the image noise and the tube current. In another word, the increased noise will be obtained when the strategy of lower tube current or lower tube voltage is implemented. Image noise, however, has a greater effect on the quality of abdominal images because the abdominal region is inherently of lower contrast. Therefore, for CT scanning with low tube voltage, higher tube current settings are required to compensate for the lower number of photons. In addition, some new techniques should be developed to reduce image noise. Several articles in the last years have been reported that noise reduction filters [23–25] as well as reconstruction methods, such as adaptive statistical iterative reconstruction [26–28] could effectively help to reduce the noise on CT images with radiation dose reduction without compromise of image quality.
4.1. Study Limitations
We acknowledge that this study contains certain limitations. First, this CT scanning with low tube voltage at 80 kV was only performed in a phantom study, and the phantom did not consider variability of body composition, therefore, whether this result is suitable to clinical using needs to be further confirmed. However, Marin et al. [14] showed that a technique with low tube voltage at 80 kV could be applied to improve the conspicuity of malignant hypervascular liver tumors while significantly reducing patient radiation dose. Secondly, our investigation did not take into account differences in body sizes. Attenuation of the incident X-ray beam in CT depends on the size of body portion being evaluated; that is, greater exposure is required in corpulent patients to attain image quality equal to that in slimmer patients [29]. Although studies in patients were not part of this investigation, previous studies with a phantom suggest that the technique is effective for dose reduction of abdominal CT for relatively light weight patients whose body weight is less than 80 kg [30]. Another important aspect is that many patients present with high-attenuation implants, which can dramatically decrease image quality when low kV protocols are used routinely. Finally, we only used the CTDIvol provided by the manufacturer to estimate the radiation dose. Although the agreement between the values provided by the manufacturer and the measured values was good, with differences of less than 10% [31], there were some limitations as mentioned above.
5. Conclusions
In this CT phantom study we have shown that although image noise is increased at low tube voltage, it is possible to reduce radiation dose by up to 42% without degradation of CNR and LCD by reducing tube voltage from 120 to 80 kV and increasing tube current to more than 550 mAs. As an effective technique of reducing CT radiation dose, scanning with low tube voltage would benefit patients with relatively light weight, especially those who may need to undergo MDCT examinations for long-term followup or high-risk screening.
References
- 1.Mettler FA, Jr., Bhargavan M, Faulkner K, et al. Radiologic and nuclear medicine studies in the United States and worldwide: frequency, radiation dose, and comparison with other radiation sources—1950–2007. Radiology. 2009;253(2):520–531. doi: 10.1148/radiol.2532082010. [DOI] [PubMed] [Google Scholar]
- 2.Brenner DJ, Elliston CD. Estimated radiation on risks potentially associated with full-body CT screening. Radiology. 2004;232(3):735–738. doi: 10.1148/radiol.2323031095. [DOI] [PubMed] [Google Scholar]
- 3.Brenner DJ. Radiation risks potentially associated with low-dose CT screening of adult smokers for lung cancer. Radiology. 2004;231(2):440–445. doi: 10.1148/radiol.2312030880. [DOI] [PubMed] [Google Scholar]
- 4.De González AB, Darby S. Risk of cancer from diagnostic X-rays: estimates for the UK and 14 other countries. Lancet. 2004;363(9406):345–351. doi: 10.1016/S0140-6736(04)15433-0. [DOI] [PubMed] [Google Scholar]
- 5.Tsapaki V, Rehani M, Saini S. Radiation safety in abdominal computed tomography. Seminars in Ultrasound, CT and MRI. 2010;31(1):29–38. doi: 10.1053/j.sult.2009.09.004. [DOI] [PubMed] [Google Scholar]
- 6.Sohaib SA, Peppercorn PD, Horrocks JA, Keene MH, Kenyon GS, Reznek RH. The effect of decreasing mAs on image quality and patient dose in sinus CT. British Journal of Radiology. 2001;74(878):157–161. doi: 10.1259/bjr.74.878.740157. [DOI] [PubMed] [Google Scholar]
- 7.Hamberg LM, Rhea JT, Hunter GJ, Thrall JH. Multi-detector row CT: radiation dose characteristics. Radiology. 2003;226(3):762–772. doi: 10.1148/radiol.2263020205. [DOI] [PubMed] [Google Scholar]
- 8.Frush DP, Slack CC, Hollingsworth CL, et al. Computer-simulated radiation dose reduction for abdominal multidetector CT of pediatric patients. American Journal of Roentgenology. 2002;179(5):1107–1113. doi: 10.2214/ajr.179.5.1791107. [DOI] [PubMed] [Google Scholar]
- 9.Kopp AF, Heuschmid M, Claussen CD. Multidetector helical CT of the liver for tumor detection and characterization. European Radiology. 2002;12(4):745–752. doi: 10.1007/s00330-001-1177-1. [DOI] [PubMed] [Google Scholar]
- 10.Managing patient dose in computed tomography. A report of the International Commission on Radiological Protection. Annals of the ICRP. 2000;30(4):7–45. doi: 10.1016/s0146-6453(01)00049-5. [DOI] [PubMed] [Google Scholar]
- 11.Hausleiter J, Martinoff S, Hadamitzky M, et al. Image quality and radiation exposure with a low tube voltage protocol for coronary CT angiography: results of the PROTECTION II Trial. Cardiovascular Imaging. 2010;3(11):1113–1123. doi: 10.1016/j.jcmg.2010.08.016. [DOI] [PubMed] [Google Scholar]
- 12.Marin D, Nelson RC, Barnhart H, et al. Detection of pancreatic tumors, image quality, and radiation dose during the pancreatic parenchymal phase: effect of a low-tube-voltage, high-tube-current CT technique—preliminary results. Radiology. 2010;256(2):450–459. doi: 10.1148/radiol.10091819. [DOI] [PubMed] [Google Scholar]
- 13.Schindera ST, Nelson RC, Mukundan S, et al. Hypervascular liver tumors: low tube voltage, high tube current multi-detector row CT for enhanced detection—phantom study. Radiology. 2008;246(1):125–132. doi: 10.1148/radiol.2461070307. [DOI] [PubMed] [Google Scholar]
- 14.Marin D, Nelson RC, Samei E, et al. Hypervascular liver tumors: low tube voltage, high tube current multidetector CT during late hepatic arterial phase for detection—initial clinical experience. Radiology. 2009;251(3):771–779. doi: 10.1148/radiol.2513081330. [DOI] [PubMed] [Google Scholar]
- 15.Bischoff B, Hein F, Meyer T, et al. Impact of a reduced tube voltage on CT angiography and radiation dose. Results of the PROTECTION I Study. Cardiovascular Imaging. 2009;2(8):940–946. doi: 10.1016/j.jcmg.2009.02.015. [DOI] [PubMed] [Google Scholar]
- 16.Funama Y, Awai K, Nakayama Y, et al. Radiation dose reduction without degradation of low-contrast detectability at abdominal multisection CT with a low-tube voltage technique: phantom study. Radiology. 2005;237(3):905–910. doi: 10.1148/radiol.2373041643. [DOI] [PubMed] [Google Scholar]
- 17.Verdun FR, Denys A, Valley JF, Schnyder P, Meuli RA. Detection of low-contrast objects: experimental comparison of single- and multi-detector row CT with a phantom1. Radiology. 2002;223(2):426–431. doi: 10.1148/radiol.2232010810. [DOI] [PubMed] [Google Scholar]
- 18.McCollough CH, Bruesewitz MR, McNitt-Gray MF, et al. The phantom portion of the American College of Radiology (ACR) Computed Tomography (CT) accreditation program: practical tips, artifact examples, and pitfalls to avoid. Medical Physics. 2004;31(9):2423–2442. doi: 10.1118/1.1769632. [DOI] [PubMed] [Google Scholar]
- 19.Dixon RL, Ekstrand KE. A film dosimetry system for use in computed tomography. Radiology. 1978;127(1):255–258. doi: 10.1148/127.1.255. [DOI] [PubMed] [Google Scholar]
- 20.Waaijer A, Prokop M, Velthuis BK, Bakker CJG, De Kort GAP, Van Leeuwen MS. Circle of Willis at CT angiography: dose reduction and image quality—reducing tube voltage and increasing tube current settings. Radiology. 2007;242(3):832–839. doi: 10.1148/radiol.2423051191. [DOI] [PubMed] [Google Scholar]
- 21.Brisse HJ, Brenot J, Pierrat N, et al. The relevance of image quality indices for dose optimization in abdominal multi-detector row CT in children: experimental assessment with pediatric phantoms. Physics in Medicine and Biology. 2009;54(7):1871–1892. doi: 10.1088/0031-9155/54/7/002. [DOI] [PubMed] [Google Scholar]
- 22.Awai K, Takada K, Onishi H, Hori S. Aortic and hepatic enhancement and tumor-to-liver contrast: analysis of the effect of different concentrations of contrast material at multi-detector row helical CT. Radiology. 2002;224(3):757–763. doi: 10.1148/radiol.2243011188. [DOI] [PubMed] [Google Scholar]
- 23.Yanaga Y, Awai K, Funama Y, et al. Low-dose MDCT urography: feasibility study of low-tube-voltage technique and adaptive noise reduction filter. American Journal of Roentgenology. 2009;193(3):W220–W229. doi: 10.2214/AJR.08.1710. [DOI] [PubMed] [Google Scholar]
- 24.Kalra MK, Maher MM, Sahani DV, et al. Low-dose CT of the abdomen: evaluation of image improvement with use of noise reduction filters—pilot study. Radiology. 2003;228(1):251–256. doi: 10.1148/radiol.2281020693. [DOI] [PubMed] [Google Scholar]
- 25.Kalra MK, Maher MM, Blake MA, et al. Detection and characterization of lesions on low-radiation-dose abdominal CT images postprocessed with noise reduction filters. Radiology. 2004;232(3):791–797. doi: 10.1148/radiol.2323031563. [DOI] [PubMed] [Google Scholar]
- 26.Yanagawa M, Honda O, Yoshida S, et al. Adaptive statistical iterative reconstruction technique for pulmonary CT. Image quality of the cadaveric lung on standard- and reduced-dose CT. Academic Radiology. 2010;17(10):1259–1266. doi: 10.1016/j.acra.2010.05.014. [DOI] [PubMed] [Google Scholar]
- 27.Singh S, Kalra MK, Gilman MD, et al. Adaptive statistical iterative reconstruction technique for radiation dose reduction in chest CT: a pilot study. Radiology. 2011;259(2):565–573. doi: 10.1148/radiol.11101450. [DOI] [PubMed] [Google Scholar]
- 28.Sagara Y, Hara AK, Pavlicek W, Silva AC, Paden RG, Wu Q. Abdominal CT: comparison of low-dose CT with adaptive statistical iterative reconstruction and routine-dose CT with filtered back projection in 53 patients. American Journal of Roentgenology. 2010;195(3):713–719. doi: 10.2214/AJR.09.2989. [DOI] [PubMed] [Google Scholar]
- 29.Haaga JR. Radiation dose management: weighing risk versus benefit. American Journal of Roentgenology. 2001;177(2):289–291. doi: 10.2214/ajr.177.2.1770289. [DOI] [PubMed] [Google Scholar]
- 30.Nakayama Y, Awai K, Funama Y, et al. Abdominal CT with low tube voltage: preliminary observations about radiation dose, contrast enhancement, image quality, and noise. Radiology. 2005;237(3):945–951. doi: 10.1148/radiol.2373041655. [DOI] [PubMed] [Google Scholar]
- 31.Verdun FR, Theumann N, Poletti PA, et al. Impact of the introduction of 16-row MDCT on image quality and patient dose: phantom study and multi-centre survey. European Radiology. 2006;16(12):2866–2874. doi: 10.1007/s00330-006-0396-x. [DOI] [PubMed] [Google Scholar]