

Abstract
Background. Chronic alcohol-related liver disease (ALD) is mediated by insulin resistance, mitochondrial dysfunction, inflammation, oxidative stress, and DNA damage. Recent studies suggest that dysregulated lipid metabolism with accumulation of ceramides, together with ER stress potentiate hepatic insulin resistance and may cause steatohepatitis to progress. Objective. We examined the degree to which hepatic insulin resistance in advanced human ALD is correlated with ER stress, dysregulated lipid metabolism, and ceramide accumulation. Methods. We assessed the integrity of insulin signaling through the Akt pathway and measured proceramide and ER stress gene expression, ER stress signaling proteins, and ceramide profiles in liver tissue. Results. Chronic ALD was associated with increased expression of insulin, IGF-1, and IGF-2 receptors, impaired signaling through IGF-1R and IRS1, increased expression of multiple proceramide and ER stress genes and proteins, and higher levels of the C14, C16, C18, and C20 ceramide species relative to control. Conclusions. In human chronic ALD, persistent hepatic insulin resistance is associated with dysregulated lipid metabolism, ceramide accumulation, and striking upregulation of multiple ER stress signaling molecules. Given the role of ceramides as mediators of ER stress and insulin resistance, treatment with ceramide enzyme inhibitors may help reverse or halt progression of chronic ALD.
1. Introduction
Worldwide, alcohol abuse is one of the leading causes of morbidity and mortality from chronic liver disease [1, 2]. In its initial stages, alcohol-related liver disease (ALD) is characterized by hepatic steatosis, which is largely reversible. However, with continued chronic alcohol abuse, liver disease can progress through stages of steatohepatitis, followed by fibrosis, and then cirrhosis, and in the late stages, it may culminate in liver failure or hepatocellular carcinoma [3]. Previous studies linked chronic ALD to the combined effects of hepatic insulin resistance and toxicity mediated by inflammation, oxidative stress, mitochondrial dysfunction, or acetaldehyde-induced adduct formation [4–7]. The consequences include impairments in hepatocellular survival, energy metabolism, and capacity to regenerate and remodel after injury. Together, these responses serve as potent stimuli for stellate cell activation and attendant fibrogenesis [8].
Recent studies have linked insulin resistance with inflammation and oxidative stress to dysregulated lipid metabolism and increased ceramide generation [9–11]. However, ceramides can further impair insulin signaling, mitochondrial function, and cell viability [12, 13]. Ceramides comprise a family of simple sphingolipids generated from fatty acid and sphingosine [13–15]. Although ceramides are present at low levels within biological membranes, they make important contributions to cell membrane structure by participating in lipid raft formation. In addition, ceramides exert diverse regulatory effects on cell signaling pathways that mediate growth, proliferation, motility, adhesion, differentiation, senescence, and apoptosis [12, 13, 16–18].
Ceramides are generated via 3 main pathways: (1) de novo synthesis by coupling sphinganine to a long-chain fatty acid, yielding dihydroceramide; (2) hydrolysis of complex sphingolipids such as sphingomyelin or glycosphingolipids; (3) recycling after acylation of sphingosine, utilizing the “salvage pathway” [16, 17]. Ceramides cause insulin resistance by activating proinflammatory cytokines, inhibiting transmission of signals through phosphatidyl-inositol-3 kinase (PI3K) and Akt [19–22], and activating protein phosphatase 2A (PP2A) [23, 24]. Furthermore, ceramides can promote apoptosis by activating protein kinase C, PP1, caspases, and cathepsin D [16, 18]. Therefore, dysregulated lipid metabolism promoted by insulin resistance leads to increased generation of ceramides that exacerbate insulin resistance, inflammation, tissue injury, and cell death.
Emerging evidence suggests that ceramide production can be modulated by ethanol exposure, and that some of the hepatotoxic and degenerative effects of ethanol may be mediated by ceramide accumulation in liver. For example, ethanol increases ceramide levels by activating acidic sphingomyelinase [25], and ethanol-exposed hepatocyte cultures exhibit reduced levels of sphingomyelin and sphingosine, and increased levels of ceramide [26]. The findings that (1) mice deficient in acidic sphingomyelinase are resistant to ethanol-induced hepatic steatosis [27], and (2) ceramides contribute to the inhibitory effects of ethanol on AMPK phosphorylation [28] suggest that ceramides generated in ethanol exposed livers may cause liver injury.
Increased ceramide production can lead to endoplasmic reticulum (ER) stress and thereby contribute to the progression of ALD. ER stress can potentiate insulin resistance and lipolysis leading to increased ceramide production [29–32] and worsening of inflammation and insulin resistance. ER stress is caused by disruption of homeostatic mechanisms, causing unfolded proteins to accumulate, and reactive oxygen species (ROS) to form [33]. Normally, the ER adapts to stress by activating the unfolded protein response (UPR) [34, 35], which quickly increases the levels of ER stress sensor proteins including inositol-requiring enzyme 1 (IRE1), PKR-like ER-localized eIF2α kinase (PERK), and the activating transcription factor 6α (ATF-6α; ER membrane-anchored transcription factor). PERK and IRE1 activate ER stress networks by transmitting signals in response to protein misfolding or unfolding. PERK promotes a global arrest of protein synthesis by stimulating phosphorylation of eukaryotic translation initiation factor 2α (eIF2α), selective translation of ATF4, and upregulation of the transcription factor C/EBP homologous protein CHOP. IRE1α promotes alternative splicing of XBP1, leading to increased transcription of chaperones and ER-associated protein degradation (ERAD) machinery. Activated ATF-6 promotes increased synthesis of chaperones and other components of the folding and ERAD machinery. Prolonged activation of the UPR induces a pathological response leading to inflammation, injury, steatosis, and apoptosis [34, 36].
The above discussion highlights the importance of insulin resistance in ALD, and the probable interrelationship among insulin resistance, increased ceramide generation, and ER stress. We hypothesize that progressive ALD is mediated by the establishment of a harmful positive feedback loop whereby insulin resistance leads to lipolysis and toxic ceramide generation, which promotes ER stress, and both toxic ceramides and ER stress worsen insulin resistance. The present work examines the potential contributions of sustained insulin resistance, ER stress, and dysregulated lipid metabolism with increased activation of proceramide mechanisms and ceramide accumulation in human livers with chronic ALD.
2. Materials and Methods
2.1. Materials
Antibodies to ER stress markers were purchased from Cell Signaling (Danvers, MA). The Akt Total and Phospho 7-Plex Panels, Taqman Gene expression master mix, and Amplex Red Sphingomyelinase assay kit were purchased from Invitrogen (Carlsbad, CA). Bead-based magnetic immunoassays for cytokines quantification were from Biorad (Hercules, CA). MaxiSorp 96-well plates used for ELISAs were from Nunc (Thermo Fisher Scientific; Rochester, NY). Superblock-TBS, horseradish peroxidase-conjugated antibodies, and SuperSignal Enhanced Chemiluminescence Reagents were from Pierce Chemical Co (Rockford, IL). QIAzol Lysis Reagent for RNA extraction was obtained from Qiagen, Inc (Valencia, CA). The AMV 1st Strand cDNA Synthesis kit, the Universal Probe Library probes, and Reference gene assays were purchased from Roche Applied Science (Indianapolis, IN). The Serum Triglyceride Determination kit, monoclonal anti-ceramide, and synthetic oligodeoxynucleotides were purchased from Sigma-Aldrich Co (St. Louis, MO). All other monoclonal antibodies and immunodetection reagents were purchased from Abcam (Cambridge, MA), Upstate (Billerica, MA), Vector Laboratories (Burlingame, CA), Invitrogen (Carlsbad, CA), or Chemicon (Temecula, CA). Fine chemicals were purchased from CalBiochem (Carlsbad, CA) or Sigma-Aldrich (St. Louis, MO).
2.2. Source of Human Liver Tissue
Liver tissue biopsies from patients with chronic ALD and cirrhosis were obtained from the Liver Tissue Procurement Distribution System (NIH Contract no. N01-DK-9-2310). Normal human control liver biopsy tissue samples were obtained from the Lifespan-Rhode Island Hospital Tumor Bank (Providence, RI). Control liver samples represented remnant tissue from surgical biopsies performed for diagnosis. 10 samples were analyzed in each group. All specimens were deidentified and their use in this study was approved by the Lifespan Human Studies Committee and Investigational Review Board. Snap-frozen fresh tissues stored at −80°C were used for RNA, protein, and lipid studies. Formalin-fixed paraffin-embedded tissue sections were stained with hematoxylin and eosin (H&E) and with Masson's trichrome for histological assessment.
2.3. Quantitative Reverse Transcriptase Polymerase Chain Reaction (qRT-PCR) Assays
RNA extracted from fresh frozen liver using the RNeasy Mini Kit was reverse-transcribed using random oligonucleotide primers and the AMV 1st Strand cDNA Synthesis Kit. Gene expression was measured in duplicate reactions with a hydrolysis probe-based duplex qRT-PCR assay in which hypoxanthine-guanine phosphoribosyltransferase (HPRT) was included as a reference gene. Reactions (20 μL) contained Taqman Gene expression master mix, 400 nM of gene-specific and HPRT primers, and 200 nM of HPRT (Y555 labeled) and gene of interest (FAM labeled) probes. Gene-specific primer sequences and matched probes were determined with the ProbeFinder Software (Roche, Indianapolis, IN) (Table 1). PCR amplifications were initiated by a 10-minute, 95°C denaturation step and followed by 45–50 2-step cycles of denaturation (15-seconds at 95°C) and annealing/extension (1-minute at 60°C). The amplifications were performed in a LightCycler 480 PCR machine (Roche, Indianapolis, IN). Fluorescence signals corresponding to the genes of interest were acquired in the FAM Channel (Em: 520–530 nm), and the HPRT signal was acquired in the Y555/HEX channel (Em: 550–568 nm). Results were analyzed using LightCycler Software 4.0. Alternatively, gene expression was measured in triplicate by qRT-PCR analysis using QuantiTect SYBR Green PCR Mix and gene-specific primer pairs [37], with results normalized to 18S rRNA as described [10].
Table 1.
List of primers used for qRT-PCR analysis of gene expression.
| Primer | Sequence (5′ → 3′) | Position (mRNA) | Amplicon size (bp) | UPL probe no. | |
|---|---|---|---|---|---|
| HERP | FOR | ACTGTCGTTGCAGAGATTGC | 322 | 107 | 70 |
| HERP | REV | GTTCGGTCTCGGACTCCAT | 410 | ||
| GRP-78/Bip | FOR | TGAAGGTGAAAGACCCCTGA | 1654 | 107 | 15 |
| GRP-78/Bip | REV | CAAAGGTGACTTCAATCTGTGG | 1739 | ||
| EDEM-1 | FOR | GCTGAGTGATTACCTTAGCCACA | 5504 | 72 | 15 |
| EDEM-1 | REV | TGGACAGGAAAGCTCAGGAT | 5556 | ||
| WARS | FOR | CTGGACGGGTGGACTTAGC | 2667 | 77 | 74 |
| WARS | REV | GAGGCCTGCCTAGACATCTG | 2724 | ||
| PDI | FOR | TGAGGTCTGCGGAAGGTC | 2226 | 95 | 16 |
| PDI | REV | TCCGAGATACTGTCGTTTGTTG | 2299 | ||
| P58IPK | FOR | CTGAAGGAGCAAGAGACCATC | 2182 | 76 | 87 |
| P58IPK | REV | TTAATCCAAAGTCTAAGCCTGGATA | 2233 | ||
| BAX | FOR | TGACCCCTGACCTCACTGT | 763 | 82 | 29 |
| BAX | REV | TGAGCAATTCCAGAGGCAGT | 825 | ||
| CHOP | FOR | GTCATTGCCTTTCTCCTTCG | 192 | 61 | 33 |
| CHOP | REV | GTCCTCATACCAGGCTTCCA | 233 | ||
| ATF-4 | FOR | AAGGAGTTCGACTTGGATGC | 1156 | 78 | 85 |
| ATF-4 | REV | ATCCAACGTGGTCAGAAGGT | 1214 | ||
| CERS1 | FOR | CAATGTGGGCATCCTTGTG | 669 | 61 | 4 |
| CERS1 | REV | GGTGAACTCAAGCTGCACG | 711 | ||
| CERS2 | FOR | ACTTCTGGTGGGAACGTCTG | 370 | 73 | 27 |
| CERS2 | REV | ACACGTCCATCTCGGTCTTC | 423 | ||
| CERS4 | FOR | GCAGGTGATACACCACTTCG | 944 | 91 | 62 |
| CERS4 | REV | TAACAGCAGCACCAGAGAGC | 1015 | ||
| CERS5 | FOR | CATATGCGTGAGTTTCATTGC | 1440 | 95 | 57 |
| CERS5 | REV | GTGGAACTAAGGTGGGTTCAGT | 1513 | ||
| CERS6 | FOR | GCTGGTTTCGACAAAGACG | 468 | 60 | 2 |
| CERS6 | REV | TCTCACAGAACCTCGTCAGC | 508 | ||
| UGCG | FOR | GATCAGGTGGACCAAACTACG | 1109 | 71 | 4 |
| UGCG | REV | AGCATTCTGAAATTGGCTCAC | 1159 | ||
| GM3 Syn | FOR | TGCTGCTGATACTGGGTCTG | 1710 | 77 | 26 |
| GM3 Syn | REV | CAACAGAGAAGGGTTGTGACC | 1766 | ||
| SMPD-1 | FOR | GCACACCTGTCAATAGCTTCC | 1142 | 78 | 52 |
| SMPD-1 | REV | TGGCCATCGCTTCATAGAG | 1201 | ||
| SMPD-3 | FOR | AGGACCTGCTGTCTGCTGTC | 3956 | 76 | 79 |
| SMPD-3 | REV | TTGCAGCTCAATGGGTGAC | 4013 | ||
| SPTLC-1 | FOR | CGCGCTACTTGGAGAAAGA | 1324 | 77 | 52 |
| SPTLC-1 | REV | CTCTGTTTGTTCCACCGTGA | 1381 | ||
| SPTLC-2 | FOR | ATCGGTGTCGTTGTGGTTG | 1659 | 82 | 21 |
| SPTLC-2 | REV | TGGTATGAGCTGCTGACAGG | 1721 | ||
| CERD2 | FOR | GACCATGTCTGGACGAAGACTTC | 1626 | 77 | 34 |
| CERD2 | REV | CAACAGTCATGTTCTGCATCCC | 1681 | ||
| CERD3 | FOR | GGCAGTGGCTATAGCATATGG | 367 | 85 | 12 |
| CERD3 | REV | AGACCAGGCGGATGAACTG | 433 |
Abbreviations: CERS: ceramide synthase; SMPD: sphingomyelin phosphodiesterase; UGCG: UDP glucose ceramide glycosyltransferase; SPTLC: serine palmitoyl transferase; CERD: ceramidase; GM3Syn: GM3-synthase; EDEM: ER degradation-enhancing α-mannosidase-like protein; CHOP: C/EBP homologous protein; p58IPK: inhibitor of interferon-induced and double stranded RNA activated kinase; GRP78: glucose regulated protein 78; ATF: activating transcription factor-4; HERP: homocysteine-responsive endoplasmic reticulum-resident ubiquitin-like domain member 1; WARS: tryptophanyl-tRNA synthetase.
2.4. Enzyme-Linked Immunosorbent Assay (ELISA)
Liver homogenates were prepared in lysis buffer containing 50 mM Tris (pH 7.5), 150 mM NaCl, 5 mM EDTA (pH 8.0), 50 mM NaF, 0.1% Triton X-100, and protease and phosphatase inhibitors [38]. Direct binding ELISAs were performed in 96-well MaxiSorp plates. Protein homogenates (100 ng/50 μL) were adsorbed to the well bottoms by overnight incubation at 4°C, and then blocked for 3 hours with 1% bovine serum albumin (BSA) in TRIS buffered saline (TBS). After washing, the samples were incubated with primary antibody (0.1–0.4 μg/mL) for 1 hour at 37°C. Immunoreactivity was detected with horseradish-peroxidase-(HRP-) conjugated secondary antibody and Amplex UltraRed soluble fluorophore. Fluorescence intensity was measured (Ex 565 nm/Em 595 nm) in a SpectraMax M5 microplate reader (Molecular Devices, Sunnyvale, CA). Ceramide immunoreactivity was quantified by ELISA as previously described [39].
2.5. Bead-Based Multiplex ELISA
We used bead-based multiplex ELISAs to assess the integrity of signaling through the insulin and IGF-1 receptors, insulin receptor substrate, type 1 (IRS-1), and downstream through Akt-related pathways using Akt Total and Phospho 7-Plex Panels. The Akt Total 7-Plex panel measured immunoreactivity to insulin receptor (IR), IGF-1 receptor (IGF-1R), IRS-1, Akt, proline-rich Akt substrate of 40 kDa (PRAS40), ribosomal protein S6 kinase (p70S6K), and glycogen synthase kinase 3β (GSK-3β). The Akt Phospho 7-Plex panel measured immunoreactivity to pYpY1162/1163-IR, pYpY1135/1136-IGF-1R, pS312-IRS-1, pS473-Akt, pT246-PRAS40, pTpS421/424-p70S6K, and pS9-GSK3β. Samples containing 100 μg protein were incubated with the beads according to the manufacturer's protocol. Captured antigens were detected with secondary antibodies and phycoerythrin-conjugated anti-rabbit IgG. Proinflammatory cytokine levels in liver were measured with a 21-plex bead-based immunoassay (200 μg protein/well). Plates were read in a Bio-Plex 200 system (Bio-Rad, Hercules, CA).
2.6. Liquid Chromatography, Tandem Mass Spectrometry (LC-MS-MS) for Quantification of Ceramides in Liver Tissue
Lipids were extracted for ceramide profiling as described [40, 41]. In brief, 60–70 mg of fresh frozen tissue were homogenized in 10 volumes of ice cold phosphate-buffered saline (PBS). 200 μL of homogenate were extracted with isopropanol : water : ethyl acetate (30 : 10 : 60 by volume). The combined extracts were transferred to clean glass centrifuge tubes and evaporated at room temperature in a SpeedVac evaporator (Model SPD1010 Speed Vac System, Thermosavant, Holbrook, NY). The residues were redissolved in 100 μL of methanol, vortex-mixed and then centrifuged; 5 μL were injected in the analytical column. The system comprised a binary pump and autosampler (Shimadzu, Kyoto, Japan) coupled to an API 3200 triple quadruple mass spectrometric detector (AB Sciex, Toronto, Ontario, Canada), equipped with a Turbo V source electrospray ionization (ESI) probe. The chromatographic data were collected and analyzed using the Analyst package (version 1.4.1., AB Sciex). Multiple reaction monitoring (MRM) scanning was used for mass spectral detection and quantification of C14-Ceramide (N-myristoyl-D-erythro-sphingosine), C16-Ceramide (N-palmitoyl-D-erythro-sphingosine), C18-Ceramide (N-stearoyl-D-erythro-sphingosine), C20-Ceramide (N-arachydonyl-D-erythro-sphingosine) and C24-Ceramide (N-lignoceroyl-D-erythro-sphingosine). C17-Ceramide (Heptadecanoyl-D-erythro-sphingosine) was used as an internal standard.
Thermo-Hypersil GOLD PFP (50 × 2.1 mm, 3.0 μm) analytical columns were used for chromatographic separation of the lipids using Buffer A (1.0 mmol/L ammonium acetate, 0.5% formic acid, v/v/v) and Buffer B (1.0 mmol/L ammonium acetate, 0.5% formic acid, HPLC-grade methanol, v/v/v). The mobiles phase was comprised of solvent mixtures: A : B 50 : 50 (v/v) at 0.0 min; A : B 20 : 80 (v/v) for 0.01–8.0 min; A : B 5 : 95 (v/v) for 8.1–15.0 min; A : B 5 : 95 (v/v) for 15.1–20.0 min; A : B 5 : 95 (v/v) for 20.1-20.2 min; followed by column equilibration at A : B 50 : 50 (v/v) for five minutes, giving an injection cycle of 25 minutes. The flow rate was 250 μL/min. Specific pairs of precursor/product ions were as follows: the ion transitions were C14-Ceramide (510.5→492.4), C16-Ceramide (538.8→520.5), C17-Ceramide (552.6→534.4), C18-Ceramide (566.4→548.4), C20-Ceramide (594.7→576.2), and C24-Ceramide (650.6→632.5). The retention times for C14-Ceramide, C16-Ceramide, C17-Ceramide, C18-Ceramide, C-20-Ceramide, and C24-Ceramide were 9.4, 10.0, 10.4, 10.7, 11.1, and 12.1 minutes, respectively. The ionization was set at electrospray positive ion mode and at a temperature of 150°C utilizing nitrogen for the drying and collision gas (curtain gas, 10 psi; collision gas, 3 psi; ionspray voltage, 5500 V; ion source gas 1, 25 psi; ion source gas 2, 25 psi). Separate stock solutions of all compounds each containing 1.0 mM were prepared in methanol. Working standard solutions of combined analytes were prepared by serial dilution in methanol. Calibration standards were prepared in concentrations ranging from 0.5 μM to 500 μM (0.1 μM, 0.5 μM, 1 μM, 5 μM, 10 μM, 50 μM, 100 μM, 500 μM). The internal standard was used at a final concentration of 20 nM.
2.7. Statistical Analysis
Data depicted in box plots reflect group medians (horizontal bar), 95% confidence interval limits (upper and lower box limits), and range (whiskers). Tabulated data reflect means ± SEMs for each group. Data were analyzed using GraphPad Prism 5 software (GraphPad Software, Inc., San Diego, CA), and intergroup comparisons were made using Student's t-tests. Computer software generated P values are shown over the graph panels or in the tables.
3. Results
3.1. ALD Features
The 10 control livers all exhibited the normal chord-like architecture and were free of inflammation, steatosis, fibrosis, and cholestasis. Livers from the 10 chronic alcoholics had micronodular cirrhosis with steatohepatitis, apoptotic bodies, disorganization of the normal chord architecture, bile duct proliferation, and cholestasis. None of the livers exhibited dysplasia or hepatocellular carcinoma. Corresponding with the hepatic steatosis, the livers with ALD had significantly increased levels of neutral lipids as demonstrated with the Nile Red assay (Control: 9.41 ± 1.23 (FLU/g), ethanol: 13.35 ± 1.45 (FLU/g), P = 0.03). In contrast, mean triglyceride content was similar in the ALD and control livers (Control: 24.89 ± 2.95 (μg/mg), ethanol: 24.38 ± 3.21 (μg/mg)).
3.2. Cytokine Activation in Chronic ALD (Table 2)
Table 2.
Effects of chronic ethanol exposure on proinflammatory cytokine levels in liver tissue.
| Control | Ethanol | P value | |
|---|---|---|---|
| Protein | |||
| LIF | 58.19 ± 3.02 | 51.27 ± 3.06 | |
| IL-10 | 18.20 ± 1.19 | 13.95 ± 0.97 | 0.008 |
| MCP-1 (CCL2) | 1793.48 ± 559.87 | 1123.61 ± 496.75 | 0.001 |
| HGF | 1305.97 ± 299.12 | 3887.81 ± 691.31 | 0.0001 |
| SCF | 30.14 ± 3.14 | 28.14 ± 1.29 | |
| SDF (CXCL12) | 79.25 ± 11.76 | 29.75 ± 2.76 | <0.0001 |
| VEGF | 195.74 ± 12.52 | 120.72 ± 9.74 | 0.0003 |
| PDGF | 111.52 ± 9.94 | 59.73 ± 4.69 | 0.0002 |
| IL-16 | 2769.95 ± 244.39 | 3058.46 ± 219.60 | |
| GM-CSF | 39.05 ± 1.29 | 33.54 ± 2.83 | |
| β-FGF | 948.78 ± 81.77 | 546.07 ± 46.79 | 0.0005 |
| IP-10 | 734.19 ± 479.61 | 398.13 ± 96.21 | |
| MIP-1 | 2279.33 ± 791.99 | 1177.78 ± 142.71 | |
| IL-18 | 365.60 ± 48.50 | 672.60 ± 218.45 | |
| β-NGF | 41.76 ± 4.26 | 48.60 ± 8.14 | |
| IL-8 | 806.30 ± 321.41 | 929.34 ± 185.10 | |
| IFN-γ | 6.66 ± 0.37 | 6.93 ± 0.55 | |
| IL-1β | 123.40 ± 44.97 | 34.23 ± 7.75 | 0.028 |
| IL-6 | 316.64 ± 108.93 | 126.60 ± 91.79 | 0.009 |
| TNF-α | 12.95 ± 1.03 | 15.93 ± 2.72 | |
| TRAIL | 61.14 ± 13.65 | 25.67 ± 2.84 | 0.01 |
|
| |||
| mRNA | |||
| IL-1β | 0.0254 ± 0.0098 | 0.0341 ± 0.0112 | ns |
| IL-6 | 0.0670 ± 0.027 | 0.2727 ± 0.1033 | 0.0376 |
| TNF-α | 0.0253 ± 0.005 | 0.04072 ± 0.010 | ns |
Liver protein homogenates were used to measure immunoreactivity of the indicated cytokines by multiplex ELISA. Immunoreactivity was normalized to protein concentration and data are expressed as mean ± SEM of fluorescence light units (arbitrary). mRNA was used to measure gene expression of TNF-α, IL-1β, and IL-6 via qRT-PCR. Results were normalized to ribosomal 18S levels measured in the same samples. Intergroup comparisons were made using t-test and significant P values are indicated in the right columns.
We used a 21-plex bead-based assay to measure proinflammatory cytokine and chemokine levels in relation to chronic ALD. Contrary to what might have been expected, chronic ALD was not associated with significantly increased levels of cytokines or chemokines in liver. Instead, the mean levels of proinflammatory cytokines IL-10, SDF-1α, MCP, IL-1β, IL-6 and TRAIL, and pro-fibrogenic cytokines VEGF, PDGF, and β-FGF were significantly lower in the chronic ALD relative to control livers. In contrast, the mean level of HGF, which is progrowth and antifibrogenic was significantly elevated in chronic ALD relative to control livers. However, qRT-PCR analysis demonstrated higher levels of IL-1β, IL-6, and TNF-α in the ethanol group, with significant intergroup differences obtained with respect to IL-6 (Table 2). A similar phenomenon was observed in experimental models of chronic ethanol feeding [11]. The discrepancies between mRNA and protein could be due to increased release of newly synthesized cytokines in the context of chronic ethanol exposure.
3.3. Chronic ALD Is Associated with Impaired Hepatic Insulin Signaling
The qRT-PCR analyses demonstrated significantly reduced levels of IGF-2 and IRS-4, and increased levels of insulin, IGF-1, and IGF-2 receptor mRNA transcripts in chronic ALD relative to control livers. In contrast, the mRNA levels of insulin and IGF-1 polypeptide genes were similar in the two groups (Figure 1). Multiplex ELISAs also demonstrated significantly higher levels of insulin and IGF-1 receptor expression, and significantly reduced levels of IRS-1 protein in the ALD group (Figure 2). Although tyrosine phosphorylated insulin receptor levels were also increased in the ALD group, the ratio of phosphorylated/total insulin receptor was similar to control. In contrast, relative phosphorylation of the IGF-1 receptor was significantly reduced in the ALD versus control livers. ALD was also associated with significantly increased levels of S312 phosphorylation of IRS-1. S312 phosphorylation of IRS-1 inhibits IRS-1 signaling [42].
Figure 1.
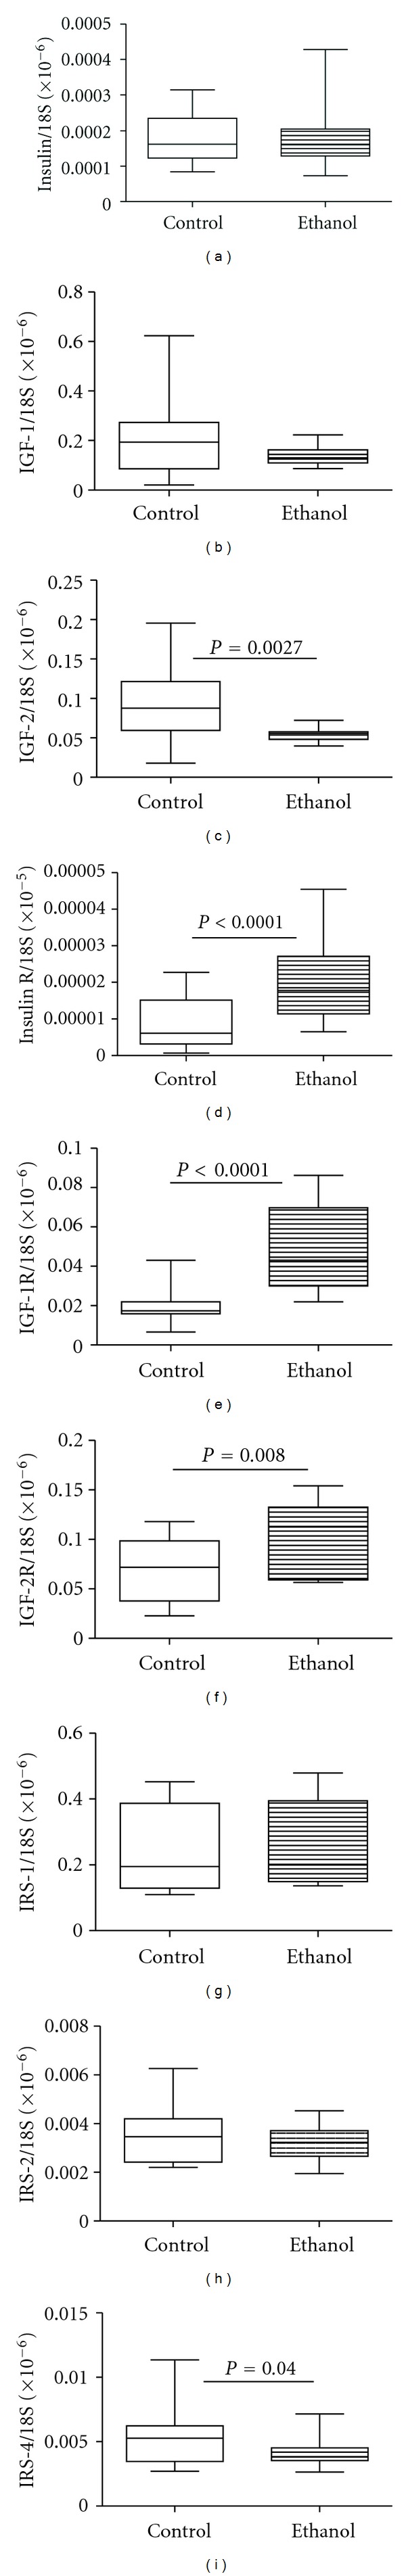
Effects of chronic ALD on hepatic expression of insulin/IGF ligands and receptors, and IRS genes. RNA extracted from livers of control and chronic ALD subjects (N = 8/group) was reverse transcribed, and the cDNAs were used to measure gene expression by qPCR analysis. Graphs depict relative mRNA levels for (a) insulin, (b) insulin-like growth factor (IGF-1), (c) IGF-2, (d) insulin receptor (R), (e) IGF-1 receptor (IGF-1R), (f) IGF-2R, (g) insulin receptor substrate-1 (IRS-1), (h) IRS-2, and (i) IRS-4. Intergroup comparisons were made using Student's t-tests. Significant P values are shown over the graphs.
Figure 2.
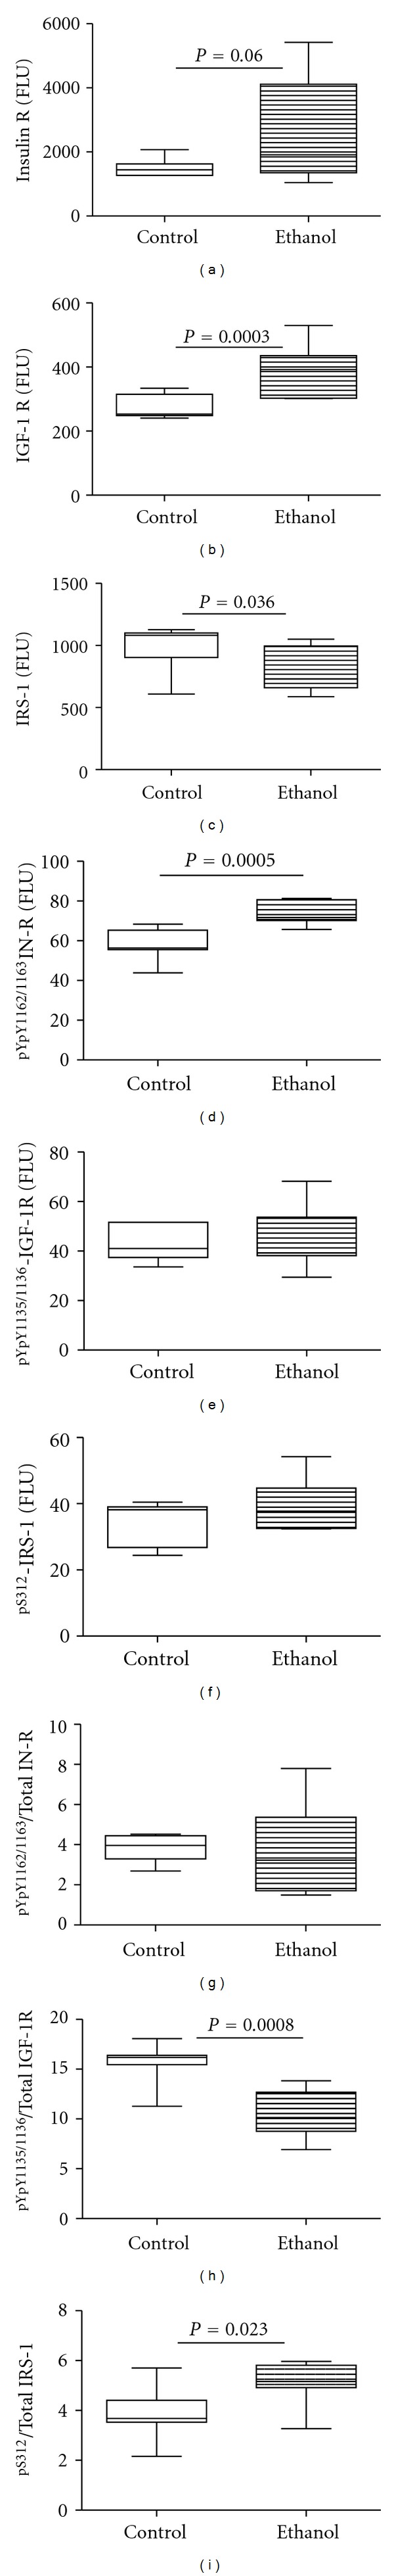
Effects of chronic ALD on insulin signaling mechanisms. Protein homogenates of liver were used in bead-based multiplex ELISAs to measure immunoreactivity corresponding to (a) insulin receptor (InR), (b) IGF-1 receptor (IGF-1R), (c) IRS-1, (d) pYpY1162/1163InR, (e) pYpY1135/1136IGF-1R, and (f) pS312IRS-1. Calculated phospho/total ratios of (g) InR, (h) IGF-1R, and (i) IRS-1 reflect relative levels of phosphorylation. Intergroup comparisons were made using Student's t-tests and significant P values are shown over the graphs.
Additional studies characterized the effects of chronic ALD on downstream signaling through Akt pathways. Chronic ALD was associated with significantly increased levels of total and phosphorylated AKT levels, but similar levels of phospho/total Akt relative to control. ALD was associated with significantly reduced levels of total GSK-3β, but significantly increased Ser9 phospho/total GSK-3β, reflecting reduced levels of GSK-3β activity. Correspondingly, we detected no significant effects of chronic ALD on the total, phosphorylated or phospho/total levels of proline-rich Akt substrate 40 kDa (PRAS 40) or p70S6 kinase, which mediate mTOR signaling (Table 3).
Table 3.
Effects of chronic ALD on the integrity of the Akt signaling pathway.
| Control | Ethanol | P value | |
|---|---|---|---|
| Protein (Total) | |||
| AKT | 18599.50 ± 744.87 | 22377.37 ± 478.47 | 0.0002 |
| GSK3β | 2295.38 ± 250.09 | 1604.090 ± 208.06 | 0.017 |
| PRAS40 | 462.13 ± 31.84 | 438.298 ± 15.13 | |
| P70S6K | 1204.38 ± 130.96 | 1258.14 ± 170.01 | |
|
| |||
| Protein (phospho) | |||
| pS473-Akt | 273.47 ± 720.05 | 252.78 ± 33.53 | |
| pS9-GSK3β | 612.40 ± 155.72 | 636.30 ± 46.82 | |
| pT246-PRAS40 | 65.65 ± 5.42 | 78.07 ± 7.37 | |
| pTpS421/424-p70S6K | 184.44 ± 23.30 | 114.32 ± 19.48 | |
|
| |||
| Protein (Phospho/Total) ∗ 100 | |||
| pS473-Akt/Akt | 1.43 ± 0.32 | 1.12 ± 0.14 | |
| pS9-GSK3β/GSK3β | 28.42 ± 5.12 | 44.02 ± 8.15 | 0.038 |
| pT246-PRAS40/PRAS40 | 14.29 ± 2.26 | 17.65 ± 1.46 | |
| pTpS421/424-p70S6K/p70S6K | 13.91 ± 4.14 | 9.01 ± 0.97 | |
Liver homogenates were used to measure immunoreactivity by multiplex ELISA. Phospho/total signaling protein levels were calculated. Immunoreactivity was normalized to protein concentration and data are expressed as mean ± SEM of fluorescence light units (arbitrary). Intergroup comparisons were made using t-tests. Significant P values are indicated in the right column.
3.4. Chronic ALD Is Associated with Increased Activation of Proceramide Mechanisms in Liver
Previous studies in experimental animal models demonstrated that steatohepatitis from various causes, including chronic ethanol exposure, is associated with increased proceramide gene expression and ceramide levels in liver [10, 11]. To determine if human chronic ALD exhibits the same abnormalities, we measured mRNA levels of proceramide genes corresponding to the de novo synthesis (Ceramide synthases 1, 2, 4, 5, 6, and the subunits 1 (regulatory) and 2 (catalytic) of serine palmitoyl transferase subunit (SPTLC1 and 2)), catabolic (sphingomyelin phosphodiesterases 1 and 3 (SMPD-1 and SMPD-3) and ceramidases (CERD)), and to biosynthesis of complex sphingolipids (ganglioside GM3 synthase and UDP-glucose ceramide glucosyltransferase (UGCG)) pathways by qRT-PCR analysis (Table 4). Chronic ALD was associated with significantly increased expression of CERS1, CERS5, CERS6, and SPTLC1, reflecting increased ceramide biosynthesis, increased mRNA levels of SMPD1 and SMPD3, corresponding to increased levels of sphingomyelin hydrolysis, and decreased expression of CERD2, an enzyme responsible for deacylation of ceramide to sphingosine and fatty acids. In addition, chronic ALD was associated with significantly increased levels of GM3 synthase and UGCG, which mediate formation of complex sphingolipids from ceramides. We also measured acidic, neutral, and alkaline sphingomyelinase activities using commercial assay reagents and found significantly higher levels of all three in ALD relative to control livers (Figure 3).
Table 4.
Effects of chronic ethanol consumption on hepatic expression of proceramide genes-biosynthetic pathways.
| Protein | Control | Ethanol | P value |
|---|---|---|---|
| CerS1 | 0.542 ± 0.162 | 1.145 ± 0.228 | 0.025 |
| CerS2 | 3634 ± 509.2 | 3982 ± 450 | |
| CerS4 | 160.2 ± 36.36 | 172.7 ± 22.86 | |
| CerS5 | 1.62 ± 0.22 | 3.62 ± 0.27 | <0.0001 |
| CerS6 | 15.70 ± 3.59 | 33.52 ± 5.48 | 0.0071 |
| SPTLC-1 | 121.4 ± 9.29 | 253.3 ± 26.26 | 0.0001 |
| SPTLC-2 | 2615 ± 444.8 | 3187 ± 309.5 | |
| SMPD-1 | 685.7 ± 133.9 | 1214 ± 244.8 | 0.036 |
| SMPD-3 | 765.4 ± 140.5 | 1353 ± 216.6 | 0.019 |
| CERD2 | 6.524 ± 2.439 | 1.887 ± 0.3439 | 0.04 |
| CERD3 | 5.583 ± 1.458 | 6.896 ± 1.853 | |
| UGCG | 282.6 ± 68.27 | 609.9 ± 174.5 | 0.0006 |
| GM3Syn | 56.21 ± 7.80 | 72.32 ± 6.981 | 0.006 |
RNA extracted from normal or chronic alcoholic livers (N = 8/group) was reverse transcribed, and the cDNAs were used to measure gene expression by qPCR analysis with gene-specific primer pairs in a duplex qPCR reaction, in which the genes of interest were co-amplified with HPRT for normalization (see Section 2 and Table 1). Table represents relative levels of gene expression for Ceramide synthases (CERS), UDP glucose ceramide glycosyltransferase (UGCG), ceramidases (CERD), GM3-synthase, serine palmitoyl transferase subunits (SPTLC), sphingomyelinases (SMPD). Intergroup comparisons were made using Student's t-tests and significant P values are shown over the graphs.
Figure 3.

Effects of chronic ALD on proceramide pathway activation in liver. Using a fluorogenic assay, (a) neutral, (b) acid, and (c) alkaline sphingomyelinase activities were measured in homogenates of liver from control or chronic ALD subjects. Hepatic ceramide profiles were measured in lipid extracts by LC/MS/MS. (d) CerC14:0, (e) CerC16:0, (f) CerC18:0, (g) CerC20:0, and (h) CerC24:0 levels are expressed as pg/mg protein. (i) Total ceramide immunoreactivity was measured by direct-binding ELISA. Intergroup comparisons were made using Student's t-tests and significant P values are shown over the graphs.
3.5. Chronic ALD Results in Increased Ceramide Levels and Altered Ceramide Profiles in Liver
We measured ceramide immunoreactivity in liver tissue homogenates by ELISA and quantified the levels of ceramides C14:0, C16:0, C18:0, C20:0, and C24:0 by LC-MS/MS (Figure 3). Livers from patients with chronic ALD were associated with significantly higher levels of ceramide immunoreactivity relative to controls. The LC-MS/MS studies demonstrated the most abundant ceramide species in control human livers were C18:0, followed by C16:0, and then C20:0 and the least abundant was C14:0. In the chronic ALD samples, the mean levels of C14:0, C16:0, C18:0, and C20:0 were significantly elevated relative to control, whereas the levels of C24:0 were similar for the two groups.
3.6. ER Stress in ALD
Steatohepatitis, ceramide accumulation, and insulin resistance can each contribute to the activation of ER stress pathways, and ER stress can promote oxidative injury and inflammation, which cause ALD to progress. To determine if chronic ALD in humans is associated with increased ER stress, we measured mRNA expression of multiple genes that mediate ER stress at various levels within the cascade [43]. Chronic ALD was associated with significant upregulation of the chaperone Bip/GRP78, the transcription factor ATF-4, the homocysteine-responsive endoplasmic reticulum-resident ubiquitin-like domain member 1 (HERP) and tryptophanyl-tRNA synthetase (WARS) (Figure 4). ER degradation-enhancing α-mannosidase-like 1 (EDEM) and protein kinase inhibitor p58 (P58IPK) mRNA transcripts were also elevated in the ALD group, but the intergroup differences failed to reach statistical significance due to the large within group variances. Finally, since sustained UPR activation drives pathological responses leading to apoptosis, we measured expression of BAX and the transcription factor CHOP, and both were found to be significantly elevated in chronic ALD.
Figure 4.
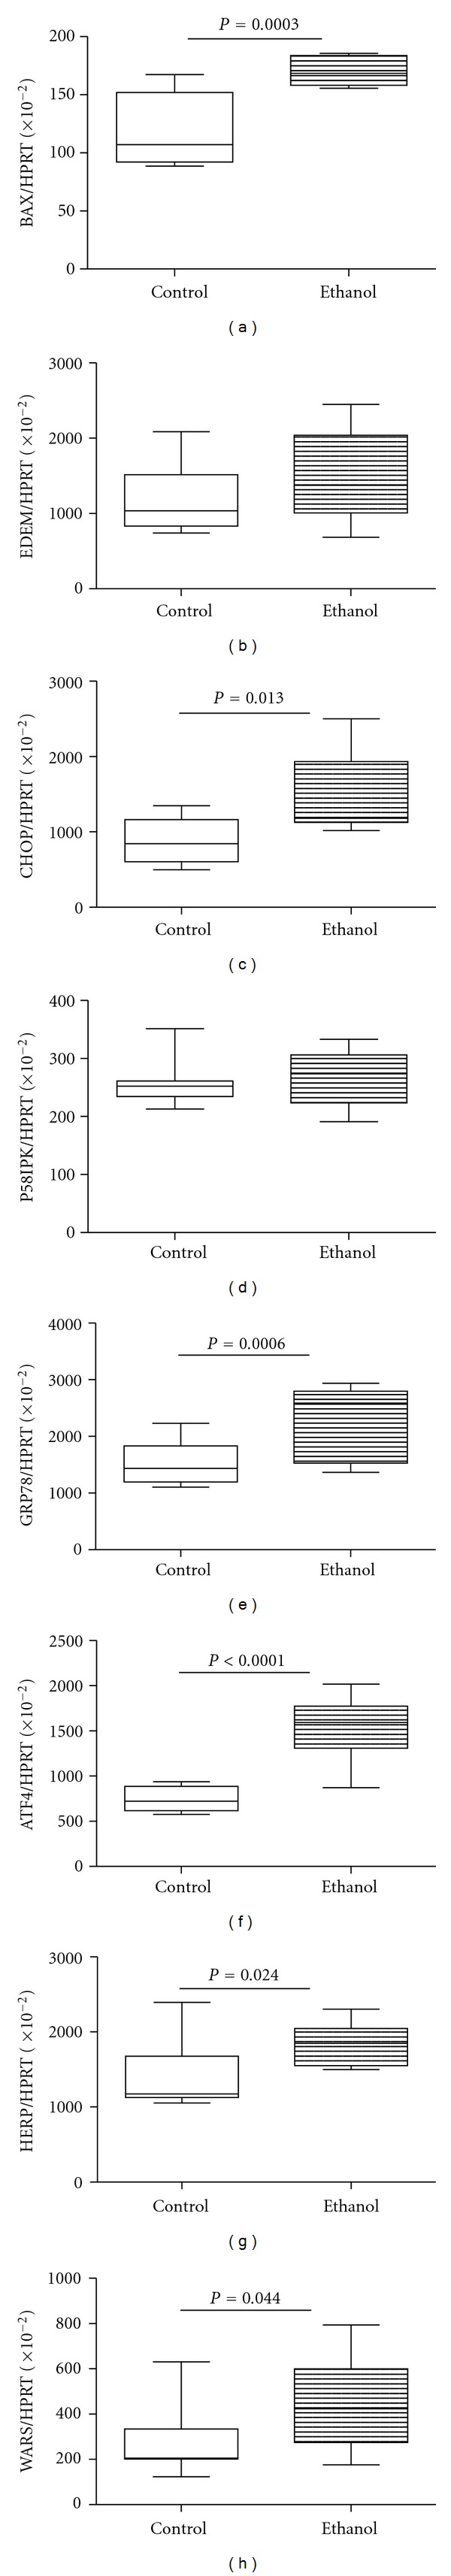
Effects of chronic ALD on hepatic ER stress gene activation. RNA extracted from livers of control and chronic ALD subjects (N = 8/group) was reverse transcribed, and the cDNAs were used to measure gene expression by duplex qPCR assays in which the gene of interest was coamplified with hypoxanthine-guanine phosphoribosyltransferase (HPRT) as control (see Section 2 and Table 1). Graphs depict relative levels of gene expression for (a) BAX, (b) ER degradation-enhancing α-mannosidase-like protein (EDEM), (c) C/EBP homologous protein (CHOP), (d) inhibitor of interferon-induced and double stranded RNA activated kinase (p58IPK), (e) glucose regulated protein 78 (GRP78), (f) activating transcription factor-4 (ATF-4), (g) homocysteine-responsive endoplasmic reticulum-resident ubiquitin-like domain member 1 (HERP), and (h) tryptophanyl-tRNA synthetase (WARS). Intergroup comparisons were made using Student's t-tests. Significant P values are shown over the graphs.
ELISAs were used to measure immunoreactivity to Bip/GRP78, CHOP, IRE-1α, calnexin, the oxidoreductase ERO1α, protein disulphur isomerase (PDI), PERK, phospho (Thr980) PERK, eIF2α, and phospho (Ser51) eIF2α. Chronic ALD was associated with significantly increased levels of Bip/GRP78, CHOP, IRE-1α, calnexin, ERO-1a, and PDI relative to control livers. In addition, the chronic ALD livers had significantly higher levels of PERK, p(Thr980)-PERK, and eIF2α relative control. In contrast, levels of phosphorylated eIF2α (Ser51) were similar for the two groups, while the relative level of phospho/total eIF2α was significantly reduced in the chronic ALD relative to control group (Figure 5). Further Western blot analyses confirmed that ER stress pathways through PERK, Bip/GRP78, and CHOP were upregulated in chronic alcoholic livers (see Supplementary Figure 1 in Supplementary Material available online at doi:10.1155/2012/479348).
Figure 5.

Chronic ALD results in increased hepatic ER stress. ER stress protein expression and phosphorylation were measured by ELISA using HRP-conjugated secondary antibody and Amplex UltraRed soluble fluorophore. Graphs depict immunoreactivity corresponding to (a) Bip/GRP78, (b) CHOP, (c) inositol requiring enzyme-1 (IRE-1), (d) calnexin, (e) endoplasmic oxidoreductin-1 (ERO-1), (f) protein disulphide isomerase (PDI), (g) PERK, (h) phospho PERK (Thr980), (i) eIF2-α, and (j) phospho eIF2-α (Ser51). Fluorescence was measured (Ex 530 nm/Em 590 nm) in a Spectramax M5 microplate reader (FLU = fluorescence light units). Intergroup comparisons were made by Student's t-test analysis. Significant P values are shown over the graphs.
4. Discussion
This study was designed to gain a better understanding of the molecular pathogenesis of chronic progressive ALD in humans by determining if the abnormalities detected were similar to those previously identified in experimental animal models. Therefore, we examined several interrelated aspects of liver injury including (1) histopathology; (2) integrity of insulin/IGF signaling through upstream and Akt downstream pathways; (3) activation of proinflammatory mediators; (4) ceramide production, accumulation, and profiles; (5) ER stress activation. Together, these approaches enabled us to characterize the nature and extent of hepatocellular dysfunction in human chronic progressive ALD. Moreover, the findings suggest that multipronged therapeutic strategies are needed to prevent or reduce ALD progression.
4.1. ALD Features
The histopathological studies demonstrated that all cases of chronic ALD included in this study had severe steatohepatitis with cirrhosis. As the livers were obtained from patients scheduled for liver transplantation, their clinical disease status was regarded as advanced. The presence of active steatohepatitis with conspicuous foci of apoptosis and necrosis indicates that the disease process was still progressing at the time of tissue sampling, thereby enabling us to determine the molecular and pathophysiological processes contributing to the ongoing liver injury and degeneration. The finding of reduced levels of proinflammatory cytokines/chemokines was unexpected vis-à-vis the histopathological features of chronic active ALD. However, these findings correspond with results in previous experimental models of chronic ethanol feeding [11, 44]. Similarly, given the extensive degree of fibrosis, the finding of reduced levels of pro-fibrogenic markers was not expected, but it may reflect a host compensatory effort to restore liver structure.
4.2. Role of Insulin Resistance/Impaired Insulin Signaling
Previous in vitro and experimental animal model studies demonstrated that short-term ethanol exposure or chronic ethanol feeding impairs insulin and IGF-1 signaling by inhibiting tyrosine phosphorylation of the insulin and IGF-1 receptors, and IRS-1 [45–50]. Impaired signaling through insulin and IGF-1 receptors was shown to be associated with reduced ligand-receptor binding and compensatory upregulation of the receptors, both at mRNA and protein levels [46, 48]. These effects correlated with inhibition of downstream signaling through Ras/Raf/Erk MAPK [45, 47, 49, 50], reduced DNA synthesis, and impaired capacity for the liver to regenerate following partial hepatectomy [48, 51]. In addition, the associated reduced transmission of signals downstream through the PI3K-Akt pathway increased apoptosis, DNA damage, mitochondrial dysfunction, and oxidative stress [46, 48, 52, 53].
The significantly increased levels of the insulin, IGF-1 and IGF-2 receptor expression in human cases of chronic ALD reflect insulin/IGF resistance. Correspondingly, the ratio of phosphorylated/total IGF-1 receptor was significantly reduced, confirming that chronic ALD impairs signaling through hepatic IGF-1 receptors in humans. Moreover, the significantly reduced expression of IGF-2 polypeptide in chronic ALD indicates that IGF-2 signaling was also impaired, but due to the combined effects of trophic factor deficiency and receptor resistance. The finding that IRS-1 and IRS-4 expressions were significantly reduced in chronic ALD indicates that insulin/IGF receptor signaling was further impaired by reduced capacity to transmit signals downstream through IRS docking proteins. An additional abnormality contributing to hepatic insulin/IGF resistance in human chronic ALD was the significantly increased levels of S312 phosphorylation of IRS-1; S312 phosphorylation inhibits IRS-1 signaling [42]. This is the first study to demonstrate impairments in insulin/IGF/IRS signaling in human chronic ALD. However, earlier studies in which mainly peripheral blood and leukocytes were available for study showed that patients with alcoholic cirrhosis had peripheral insulin resistance [54–59] with binding and postbinding defects in insulin target organ cells [54, 55, 59]. Moreover, analysis of brains from human alcoholics demonstrated chronic insulin resistance in structural targets of alcohol-induced neurodegeneration [37]. Therefore, these earlier studies provide evidence that ethanol-induced insulin resistance is a multisystem disease that is somehow linked to chronic progressive liver disease. The question is, “what is the mechanism?”
To examine the effects of impaired insulin/IGF/IRS signaling through the downstream Akt pathway, we used multiplex ELISAs to measure total and phosphorylated levels of Akt, GSK-3β, PRAS40, and p70S6K. In contrast to the findings in experimental animals in which impairments in insulin/IGF/IRS signaling were associated with reduced AKT and increased GSK-3β activation [48], human chronic ALD was not associated with significant impairments in signaling through survival or metabolic pathways. Instead, the findings of increased Akt and phospho-Akt, but similar phospho/total Akt relative control, and reduced total GSK-3β, phospho-Ser9/GSK-3β, and phospho-Ser9/total GSK-3β indicate that Akt activation was preserved while GSK-3β was relatively inhibited. Therefore, survival and metabolic signaling through the Akt pathway were found to be intact in human chronic ALD. Similarly, activation of the mTOR networks via p70S6k and PRAS40 was intact. The discrepancy between the impairments in upstream signaling through insulin/IGF/IRS and intact downstream signaling could be explained by the fact that other signaling mechanisms, including those mediated by hepatocyte growth factor or epidermal growth factor, can also activate Akt pathways independent of IRS-dependent networks [60, 61]. Future studies will characterize the mechanisms by which prosurvival and prometabolic signaling are maintained vis-à-vis chronic ALD-induced inhibition of insulin/IGF/IRS pathways.
4.3. Role of Ceramides in Chronic ALD
Although hepatic steatosis is generally regarded as benign and reversible, persistent injury and inflammation can cause steatohepatitis to become chronic and progressive. Two factors that probably contribute to ALD progression include (1) aberrant shifts in membrane lipid composition leading to disrupted intracellular signaling [29, 62, 63]; (2) the accumulation of toxic lipids that mediate cellular pathology via increased oxidative stress, ROS generation, adduct formation, and ER stress. Growth in our understanding of how abnormal accumulation and composition of lipids contribute to chronic insulin resistance diseases has been furthered by modern lipidomic approaches. For example, besides the histopathological differences, nonalcoholic steatohepatitis (NASH) is distinguished from nonalcoholic fatty liver disease (NAFLD) based on the composition of lipids accumulated in hepatocytes [64].
Diacylglycerol (DAG), free fatty acids, free cholesterol, and ceramides can all have lipotoxic effects in hepatocytes [31, 65, 66]. However, we focused our studies on the potential contributions of ceramides in chronic ALD because (1) ceramides have demonstrated roles in the pathogenesis of steatohepatitis in experimental models of chronic ethanol or high-fat diet feeding [10, 11]; (2) ceramides can promote insulin resistance, inflammation, and oxidative stress in various insulin resistance disease states [67–69], including Type 2 diabetes and obesity [70–72]; (3) ceramides impair Akt/PKB signaling through activation of protein phosphatase 2A (PP2A) which dephosphorylates Akt [18, 73] and inhibition of protein-kinase-C-ζ- (PKC-ζ-) dependent translocation of Akt to the plasma membrane, which is required for its function [22]. Although the Akt pathway was not inhibited in human chronic ALD, taken in the context of the impairments detected in experimental models, it is possible that the abnormality does occur in the earlier and less severe stages of ALD, but compensatory mechanisms restore these functions via activation of other signaling networks, for example, those driven by EGF or HGF. As demonstrated with the multiplex array analysis, HGF expression was strikingly increased in chronic ALD relative to control livers.
Corresponding with the findings in experimental models of alcohol- and high-fat-diet-induced steatohepatitis, human livers with severe chronic ALD had significantly increased expression of multiple proceramide genes as well as increased levels of ceramide immunoreactivity. The robustness and significance of this response are underscored by the constitutive upregulation of proceramide genes in the biosynthetic, catabolic, and salvage pathways, as well as increased activation of acidic and neutral sphingomyelinases. Mechanistically, insulin resistance promotes lipolysis, and increased lipolysis results in the breakdown (hydrolysis) of complex lipids, thereby promoting increased levels of ceramide. In addition, ceramides can be generated via the salvage pathway due to increased levels of precursor lipids. Conceivably, the pathogenic signaling that activates lipolysis vis-à-vis chronic steatohepatitis may also initiate proceramide cascades by increasing gene expression and enzymatic activity. The increased levels of ceramide synthase gene expression could be explained by increased fatty acid load that characteristically occurs with steatohepatitis, irrespective of etiology [10, 11, 74].
We extended our analyses by characterizing the ceramide profiles in liver tissue using LC-MS/MS. The rationale was that (1) ceramides associated with specific fatty acids can have diverse biological functions and can be generated in response to diverse stimuli [75, 76]; (2) intracellular partitioning of fatty acids and their metabolites plays a role in mediating insulin resistance and lipotoxicity [77]. Coupling liquid chromatography with tandem mass spectrometry enabled us to identify the different ceramide species in liver based on retention time and specific mass transition using synthetic reference standards [78].
The LC/MS/MS studies demonstrated that the ceramide profiles in chronic ALD differed significantly from those in control livers due to the relatively higher levels of C14:0, C16:0, C18:0, and C20:0. Previously it was shown that increased levels of C16:0, and also C24:0 ceramides could promote cell death [79, 80], while C18:0 ceramide inhibits cell growth [81]. Therefore, the ongoing cell death associated with chronic progressive ALD in humans could be mediated in part by increased levels of C16:0 ceramide. Mechanistically, CERS1 has a high specificity for C18:0-CoA generating C18:0-ceramide, and CERS2 and CERS4 mainly synthesize C20:0-, C22:0-, C24:1-, C24:0-, C26:1-, and C26:0-ceramide. In contrast, shorter chain ceramides like C14:0, C16:0 are primarily generated by CerS5 and CerS6 [76]. The qRT-PCR analyses demonstrated significantly higher levels of CERS1, CERS5, and CERS6 in human chronic ALD, which could partly account for the associated shifts in hepatic ceramide profiles. As the field of lipidomics grows, our ability to interpret these types of results in relation to disease pathogenesis, including insulin resistance, lipotoxicity, and inflammation will improve. In addition, we may arrive at the point where targeting specific proceramide mediators can be used to therapeutically modulate ceramide membrane composition.
4.4. ER Stress in Progressive ALD
Insulin resistance, inflammation, and ceramide accumulation can promote ER stress, and ER stress exacerbates insulin resistance, inflammation, oxidative stress, and ceramide accumulation [35, 82–88]. Moreover, ethanol exposure in experimental animal models leads to increased activation of ER stress responses in liver [36, 89, 90]. The studies herein demonstrate that in human chronic progressive ALD, ER stress signaling is strikingly upregulated via multiple mechanisms including (1) Bip/GRP78, which is an important chaperone protein; (2) IRE-1α, which activates JNK; (3) PERK, which promotes global arrest of protein synthesis, translation of ATF4, and upregulation of CHOP; (4) CHOP, which activates caspases and inhibits Bcl2 prosurvival function by activating BAX. The increased levels of ATF-4 in chronic ALD correspond with the significantly higher levels of chaperones and other components of the folding and ERAD machinery, that is, PDI and GRP78. In addition, chronic ALD was found to be associated with significantly increased expression of calnexin and ERO-1a. Calnexin binds glycosylated proteins after they pass into the ER, while ERO1 and BAX are activated by CHOP. Therefore, consequences of constitutive activation of the UPR in chronic ALD progression include (1) increased apoptosis via CHOP [91]; (2) disruption of calcium and redox homeostasis [34]; (3) further dysregulation of lipid homeostasis [92] leading to enhanced production of cholesterol and triglycerides via activation of the transcription factor SREBP.
5. Summary and Conclusions
Human chronic progressive ALD is associated with impaired insulin and IGF signaling through insulin/IGF receptors, IRS-1, and IRS-4. However, downstream signaling through Akt pathways were found intact, probably due to compensatory adaptive responses such as signaling through other receptors such as EGF or HGF. In contrast to the histopathological findings, chronic ALD was not associated with increased activation of proinflammatory cytokines or chemokines or profibrogenic markers. The most striking abnormalities in human livers with advanced chronic ALD were prominent activation of proceramide mechanisms with ceramide accumulation and altered ceramide profiles, and increased activation of the UPR via several pathways and at multiple levels of the network. The aberrant shifts in ceramide profiles could have contributed to the insulin resistance and continued activation of prodeath mechanisms. At the late stages of disease examined, it is not possible to designate any single mechanism as the cause of ALD progression. However, the findings in experimental animal models suggest that one of the earliest abnormalities in chronic steatohepatitis is insulin resistance. We hypothesize that once steatohepatitis becomes sufficiently severe and long-standing, hepatic insulin resistance mechanisms with activation of mal-signaling cascades become initiated whereby lipolysis leads to increased ceramide generation and accumulation in membranes including the ER and plasma membrane. Ceramide accumulation in the ER promotes ER stress, and ceramide incorporation into lipid rafts exacerbates insulin resistance, inflammation, oxidative stress, and proapoptosis signaling. Increased oxidative stress leads to ROS formation, lipid peroxidation, DNA damage, and cell death. Altogether, the findings herein suggest that therapeutic prevention or reduction of ALD progression requires multipronged strategies to reverse or stabilize the consequences of hepatic insulin resistance and dysregulated lipid metabolism.
Supplementary Material
Supplementary Figure 1 depicts Western blot analysis results corresponding to pPERK, PERK, GRP78/Bip, CHOP, and p85 (control) expression in livers from human control and chronic alcoholic subjects.
Authors' Contribution
L. Longato, K. Ripp, and M. Setshedi contributed equally to this paper.
Acknowledgment
This work is supported by AA-11431, AA-12908, and AA-16126 from the National Institutes of Health.
References
- 1.Miller AM, Horiguchi N, Jeong W-I, Radaeva S, Gao B. Molecular mechanisms of alcoholic liver disease: innate immunity and cytokines. Alcoholism. 2011;35(5):787–793. doi: 10.1111/j.1530-0277.2010.01399.x. [DOI] [PMC free article] [PubMed] [Google Scholar]
- 2.Oshea RS, Dasarathy S, McCullough AJ. Alcoholic liver disease. American Journal of Gastroenterology. 2010;105(1):14–32. doi: 10.1038/ajg.2009.593. [DOI] [PubMed] [Google Scholar]
- 3.Purohit V, Gao B, Song BJ. Molecular mechanisms of alcoholic fatty liver. Alcoholism. 2009;33(2):191–205. doi: 10.1111/j.1530-0277.2008.00827.x. [DOI] [PMC free article] [PubMed] [Google Scholar]
- 4.Gao B, Seki E, Brenner DA, et al. Innate immunity in alcoholic liver disease. American Journal of Physiology. 2011;300(4):G516–G525. doi: 10.1152/ajpgi.00537.2010. [DOI] [PMC free article] [PubMed] [Google Scholar]
- 5.Lieber CS. Alcoholic fatty liver: its pathogenesis and mechanism of progression to inflammation and fibrosis. Alcohol. 2004;34(1):9–19. doi: 10.1016/j.alcohol.2004.07.008. [DOI] [PubMed] [Google Scholar]
- 6.Seth D, Haber PS, Syn W-K, Diehl AM, Day CP. Pathogenesis of alcohol-induced liver disease: classical concepts and recent advances. Journal of Gastroenterology and Hepatology. 2011;26(7):1089–1105. doi: 10.1111/j.1440-1746.2011.06756.x. [DOI] [PubMed] [Google Scholar]
- 7.Setshedi M, Wands JR, De La Monte SM. Acetaldehyde adducts in alcoholic liver disease. Oxidative Medicine and Cellular Longevity. 2010;3(3):178–185. doi: 10.4161/oxim.3.3.3. [DOI] [PMC free article] [PubMed] [Google Scholar]
- 8.Friedman SL. Mechanisms of hepatic fibrogenesis. Gastroenterology. 2008;134(6):1655–1669. doi: 10.1053/j.gastro.2008.03.003. [DOI] [PMC free article] [PubMed] [Google Scholar]
- 9.De La Monte SM, Longato L, Tong M, Denucci S, Wands JR. The liver-brain axis of alcohol-mediated neurodegeneration: role of toxic lipids. International Journal of Environmental Research and Public Health. 2009;6(7):2055–2075. doi: 10.3390/ijerph6072055. [DOI] [PMC free article] [PubMed] [Google Scholar]
- 10.Lyn-Cook LE, Lawton M, Tong M, et al. Hepatic ceramide may mediate brain insulin resistance and neurodegeneration in type 2 diabetes and non-alcoholic steatohepatitis. Journal of Alzheimer’s Disease. 2009;16(4):715–729. doi: 10.3233/JAD-2009-0984. [DOI] [PMC free article] [PubMed] [Google Scholar]
- 11.Setshedi M, Longato L, Petersen DR, et al. Limited therapeutic effect of N-acetylcysteine on hepatic insulin resistance in an experimental model of alcohol-induced steatohepatitis. Alcoholism. 2011;35(12):2139–2151. doi: 10.1111/j.1530-0277.2011.01569.x. [DOI] [PMC free article] [PubMed] [Google Scholar]
- 12.Holland WL, Summers SA. Sphingolipids, insulin resistance, and metabolic disease: new insights from in vivo manipulation of sphingolipid metabolism. Endocrine Reviews. 2008;29(4):381–402. doi: 10.1210/er.2007-0025. [DOI] [PMC free article] [PubMed] [Google Scholar]
- 13.Summers SA. Ceramides in insulin resistance and lipotoxicity. Progress in Lipid Research. 2006;45(1):42–72. doi: 10.1016/j.plipres.2005.11.002. [DOI] [PubMed] [Google Scholar]
- 14.Liu B, et al. Sphingomyelinases in cell regulation. Seminars in Cell & Developmental Biology. 1997;8:311–322. doi: 10.1006/scdb.1997.0153. [DOI] [PubMed] [Google Scholar]
- 15.Reynolds CP, Maurer BJ, Kolesnick RN. Ceramide synthesis and metabolism as a target for cancer therapy. Cancer Letters. 2004;206(2):169–180. doi: 10.1016/j.canlet.2003.08.034. [DOI] [PubMed] [Google Scholar]
- 16.Cowart LA. Sphingolipids: players in the pathology of metabolic disease. Trends in Endocrinology and Metabolism. 2009;20(1):34–42. doi: 10.1016/j.tem.2008.09.004. [DOI] [PubMed] [Google Scholar]
- 17.Hannun YA, Obeid LM. Principles of bioactive lipid signalling: lessons from sphingolipids. Nature Reviews Molecular Cell Biology. 2008;9(2):139–150. doi: 10.1038/nrm2329. [DOI] [PubMed] [Google Scholar]
- 18.Ruvolo PP. Intracellular signal transduction pathways activated by ceramide and its metabolites. Pharmacological Research. 2003;47(5):383–392. doi: 10.1016/s1043-6618(03)00050-1. [DOI] [PubMed] [Google Scholar]
- 19.Bourbon NA, Sandirasegarane L, Kester M. Ceramide-induced inhibition of Akt is mediated through protein kinase Cζ. Implications for growth arrest. Journal of Biological Chemistry. 2002;277(5):3286–3292. doi: 10.1074/jbc.M110541200. [DOI] [PubMed] [Google Scholar]
- 20.Hajduch E, Balendran A, Batty IH, et al. Ceramide impairs the insulin-dependent membrane recruitment of protein kinase B leading to a loss in downstream signalling in L6 skeletal muscle cells. Diabetologia. 2001;44(2):173–183. doi: 10.1007/s001250051596. [DOI] [PubMed] [Google Scholar]
- 21.Nogueira TCA, Anhê GF, Carvalho CRO, Curi R, Bordin S, Carpinelli AR. Involvement of phosphatidylinositol-3 kinase/AKT/PKCζ/λ pathway in the effect of palmitate on glucose-induced insulin secretion. Pancreas. 2008;37(3):309–315. doi: 10.1097/mpa.0b013e318168dac3. [DOI] [PubMed] [Google Scholar]
- 22.Powell DJ, Hajduch E, Kular G, Hundal HS. Ceramide disables 3-phosphoinositide binding to the pleckstrin homology domain of protein kinase B (PKB)/Akt by a PKCζ-dependent mechanism. Molecular and Cellular Biology. 2003;23(21):7794–7808. doi: 10.1128/MCB.23.21.7794-7808.2003. [DOI] [PMC free article] [PubMed] [Google Scholar]
- 23.Chavez JA, Knotts TA, Wang LP, et al. A role for ceramide, but not diacylglycerol, in the antagonism of insulin signal transduction by saturated fatty acids. Journal of Biological Chemistry. 2003;278(12):10297–10303. doi: 10.1074/jbc.M212307200. [DOI] [PubMed] [Google Scholar]
- 24.Stratford S, Hoehn KL, Liu F, Summers SA. Regulation of insulin action by ceramide: dual mechanisms linking ceramide accumulation to the inhibition of Akt/protein kinase B. Journal of Biological Chemistry. 2004;279(35):36608–36615. doi: 10.1074/jbc.M406499200. [DOI] [PubMed] [Google Scholar]
- 25.Deaciuc IV, Nikolova-Karakashian M, Fortunato F, Lee EY, Hill DB, McClain CJ. Apoptosis and dysregulated ceramide metabolism in a murine model of alcohol-enhanced lipopolysaccharide hepatotoxicity. Alcoholism. 2000;24(10):1557–1565. [PubMed] [Google Scholar]
- 26.Viktorov AV, Yurkiv VA. Effects of ethanol and lipopolysaccharide on the sphingomyelin cycle in rat hepatocytes. Bulletin of Experimental Biology and Medicine. 2008;146(6):753–755. doi: 10.1007/s10517-009-0379-4. [DOI] [PubMed] [Google Scholar]
- 27.García-Ruiz C, Colell A, Mari M, et al. Defective TNF-α-mediated hepatocellular apoptosis and liver damage in acidic sphingomyelinase knockout mice. Journal of Clinical Investigation. 2003;111(2):197–208. doi: 10.1172/JCI16010. [DOI] [PMC free article] [PubMed] [Google Scholar]
- 28.Liangpunsakul S, Sozio MS, Shin E, et al. Inhibitory effect of ethanol on AMPK phosphorylation is mediated in part through elevated ceramide levels. American Journal of Physiology. 2010;298(6):G1004–G1012. doi: 10.1152/ajpgi.00482.2009. [DOI] [PMC free article] [PubMed] [Google Scholar]
- 29.Anderson N, Borlak J. Molecular mechanisms and therapeutic targets in steatosis and steatohepatitis. Pharmacological Reviews. 2008;60(3):311–357. doi: 10.1124/pr.108.00001. [DOI] [PubMed] [Google Scholar]
- 30.Kaplowitz N, Tin AT, Shinohara M, Ji C. Endoplasmic reticulum stress and liver injury. Seminars in Liver Disease. 2007;27(4):367–377. doi: 10.1055/s-2007-991513. [DOI] [PubMed] [Google Scholar]
- 31.Malhi H, Gores GJ. Molecular mechanisms of lipotoxicity in nonalcoholic fatty liver disease. Seminars in Liver Disease. 2008;28(4):360–369. doi: 10.1055/s-0028-1091980. [DOI] [PMC free article] [PubMed] [Google Scholar]
- 32.Rajan SS, Srinivasan V, Balasubramanyam M, Tatu U. Endoplasmic reticulum (ER) stress & diabetes. Indian Journal of Medical Research. 2007;125(3):411–424. [PubMed] [Google Scholar]
- 33.Hotamisligil GS. Endoplasmic reticulum stress and the inflammatory basis of metabolic disease. Cell. 2010;140(6):900–917. doi: 10.1016/j.cell.2010.02.034. [DOI] [PMC free article] [PubMed] [Google Scholar]
- 34.Malhi H, Kaufman RJ. Endoplasmic reticulum stress in liver disease. Journal of Hepatology. 2011;54(4):795–809. doi: 10.1016/j.jhep.2010.11.005. [DOI] [PMC free article] [PubMed] [Google Scholar]
- 35.Özcan U, Cao Q, Yilmaz E, et al. Endoplasmic reticulum stress links obesity, insulin action, and type 2 diabetes. Science. 2004;306(5695):457–461. doi: 10.1126/science.1103160. [DOI] [PubMed] [Google Scholar]
- 36.Dara L, et al. The contribution of endoplasmic reticulum stress to liver diseases. Hepatology. 2011;53:1752–1763. doi: 10.1002/hep.24279. [DOI] [PMC free article] [PubMed] [Google Scholar]
- 37.De La Monte SM, Tong M, Cohen AC, Sheedy D, Harper C, Wands JR. Insulin and insulin-like growth factor resistance in alcoholic neurodegeneration. Alcoholism. 2008;32(9):1630–1644. doi: 10.1111/j.1530-0277.2008.00731.x. [DOI] [PMC free article] [PubMed] [Google Scholar]
- 38.Moroz N, Tong M, Longato L, Xu H, De La Monte SM. Limited Alzheimer-type neurodegeneration in experimental obesity and type 2 diabetes mellitus. Journal of Alzheimer’s Disease. 2008;15(1):29–44. doi: 10.3233/jad-2008-15103. [DOI] [PMC free article] [PubMed] [Google Scholar]
- 39.De La Monte SM, Tong M, Nguyen V, Setshedi M, Longato L, Wands JR. Ceramide-mediated insulin resistance and impairment of cognitive-motor functions. Journal of Alzheimer’s Disease. 2010;21(3):967–984. doi: 10.3233/JAD-2010-091726. [DOI] [PMC free article] [PubMed] [Google Scholar]
- 40.Bielawski J, Pierce JS, Snider J, Rembiesa B, Szulc ZM, Bielawska A. Comprehensive quantitative analysis of bioactive sphingolipids by high-performance liquid chromatography-tandem mass spectrometry. Methods in Molecular Biology. 2009;579:443–467. doi: 10.1007/978-1-60761-322-0_22. [DOI] [PubMed] [Google Scholar]
- 41.Bielawski J, Szulc ZM, Hannun YA, Bielawska A. Simultaneous quantitative analysis of bioactive sphingolipids by high-performance liquid chromatography-tandem mass spectrometry. Methods. 2006;39(2):82–91. doi: 10.1016/j.ymeth.2006.05.004. [DOI] [PubMed] [Google Scholar]
- 42.Aguirre V, Werner ED, Giraud J, Lee YH, Shoelson SE, White MF. Phosphorylation of Ser307 in insulin receptor substrate-1 blocks interactions with the insulin receptor and inhibits insulin action. Journal of Biological Chemistry. 2002;277(2):1531–1537. doi: 10.1074/jbc.M101521200. [DOI] [PubMed] [Google Scholar]
- 43.Gupta S, Samali A, Fitzgerald U, Deegan S. Methods for monitoring endoplasmic reticulum stress and the unfolded protein response. International Journal of Cell Biology. 2010;2010:11 pages. doi: 10.1155/2010/830307. Article ID 830307. [DOI] [PMC free article] [PubMed] [Google Scholar]
- 44.De La Monte SM, Denucci SM, Tong M, et al. Rat strain differences in susceptibility to alcohol-induced chronic liver injury and hepatic insulin resistance. Gastroenterology Research and Practice. 2010;2010:16 pages. doi: 10.1155/2010/312790. Article ID 312790. [DOI] [PMC free article] [PubMed] [Google Scholar]
- 45.Banerjee K, Mohr L, Wands JR, De La Monte SM. Ethanol inhibition of insulin signaling in hepatocellular carcinoma cells. Alcoholism. 1998;22(9):2093–2101. [PubMed] [Google Scholar]
- 46.De La Monte SM, Yeon JE, Tong M, et al. Insulin resistance in experimental alcohol-induced liver disease. Journal of Gastroenterology and Hepatology. 2008;23(8):e477–e486. doi: 10.1111/j.1440-1746.2008.05339.x. [DOI] [PMC free article] [PubMed] [Google Scholar]
- 47.Mohr L, Tanaka S, Wands JR. Ethanol inhibits hepatocyte proliferation in insulin receptor substrate 1 transgenic mice. Gastroenterology. 1998;115(6):1558–1565. doi: 10.1016/s0016-5085(98)70036-8. [DOI] [PubMed] [Google Scholar]
- 48.Pang M, de la Monte SM, Longato L, et al. PPARδ agonist attenuates alcohol-induced hepatic insulin resistance and improves liver injury and repair. Journal of Hepatology. 2009;50(6):1192–1201. doi: 10.1016/j.jhep.2009.01.021. [DOI] [PMC free article] [PubMed] [Google Scholar]
- 49.Sasaki Y, Hayashi N, Ito T, Fusamoto H, Kamada T, Wands JR. Influence of ethanol on insulin receptor substrate-1-mediated signal transduction during rat liver regeneration. Alcohol and Alcoholism. 1994;29(1, supplement):99–106. [PubMed] [Google Scholar]
- 50.Sasaki Y, Wands JR. Ethanol impairs insulin receptor substrate-1 mediated signal transduction during rat liver regeneration. Biochemical and Biophysical Research Communications. 1994;199(1):403–409. doi: 10.1006/bbrc.1994.1243. [DOI] [PubMed] [Google Scholar]
- 51.Wands JR, Carter EA, Bucher NLR, Isselbacher KJ. Inhibition of hepatic regeneration in rats by acute and chronic ethanol intoxication. Gastroenterology. 1979;77(3):528–531. [PubMed] [Google Scholar]
- 52.Ronis MJJ, Wands JR, Badger TM, De La Monte SM, Lang CH, Calissendorff J. Alcohol-induced disruption of endocrine signaling. Alcoholism. 2007;31(8):1269–1285. doi: 10.1111/j.1530-0277.2007.00436.x. [DOI] [PubMed] [Google Scholar]
- 53.Yeon JE, Califano S, Xu J, Wands JR, De La Monte SM. Potential role of PTEN phosphatase in ethanol-impaired survival signaling in the liver. Hepatology. 2003;38(3):703–714. doi: 10.1053/jhep.2003.50368. [DOI] [PubMed] [Google Scholar]
- 54.Blei AT, Robbins DC, Drobny E. Insulin resistance and insulin receptors in hepatic cirrhosis. Gastroenterology. 1982;83(6):1191–1199. [PubMed] [Google Scholar]
- 55.Iversen J, Vilstrup H, Tygstrup N. Kinetics of glucose metabolism in relation to insulin concentrations in patients with alcoholic cirrhosis and in healthy persons. Gastroenterology. 1984;87(5):1138–1143. [PubMed] [Google Scholar]
- 56.Kruszynska YT, Home PD, McIntyre N. Relationship between insulin sensitivity, insulin secretion and glucose tolerance in cirrhosis. Hepatology. 1991;14(1):103–111. doi: 10.1002/hep.1840140117. [DOI] [PubMed] [Google Scholar]
- 57.Muller MJ, Willmann O, Rieger A, et al. Mechanism of insulin resistance associated with liver cirrhosis. Gastroenterology. 1992;102(6):2033–2041. doi: 10.1016/0016-5085(92)90329-w. [DOI] [PubMed] [Google Scholar]
- 58.Sotaniemi EA, Keinanen K, Lahtela JT. Carbohydrate intolerance associated with reduced hepatic glucose phosphorylating and releasing enzyme activities and peripheral insulin resistance in alcoholics with liver cirrhosis. Journal of Hepatology. 1985;1(3):277–290. doi: 10.1016/s0168-8278(85)80055-6. [DOI] [PubMed] [Google Scholar]
- 59.Taylor R, Heine RJ, Collins J. Insulin action in cirrhosis. Hepatology. 1985;5(1):64–71. doi: 10.1002/hep.1840050115. [DOI] [PubMed] [Google Scholar]
- 60.Ponzetto C, Bardelli A, Zhen Z, et al. A multifunctional docking site mediates signaling and transformation by the hepatocyte growth factor/scatter factor receptor family. Cell. 1994;77(2):261–271. doi: 10.1016/0092-8674(94)90318-2. [DOI] [PubMed] [Google Scholar]
- 61.Trusolino L, Bertotti A, Comoglio PM. MET signalling: principles and functions in development, organ regeneration and cancer. Nature Reviews Molecular Cell Biology. 2010;11(12):834–848. doi: 10.1038/nrm3012. [DOI] [PubMed] [Google Scholar]
- 62.Ikonen E, Vainio S. Lipid microdomains and insulin resistance: is there a connection? Science’s STKE. 2005;2005(268):p. pe3. doi: 10.1126/stke.2682005pe3. [DOI] [PubMed] [Google Scholar]
- 63.Inokuchi JI. Membrane microdomains and insulin resistance. FEBS Letters. 2010;584(9):1864–1871. doi: 10.1016/j.febslet.2009.10.012. [DOI] [PubMed] [Google Scholar]
- 64.Puri P, Baillie RA, Wiest MM, et al. A lipidomic analysis of nonalcoholic fatty liver disease. Hepatology. 2007;46(4):1081–1090. doi: 10.1002/hep.21763. [DOI] [PubMed] [Google Scholar]
- 65.Alkhouri N, Dixon LJ, Feldstein AE. Lipotoxicity in nonalcoholic fatty liver disease: not all lipids are created equal. Expert Review of Gastroenterology and Hepatology. 2009;3(4):445–451. doi: 10.1586/egh.09.32. [DOI] [PMC free article] [PubMed] [Google Scholar]
- 66.Neuschwander-Tetri BA. Hepatic lipotoxicity and the pathogenesis of nonalcoholic steatohepatitis: the central role of nontriglyceride fatty acid metabolites. Hepatology. 2010;52(2):774–788. doi: 10.1002/hep.23719. [DOI] [PubMed] [Google Scholar]
- 67.Holland WL, Brozinick JT, Wang LP, et al. Inhibition of ceramide synthesis ameliorates glucocorticoid-, saturated-fat-, and obesity-induced insulin resistance. Cell Metabolism. 2007;5(3):167–179. doi: 10.1016/j.cmet.2007.01.002. [DOI] [PubMed] [Google Scholar]
- 68.Turinsky J, O’Sullivan DM, Bayly BP. 1,2-diacylglycerol and ceramide levels in insulin-resistant tissues of the rat in vivo. Journal of Biological Chemistry. 1990;265(28):16880–16885. [PubMed] [Google Scholar]
- 69.Yang G, Badeanlou L, Bielawski J, Roberts AJ, Hannun YA, Samad F. Central role of ceramide biosynthesis in body weight regulation, energy metabolism, and the metabolic syndrome. American Journal of Physiology. 2009;297(1):E211–E224. doi: 10.1152/ajpendo.91014.2008. [DOI] [PMC free article] [PubMed] [Google Scholar]
- 70.Adams JM, Pratipanawatr T, Berria R, et al. Ceramide content is increased in skeletal muscle from obese insulin-resistant humans. Diabetes. 2004;53(1):25–31. doi: 10.2337/diabetes.53.1.25. [DOI] [PubMed] [Google Scholar]
- 71.Kraegen EW, Cooney GJ, Ye JM, Thompson AL, Furler SM. The role of lipids in the pathogenesis of muscle insulin resistance and beta cell failure in type II diabetes and obesity. Experimental and Clinical Endocrinology and Diabetes. 2001;109(2, supplement):S189–S201. doi: 10.1055/s-2001-18581. [DOI] [PubMed] [Google Scholar]
- 72.Pickersgill L, Litherland GJ, Greenberg AS, Walker M, Yeaman SJ. Key role for ceramides in mediating insulin resistance in human muscle cells. Journal of Biological Chemistry. 2007;282(17):12583–12589. doi: 10.1074/jbc.M611157200. [DOI] [PubMed] [Google Scholar]
- 73.Teruel T, Hernandez R, Lorenzo M. Ceramide mediates insulin resistance by tumor necrosis factor-α in brown adipocytes by maintaining Akt in an inactive dephosphorylated state. Diabetes. 2001;50(7-12):2563–2571. doi: 10.2337/diabetes.50.11.2563. [DOI] [PubMed] [Google Scholar]
- 74.De La Monte SM, Tong M, Lawton M, Longato L. Nitrosamine exposure exacerbates high fat diet-mediated type 2 diabetes mellitus, non-alcoholic steatohepatitis, and neurodegeneration with cognitive impairment. Molecular Neurodegeneration. 2009;4(1, article 54) doi: 10.1186/1750-1326-4-54. [DOI] [PMC free article] [PubMed] [Google Scholar]
- 75.Hannun YA, Obeid LM. Many ceramides. Journal of Biological Chemistry. 2011;286(32):27855–27862. doi: 10.1074/jbc.R111.254359. [DOI] [PMC free article] [PubMed] [Google Scholar]
- 76.Levy M, Futerman AH. Mammalian ceramide synthases. International Union of Biochemistry and Molecular Biology. 2010;62(5):347–356. doi: 10.1002/iub.319. [DOI] [PMC free article] [PubMed] [Google Scholar]
- 77.Li ZZ, Berk M, McIntyre TM, Feldstein AE. Hepatic lipid partitioning and liver damage in nonalcoholic fatty liver disease: role of stearoyl-Coa desaturase. Journal of Biological Chemistry. 2009;284(9):5637–5644. doi: 10.1074/jbc.M807616200. [DOI] [PMC free article] [PubMed] [Google Scholar]
- 78.Bielawski J, Pierce JS, Snider J, Rembiesa B, Szulc ZM, Bielawska A. Sphingolipid analysis by high performance liquid chromatography-tandem mass spectrometry (HPLC-MS/MS) Advances in Experimental Medicine and Biology. 2010;688:46–59. doi: 10.1007/978-1-4419-6741-1_3. [DOI] [PubMed] [Google Scholar]
- 79.Osawa Y, Uchinami H, Bielawski J, Schwabe RF, Hannun YA, Brenner DA. Roles for C16-ceramide and sphingosine 1-phosphate in regulating hepatocyte apoptosis in response to tumor necrosis factor-α . Journal of Biological Chemistry. 2005;280(30):27879–27887. doi: 10.1074/jbc.M503002200. [DOI] [PubMed] [Google Scholar]
- 80.Seumois G, Fillet M, Gillet L, et al. De novo C16- and C24-ceramide generation contributes to spontaneous neutrophil apoptosis. Journal of Leukocyte Biology. 2007;81(6):1477–1486. doi: 10.1189/jlb.0806529. [DOI] [PubMed] [Google Scholar]
- 81.Koybasi S, Senkal CE, Sundararaj K, et al. Defects in cell growth regulation by C18:0-ceramide and longevity assurance gene 1 in human head and neck squamous cell carcinomas. Journal of Biological Chemistry. 2004;279(43):44311–44319. doi: 10.1074/jbc.M406920200. [DOI] [PubMed] [Google Scholar]
- 82.Boslem E, MacIntosh G, Preston AM, et al. A lipidomic screen of palmitate-treated MIN6 β-cells links sphingolipid metabolites with endoplasmic reticulum (ER) stress and impaired protein trafficking. Biochemical Journal. 2011;435(1):267–276. doi: 10.1042/BJ20101867. [DOI] [PubMed] [Google Scholar]
- 83.Carracedo A, Lorente M, Egia A, et al. The stress-regulated protein p8 mediates cannabinoid-induced apoptosis of tumor cells. Cancer Cell. 2006;9(4):301–312. doi: 10.1016/j.ccr.2006.03.005. [DOI] [PubMed] [Google Scholar]
- 84.Hu P, Han Z, Couvillon AD, Kaufman RJ, Exton JH. Autocrine tumor necrosis factor alpha links endoplasmic reticulum stress to the membrane death receptor pathway through IRE1α-mediated NF-κB activation and down-regulation of TRAF2 expression. Molecular and Cellular Biology. 2006;26(8):3071–3084. doi: 10.1128/MCB.26.8.3071-3084.2006. [DOI] [PMC free article] [PubMed] [Google Scholar]
- 85.McCullough KD, Martindale JL, Klotz LO, Aw TY, Holbrook NJ. Gadd153 sensitizes cells to endoplasmic reticulum stress by down-regulating Bc12 and perturbing the cellular redox state. Molecular and Cellular Biology. 2001;21(4):1249–1259. doi: 10.1128/MCB.21.4.1249-1259.2001. [DOI] [PMC free article] [PubMed] [Google Scholar]
- 86.Sauane M, Su ZZ, Dash R, et al. Ceramide plays a prominent role in MDA-7/IL-24-induced cancer-specific apoptosis. Journal of Cellular Physiology. 2010;222(3):546–555. doi: 10.1002/jcp.21969. [DOI] [PubMed] [Google Scholar]
- 87.Senkal CE, Ponnusamy S, Bielawski J, Hannun YA, Ogretmen B. Antiapoptotic roles of ceramide-synthase-6-generated C16- ceramide via selective regulation of the ATF6/ CHOP arm of ER-stress-response pathways. FASEB Journal. 2010;24(1):296–308. doi: 10.1096/fj.09-135087. [DOI] [PMC free article] [PubMed] [Google Scholar]
- 88.Urano F, Wang X, Bertolotti A, et al. Coupling of stress in the ER to activation of JNK protein kinases by transmembrane protein kinase IRE1. Science. 2000;287(5453):664–666. doi: 10.1126/science.287.5453.664. [DOI] [PubMed] [Google Scholar]
- 89.Esfandiari F, Villanueva JA, Wong DH, French SW, Halsted CH. Chronic ethanol feeding and folate deficiency activate hepatic endoplasmic reticulum stress pathway in micropigs. American Journal of Physiology. 2005;289(1):G54–G63. doi: 10.1152/ajpgi.00542.2004. [DOI] [PubMed] [Google Scholar]
- 90.Ji C, Kaplowitz N. Betaine decreases hyperhomocysteinemia, endoplasmic reticulum stress, and liver injury in alcohol-fed mice. Gastroenterology. 2003;124(5):1488–1499. doi: 10.1016/s0016-5085(03)00276-2. [DOI] [PubMed] [Google Scholar]
- 91.Oyadomari S, Mori M. Roles of CHOP/GADD153 in endoplasmic reticulum stress. Cell Death and Differentiation. 2004;11(4):381–389. doi: 10.1038/sj.cdd.4401373. [DOI] [PubMed] [Google Scholar]
- 92.Werstuck GH, Lentz SR, Dayal S, et al. Homocysteine-induced endoplasmic reticulum stress causes dysregulation of the cholesterol and triglyceride biosynthetic pathways. Journal of Clinical Investigation. 2001;107(10):1263–1273. doi: 10.1172/JCI11596. [DOI] [PMC free article] [PubMed] [Google Scholar]
Associated Data
This section collects any data citations, data availability statements, or supplementary materials included in this article.
Supplementary Materials
Supplementary Figure 1 depicts Western blot analysis results corresponding to pPERK, PERK, GRP78/Bip, CHOP, and p85 (control) expression in livers from human control and chronic alcoholic subjects.