Abstract
This work proposes a new framework for the surface generation based on the partial differential equation (PDE) transform. The PDE transform has recently been introduced as a general approach for the mode decomposition of images, signals, and data. It relies on the use of arbitrarily high order PDEs to achieve the time-frequency localization, control the spectral distribution, and regulate the spatial resolution. The present work provides a new variational derivation of high order PDE transforms. The fast Fourier transform is utilized to accomplish the PDE transform so as to avoid stringent stability constraints in solving high order PDEs. As a consequence, the time integration of high order PDEs can be done efficiently with the fast Fourier transform. The present approach is validated with a variety of test examples in two and three-dimensional settings. We explore the impact of the PDE transform parameters, such as the PDE order and propagation time, on the quality of resulting surfaces. Additionally, we utilize a set of 10 proteins to compare the computational efficiency of the present surface generation method and the MSMS approach in Cartesian meshes. Moreover, we analyze the present method by examining some benchmark indicators of biomolecular surface, i.e., surface area, surface enclosed volume, solvation free energy and surface electrostatic potential. A test set of 13 protein molecules is used in the present investigation. The electrostatic analysis is carried out via the Poisson-Boltzmann equation model. To further demonstrate the utility of the present PDE transform based surface method, we solve the Poisson-Nernst-Planck (PNP) equations with a PDE transform surface of a protein. Second order convergence is observed for the electrostatic potential and concentrations. Finally, to test the capability and efficiency of the present PDE transform based surface generation method, we apply it to the construction of an excessively large biomolecule, a virus surface capsid. Virus surface morphologies of different resolutions are attained by adjusting the propagation time. Therefore, the present PDE transform provides a multiresolution analysis in the surface visualization. Extensive numerical experiment and comparison with an established surface model indicate that the present PDE transform is a robust, stable and efficient approach for biomolecular surface generation in Cartesian meshes.
Keywords: Molecular surface generation, PDE transform, Total variation, Solvation analysis, Poisson equation, Virus capsid
I Introduction
The emergence of complexity in self-organizing biological systems poses fabulous challenges to their quantitative description and prediction. The visualization of complex biomolecules, such as proteins, DNAs, molecular motors and viruses, is of crucial importance to our understanding and conceptualization of biomolecular systems. In particular, the visualization of electrostatic potentials on and around biomolecular surfaces has become an important procedure in the analysis of biomolecular structure, function and interaction, including ligand-receptor binding, protein specification, drug design, macro-molecular assembly, protein-nucleic acid and protein-protein interactions, enzymatic mechanism, etc. Molecular modeling and visualization have found widespread applications in modern science and technologies. In 1953, Corey and Pauling proposed the atom and bond model of molecules, which continues to be a cornerstone in physical science.20 In crystallography and solid state physics, the regular polyhedral and periodic lattice model is still popular. On the other hand, the molecular and atomic orbital models are important in a quantum mechanical description of molecules and their dynamics. The past few decades have witnessed rapidly increasing interests in biological research. The modeling and visualization of large complex biomolecules have motivated the development of a variety of physical and graphical models.
Under physiological conditions, most biological processes, such as ion channel transport, signal transduction, transcription, translation, etc., occur in water, which consists of 65–90% of human cell mass. Physically, the stability and solubility of macromolecules, such as proteins, DNAs and RNAs, in aqueous environment are determined by how their surfaces interact with solvent, ions, counterions and/or other surrounding molecules. Therefore, the structure, function, dynamics and transport of macromolecules depend on the features of their molecule-solvent interfaces.16,17 Currently, the van der Waals surface, the solvent excluded surface,47 and the solvent accessible surface are often utilized as molecule-solvent interfaces. In combination with implicit solvent models, these surface models have been applied to protein-protein interactions,21 protein folding,55 protein surface topography,36 drug classification,5 DNA binding and bending,24 macromolecular docking,34 enzyme catalysis,38 solvation energies,46 molecular dynamics26 and ion channel transport.15,79,81
One of the well known problems associated with the use of van der Waals surface, solvent excluded surface, and solvent accessible surface is the possibility of having geometric singularities where self-intersecting surfaces and cusps lead to computational difficulties.19,25,31,50,74 To overcome this difficulty as well as to enforce the important energy minimization principle for any physically stable system, energy variation subject to certain geometric constraint has been adopted as an important approach for the biomolecular surface generation.
To our knowledge, the first partial differential equation (PDE) based construction of biomolecular surface was introduced by Wei and his coworkers in 2005.64 Unlike other commonly used PDE based surface smoothing techniques75,77 which start with an existing molecular surface, the PDE based approach discussed here uses atomic coordinates and radii rather than a given surface to generate hypersurfaces by the time evolution of curvature controlled PDEs, i.e., geometric PDEs. The biomolecular surface is subsequently obtained by the isosurface extraction from the hypersurface, or simply called a surface function.64 This geometric flow approach was originally designed to generate solvent excluded surface type of biomolecular surfaces which are free of geometric singularities.
In 2006, the first variational formulation of biomolecular surfaces based on the surface free energy minimization was introduced.2–4 The minimal surfaces are omnipresent in nature, such as soap bubbles, oil drops in water, etc. The minimization of surface free energy leads to the mean curvature flow, a PDE whose solution under appropriate constraint gives rise to the minimal molecular surface (MMS).2–4 The MMS approach was validated by the calculation of electrostatic solvation free energies of 26 proteins.4 Our construction and design of the MMS draw upon the experience of our earlier geometric flow approach for biomolecular surface generation.64 Recently, we proposed a general framework for the construction of biomolecular surfaces by generalized geometric flows in which the surface evolution is determined by the balance of curvature effects and potential effects.1 This approach enables the incorporation of microscopic interactions, such as van der Waals potentials, into the curvature motion. Based on the above developments, differential geometry based multiscale models was introduced by Wei to describe the dynamics and transports of chemical and biological systems, including fuel cells, ion channels, DNA packing, nanofluidic systems, and virus evolution.62 In these new multiscale models, variational molecular surfaces serve as the solvent-solute interfaces which separate the atomistic discrete description of macromolecules from the continuum description of the solvent. A total free energy functional is constructed to put the discrete and continuum descriptions as well as the surface free energy, on an equal footing. The variation of the energy functional via the Euler-Lagrange equation results in coupled Boltzmann equation for electrostatic potential, the generalized Laplace-Beltrami equation for the molecular surface and other equation for the dynamics of the continuum and/or discrete systems.16,17,62
Recent development in multiscale molecular dynamics26 calls for fast and reliable surface construction algorithms. During the molecular dynamics simulation, molecular surfaces are repeatedly generated tens of millions of times. Therefore, fast surface construction is crucial to the success of multiscale molecular dynamics. Surface construction is also a key issue in the computation of variational interface based Poisson-Nernst-Planck models80 and variational interface based multiscale models for proton transport.14 A common feature of the above-mentioned models is that the surface evolution equation is coupled to other governing equations, e.g., the Poisson equation, and thus needs to be solved iteratively and repeatedly for certain number of times. A main difficulty that slows down the surface construction is that one has to extract embedded geometric information and structure during the solvation analysis. The geometric information and structure can be extremely complex due to complexity of biomolecular systems74 and the theoretical model used. Finding geometric feature that preserves fast surface construction remains a challenge in mathematical biophysics.
In the past two decades, there has been a dramatic growth in the research interest of geometric flows,65 particularly mean curvature flows in applied mathematics for image analysis, material design42,52,53 and surface processing.75 In 1983, Witkin introduced the diffusion equation for image denoising.67 The essential idea of Witkin’s algorithm is that the evolution of an image under a diffusion operator is formally equivalent to the standard Gaussian low-pass filter for image denoising. In 1990, Perona and Malik proposed an anisotropic diffusion equation45 which was designed to remove noise without smearing the image edges. In this approach, the diffusion coefficient depends on the image gradients such that it is small at image edges.11,45,54,61,63 Computational techniques using the level set formalism were devised by Osher and Sethian,44,52 and they have aided the success of geometric flows in practical applications. Total variation models were pioneered by Rudin, Osher, and Fatemi48 for edge preserving image restoration. The Mumford-Shah variational functional,41 and the Euler-Lagrange formulation of image processing and surface analysis have become popular.8,9,43,48,51
Both the above mentioned diffusion equation and earlier total variation models are based on the second order PDEs for image processing or surface analysis. The Willmore flow, proposed in 1920s, is a fourth order geometric PDE and has also been used for surface analysis of membranes. In 1999, Wei introduced the first family of arbitrarily high order nonlinear PDEs for edge-preserving image restoration.61 The central idea is to accelerate the noise removal by higher order derivatives. As a variant of Wei’s arbitrarily high order nonlinear PDEs, we also proposed an arbitrarily high order geometric PDE for molecular surface formation and evolution.1 Surface generated with such high order geometric PDE shows a morphology distinguished from that obtained with the second order PDE. In the past decade, high order nonlinear PDEs, particularly fourth order nonlinear PDEs, have attracted much attention in image analysis.1,10,11,32,33,39,57,61,70 Unlike the classical second order PDEs, higher order PDEs are able to suppress high frequency components, including noise, at much faster rate. Mathematical analysis of fourth order edge-preserving PDEs was carried out by Bertozzi and Greer in Sobolev space,6,32,33 proving the existence and uniqueness of the solution to a case with H1 initial data and a regularized operator. Another analysis by Xu and Zhou68 was performed under similar conditions. Recently, Jin and Yang have proved the existence of the strong solution of Wei’s fourth order equation, whose mathematical structure differs from other fourth order PDEs derived from variational formulation.35 Because high order PDEs are subject to strict stability constraints in their numerical solutions, computational techniques for higher order PDEs are important issues, except for digital image processing where the grid size is usually unit. In 2003, Witelski and Bowen designed alternating direction implicit (ADI) schemes to solve arbitrarily high order nonlinear PDEs.66
In early time, both low order and high order nonlinear image-processing PDEs are mostly designed to function as low-pass filters. In 2002, Wei and Jia63 introduced PDE based band-pass or high-pass filters for image edge detection. The key point of their approach is that when two coupled evolution PDEs are evolving at dramatically different speeds, which is achieved by their largely different diffusion coefficients, the difference of two low-pass PDE operators gives rise to a band-pass filter. The coupling terms is based on the relative fidelity of two images, so as to balance the disparity of two images. One can create a high-pass PDE operator by setting one of the PDE operator to an identity operator, i.e., setting the diffusion and fidelity coefficients to zero, because the difference between an all-pass filter and a low-pass filter is a high-pass filter.63 Nonlinear PDE based edge detection operators work extremely well for images with large amount of textures, compared to classical Sobel, Prewitt, and Canny operators.56,63
Most recently, we have generalized the nonlinear PDE based high-pass filter for mode decomposition, i.e., the splitting of images, signals, and data into various modes according to their frequency distributions.58–60 The subsequent processing, or secondary processing, of the individual functional modes thus enables us to achieve our goal of signal, image, surface and data analysis. Therefore, mode decomposition is a fundamental process in information processing and data analysis.58 All of the important apparatuses for the PDE based mode decomposition were developed in our earlier work on arbitrarily high order PDE filters61 and PDE based band-pass or high-pass filters.63 The process of PDE based mode decomposition is called a PDE transform because it behaves like the wavelet transform, i.e., decomposing data into physically meaningful functional modes and allowing perfect reconstruction. By functional modes, we mean the mode components which share same band of frequency as well as same category, i.e., trend, edge, texture, noise etc. Secondary processing of the functional modes obtained by the PDE transform can be applied to achieve various desirable processing tasks such as edge detection, feature extraction, trend estimation, enhancement, denoising, texture analysis, segmentation, pattern recognition, etc. One of many attractive properties of the PDE transform is its control of time-frequency localization via the order of the PDE transform. Another attractive feature of the PDE transform is its physical space representation. The resulting functional modes are still in the original data form. Since PDE parameters and initial conditions for each individual mode decomposition vary throughout the overall extraction process, the PDE transform is nonlinear process even if a linear PDE is used. In a general sense, the PDE transform is the incorporation of the arbitrarily high order PDE into a recursive mode extraction procedure. In this sense, earlier PDE approaches of image, signal, surface, and data analysis may be regarded as certain special cases.
The objective of the present work is to explore the utility of the PDE transform for fast generation of biomolecular surfaces. We construct a set of arbitrarily high order nonlinear PDEs by the total variational formulation. These variational PDEs are converted into evolution PDEs by the introduction of an artificial time. To avoid the strict stability constraints of solving high order PDEs and to gain the desirable acceleration in the surface construction, we make use of the fast Fourier transform (FFT) algorithm to realize the PDE transform in a single time step as in the commonly applied technique.69 The present algorithm is O(N ln N). The relations between the order of the PDE transform and molecular surface features, such as surface area, volume, and morphology, have been investigated. Comparison to the existing surface generation algorithms is made. Application to electrostatic potential analysis is carried out by using the Poisson-Boltzmann model and Poisson-Nernst-Planck model in which the biomolecular surface is taken as a solvent-solute interface.
This paper is organized as follows. Section II is devoted to the theory and formulation of the PDE transform. Apart from describing the basic formalism, a variational derivation is presented. The effects of the order and the propagation time of the PDE transform on surface generation are studied in III. First, two sets of initial values are studied for their performance in the molecular surface generation. We show that biomolecular surfaces constructed from the atomic center Gaussian envelopes do not have desirable smoothness. Whereas the present PDE transform based biomolecular surfaces possess good regularity. The validity of the proposed PDE transform for biomolecular surface generation is explored in Section IV. We examine the computational efficiency as well as surface areas and surface enclosed volumes of the present method for a large set of proteins. Comparison is given to other established methods in the literature. Furthermore, the application of the proposed approach to protein surface construction is discussed in Section V. PDE transform based biomolecular surfaces are further validated and characterized by the solvation free energy analysis via the Poisson-Boltzmann model and by the diffusion analysis via the Poisson-Nernst-Planck model. Finally, we consider a challenging application, the construction of virus surfaces, which involve excessively large data sets. The successful applications to these systems indicate the utility of the present PDE transform based surface generation method. This paper ends with a conclusion of the proposed surface generation techniques.
II Theory and formulation
This section discusses the rationale and variational formulation of the PDE transform. To establish notations and illustrate important concepts, we start by a brief review of high order PDE based nonlinear low-pass filters introduced by Wei.61 We construct the PDE transform by the combination of high order PDEs with an iterative procedure. The performance of the PDE transform depends crucially on the use of high order PDEs in high-pass or low-pass filters, which gives rise to desired frequency localization. In this section, it is also shown that the PDE transform introduced in our recent work59,60 can be derived in variational formula. Fast PDE transform via the fast Fourier analysis is discussed at the end of this section.
II.A Arbitrarily high order nonlinear PDEs
Although the second order PDEs are commonly used for image processing and data analysis. The use of high order PDEs is much less common in practical applications. Motivated by the super flux in the pattern formation in alloys, glasses, polymer, combustion, and biological systems and the Perona-Malik equation,45 Wei introduced the first family of arbitrarily high order nonlinear PDEs for image restoration in 199961
| (1) |
where r ∈ ℝn , u (r, t) is the processed image function, dq (u(r, t), |∇u(r, t)|, t) and e(u(r, t), |∇u(r, t)|, t) are inhomogeneous (for example, edge sensitive) diffusion coefficients and enhancement operator, respectively. Equation (1) is subject to the initial data u(r, 0) = X(r) and appropriate boundary condition. One can recover the Perona-Malik equation by setting q = 0 and e(u(r), |∇u(r), t) = 0. The fourth order version of Eq. (1) has been applied to image denoising and restoration by many researchers.29,30,39,61
As in the original Perona-Malik equation, one can choose the hyperdiffusion coefficients dq(u(r), |∇u(r)|, t) in Eq. (1) in many different ways. One popular choice is the Gaussian form
| (2) |
where the values of constant dq0 depend on the noise level. Note that σ0 and σ1 are chosen as the local statistical variance of u and ∇u
| (3) |
The notation above denotes the local average of Y(r) centered at position r. In this algorithm, the statistical measure based on the local statistical variance is important for discriminating image features from noise. As such, one can bypass the preprocessing of noisy images, i.e., the convolution of the noise image with a test function or smooth mask in the application of the PDE operator.
Recently, another family of arbitrarily high order geometric PDEs was proposed for surface formation and evolution with application in the surface generation of proteins and other biomolecules,1
| (4) |
where S is the hypersurface function g(|∇∇2q S|) = 1+|∇∇2qS|2 is the generalized Gram determinant and P is a generalized potential term, including microscopic potential effect in biomolecular surface formation. Equation (4) was constructed as a generalization of many other important geometric PDEs. For example, when q = 0 and P = 0, it reduces to the mean curvature flow equation used in our earlier formulation of minimal molecular surfaces,1 while when q = 1 and P = 0, it is a surface diffusion flow.1 Certainly, Eq. (4) can also be regarded as a variant of Wei’s earlier arbitrarily high order PDE (1). It is interesting to note that the molecular surface generated by Eq. (4) has a distinct morphology,1 although an in-depth analysis has not been presented yet.
Theoretical analysis of high order nonlinear PDE filtering has always been an important research topic in the applied mathematical community. The well-posedness of Eq. (1) was analyzed in terms of the existence and uniqueness of the solution by many researchers.6,32,33,35,68 Unlike other high order nonlinear PDEs, Eq. (1) and Eq. (4) were not derived from a variational formulation. Therefore, mathematical properties of these nonlinear equations differ from those of other high order PDEs.35
II.B Variational formulation of geometric PDEs
Variational models are some of the most commonly used approaches in science and engineering. Variational analysis has been an active area of research in applied mathematics.4,16,22,49,62 Variational derivation of solvent-solute interfaces has been formulated in many of our recent differential geometry based multiscale models.16,17,62 Didas et al. discussed the variational formulation of high order nonlinear PDEs.22 In the present work, we provide alternative expressions for the PDE transform by a variational approach. We define the energy functional as
| (5) |
where ε is a constant, X is the original data, ε(X − u)2 is the fidelity term and Λ(·) is an appropriate penalty function, For examples, one can choose many different forms22,39
| (6) |
| (7) |
| (8) |
where Eq. (6) is the well known Tikhonov penalty function.
Minimizing the energy functional (5) by the Euler-Lagrange equation, one has
| (9) |
where ⊙q is a normal product for even q and an inner product for odd q. Here
| (10) |
The energy functional is minimized when Eqs. (9) are satisfied. To this end, we make use of the steepest descent algorithm with an artificial time and convert Eqs. (9) into a time dependent PDE
| (11) |
Although the mathematical properties of these nonlinear PDEs may differ from those in Eq. (1), Eq. (11) is essentially equivalent to the earlier PDE transform.60
II.C PDE transform
One of the important properties of the PDE transform is its ability to extract mode functions from a given data X. One can denote the solution of Eq. (1) and/or Eq. (11) by X̌ (t) such that
| (12) |
where 𝔏 is a low-pass PDE transform satisfying 𝔏u(r, 0) = u(r, t), X̌k(r, t) are mode functions and Xk(r) is the kth residue function defined by
and
| (13) |
Therefore, is a perfect reconstruction of the original data X in terms of all the mode functions and the final residue. Note that the PDE transform given in Eq. (12) recursively generates mode functions based on the input residue function. Obviously, this procedure is nonlinear even if a linear PDE operator is used.
The first mode produced by the present PDE transform is the trend of the data. The residue of the trend is a general edge function. By systematically repeating the low-pass PDE transform (12), one can extract all the desired higher order mode functions. In our earlier work, high-pass PDE transforms were also constructed in which the first mode is edge type of information and the final residue is the trend.59,60
II.D Fast PDE transform
Solving arbitrarily high order PDEs, such as Eq. (1) or Eq. (11) in the PDE transform can be a numerically difficult issue for some practical applications. A main concern is the stability constraint as the time stepping size is normally proportional to 2mth power of spatial grid spacing, where 2m is the highest order of the PDE operator. Although one can bypass this difficulty in digital image processing due to unitary spatial grid spacing, the spatial grid spacing is normally smaller than one in order to maintain a good resolution in many other applications, including surface construction.
For a linearized form of Eqs. (1) and Eqs. (11), we can make use of the Fourier transform to gain computational efficiency. Let us assume a linear PDE of the form
| (14) |
where dj > 0, ε ~ 0 and Xk ∈ ℝn is the kth residue of the data. Equation (14) is subject to initial value u(r, 0) = Xk. The exact solution of Eq. (14) in the n dimensional Fourier representation is
| (15) |
where X̂̌ and X̂k are the Fourier transforms of X̌k and Xk, respectively. Here 𝔏̂ is a frequency response function
| (16) |
where .
In the present work, we will also explore the use of the fast PDE transform in the form of Eq. (15) for molecular surface generation. Periodic boundary conditions are employed wherever they are necessary.
III Numerical tests
In this section, we validate the proposed PDE transform for surface generation by many numerical tests and experiments. We first discuss two types of initial data used in our evolution PDEs. The suitability of these data for surface construction is examined. Based on our previous experience, the highest order 2m of the PDE transform is crucial to its performance. The effect of propagation time t is similar to that of diffusion coefficients dj, at least for linearized PDEs. Therefore, for simplicity, we set ε = 0, dj = 0 (j = 1,⋯, m − 1) and dm = 1 in all test experiments. The effects of the highest order 2m of the PDE transform and the propagation time t are investigated. Finally, we test the computational efficiency of the proposed method by comparing with the performance of the MSMS approach50 (http://mgl.scripps.edu/people/sanner/html/msms_home.html).
III.A Initial data
Piecewise-constant initial values
Piecewise initial data were used in our earlier work for molecular surface construction in the Eulerian representation.64 For example, in the first PDE based molecular surface approach, the following initial value was used
| (17) |
that is, if r lies in any of the sphere (O(rβ, rβ) : {r ∈ ℝ3, ‖r − rβ‖ ≤ rβ}) defined by atomic coordinates, then the value for u is 0, otherwise, u = 1. Here, rβ and rβ (β = 1,⋯, Nβ) are respectively the coordinate and specific radius of each individual atom in the molecule with Nβ being the total number of atoms. The atomic specific radius can be chosen as the atomic van der Waals radius.
Note that if the partition of the region labeled by 0 is switched with that labeled by 1, we obtain another alternative non-smooth definition of the initial value, which was extensively used in the generalized Laplace-Beltrami equations in our recent work.1,4,16 Obviously, this type of initial data is not smooth. Its performance for surface generation will be examined.
Gaussian initial values
The Gaussian functions are often used for molecular surface generation. A recent example has been discussed in the literature.28,74,76 Here we adopt the prescription by Giard and Macq28 with minor modification as the initial value u(r, 0)
| (18) |
where re is set to 3 Å and s is the threshold parameter.28 Obviously, this initial value is more smooth. However, we will show in the next section that molecular surfaces directly extracted from the Gaussian functions can have geometric singularities. It is noted that initial Gaussian values do not directly represent surfaces. Instead, they are functions embedded with surface information.
III.B Two-dimensional test studies
Effect of the order of the PDE transform
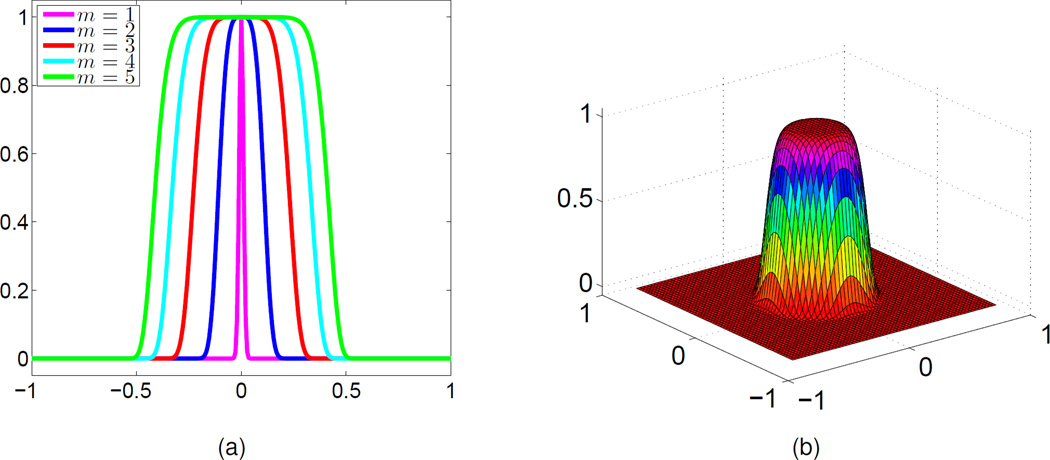
We explore the impact of the order of the PDE transform. Assuming that the propagation time is fixed, the effect of the PDE transform depends on its order (2m). This effect can be analyzed by the Fourier transform. As shown in Fig. 1 (a), when the propagation time is set to t = 5000, as the highest order 2m becomes higher, the frequency response functions provide a wider low-pass window with smooth transition regions. In a two-dimensional (2D) setting, the frequency response functions of a PDE transform are given in Fig. 1(b). Obviously, it is a 2D near-ideal low-pass filter.
Figure 1.
Frequency response functions. (a) 1D frequency response functions obtained at different 2m values (t = 5000); (b) 2D frequency response function (2m = 8 and t = 5000).
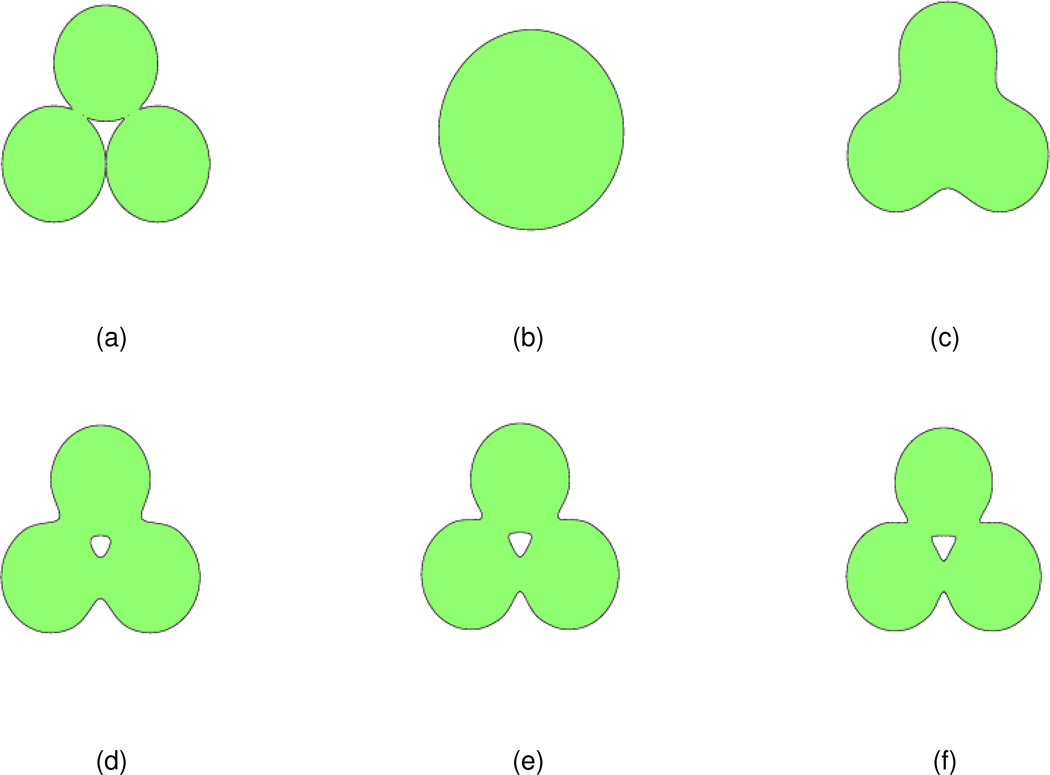
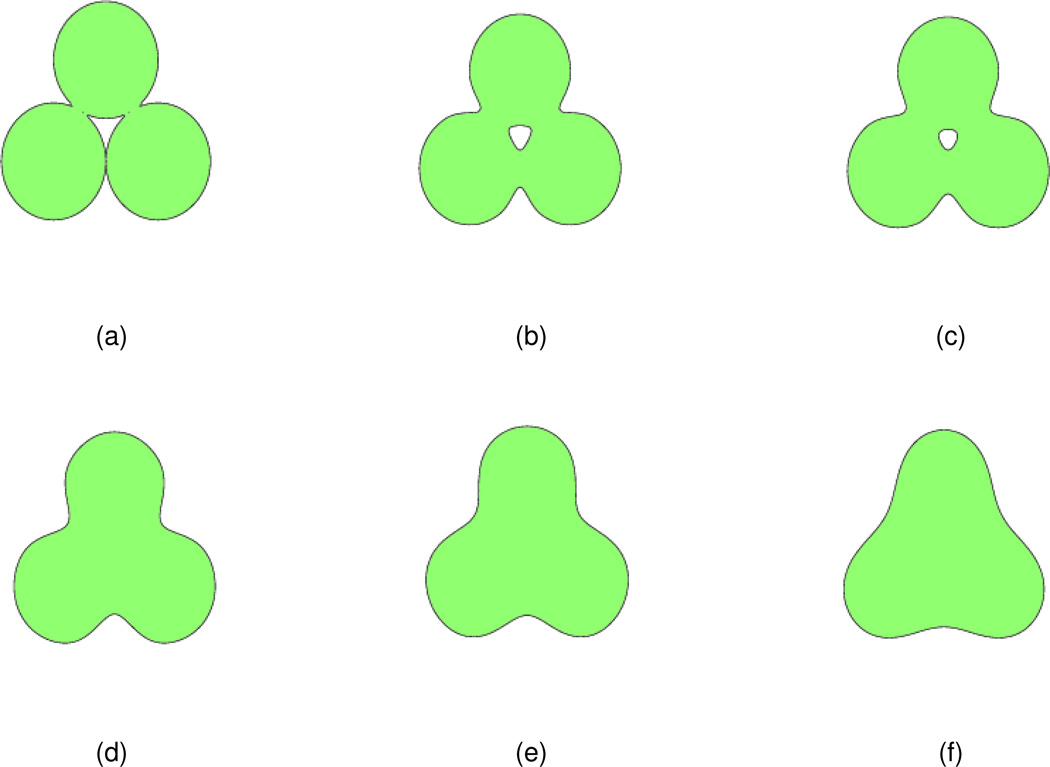
A 2D initial value formed by three circles is studied to examine the effect of the order (2m) of the PDE transform for the surface formation. The centers of the circles are (−1.8,0),(1.8,0), and (0,3.12), respectively with the same radius 1.8. The initial value u(r, 0) is constructed according to Eq. (18) with Nβ = 3. The isosurface at u(r, 0) = 1.0 (here s = 1.0) of the initial value is shown in Fig. 2(a). The PDE transform is applied to the initial value with t = 5000 and 5 different orders (2m = 2,4,6,8,10). The frequency responses of PDE transform parameters are shown in Fig. 1.
Figure 2.
The isosurface of the initial value and isosurfaces obtained from PDE transforms of different orders. (a) Initial value, u(r, t = 5000) = 1.0; (b) The isosurface after the PDE transform with 2m = 2, u(r, t = 5000) = 0.4; (c) The isosurface after the PDE transform with 2m = 4, u(r, t = 5000) = 1.0; (d) The isosurface after the PDE transform with 2m = 6, u(r, t = 5000) = 1.0; (e) The isosurface after the PDE transform with 2m = 8, u(r, t = 5000) = 1.0; (f) The isosurface after the PDE transform with 2m = 10, u(r, t = 5000) = 1.0.
After the PDE transform, resulting isosurfaces are shown in Figs. 2(b)–(f). It is observed that in subfigure (b), too much information is filtered out and the resulting isosurface differs much from the isosurface of the initial value. In subfigure (c), the resulting isosurface is smooth, without cavity, and also keeps the basic features of the original isosurface. In subfigures (e)–(f), the basic features of the initial isosurface are remained but the cavity part is not filtered out, and the intersection region of different circles is not so smooth compared to that in subfigure (c). Therefore, the isosurface in Fig. 2(c) appears to provide a better result.
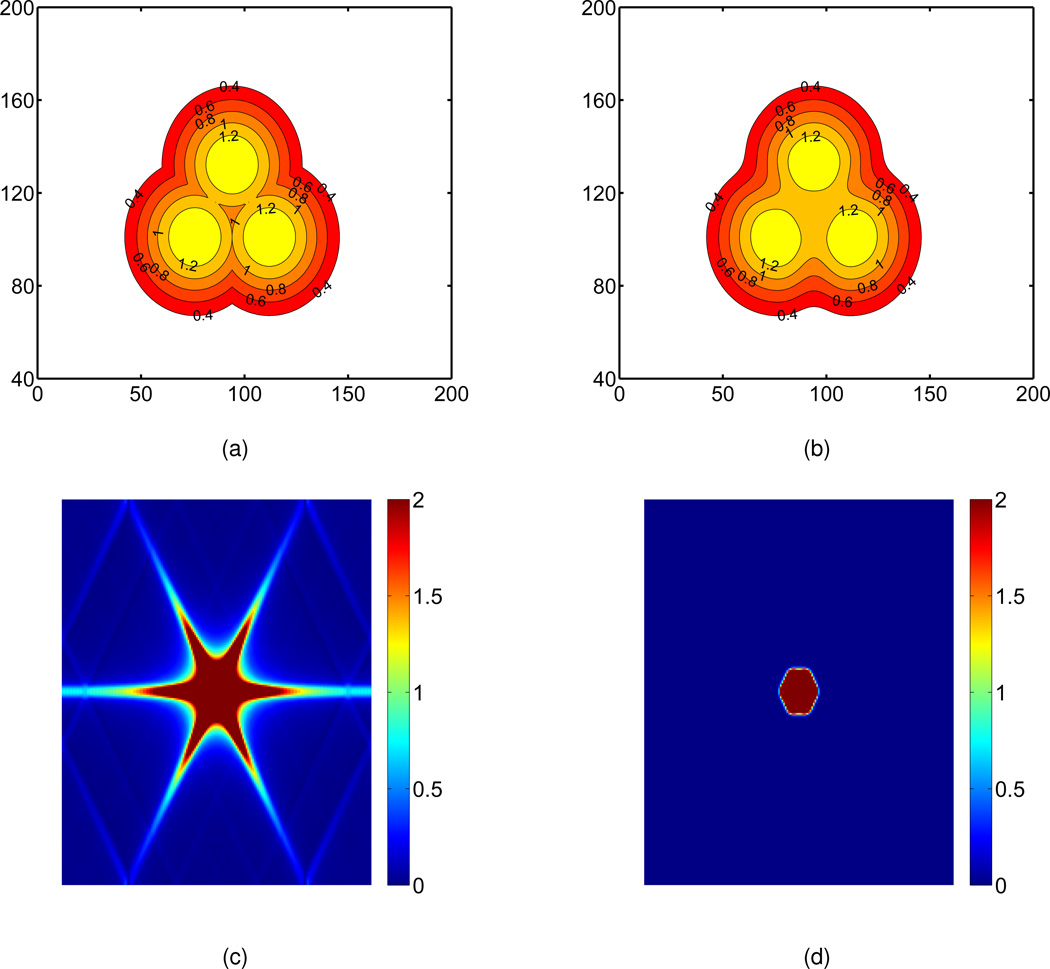
To further illustrate the impact of the PDE transform, we provide the Fourier analysis of isosurfaces before and after the PDE transform. As shown in Fig. 3(a), the initial value obtained by using Gaussian functions is not smooth at all contours. Therefore, molecular surfaces generated by direct isovalue extraction from Gaussian functions will have potential geometric singularities. The Fourier image of the initial value is given in Fig. 3(c). Here, the origin of the frequency domain is at the center of the graph. Obviously, there are many high frequency components due to the combination of individual Gaussian functions. The goal of the PDE transform is to get rid of high frequency components. Indeed, after the PDE transform, the high frequency components are effectively reduced as depicted in Fig. 3(d). The isosurface generated by the PDE transform is plotted in Fig. 3(b). One can obtained a desirable final isosurface by choosing an appropriate isovalue, say 1.0.
Figure 3.
Impact of the PDE transform. (a) Initial value shown in the physical domain; (b) Isosurface generated by the PDE transform shown in the physical domain. (c) Initial value shown in the frequency domain; (d) Isosurface generated by the PDE transform shown in the frequency domain; The final isosurface is obtained by taking an isovalue of 1.0.
Effect of the propagation time of the PDE transform
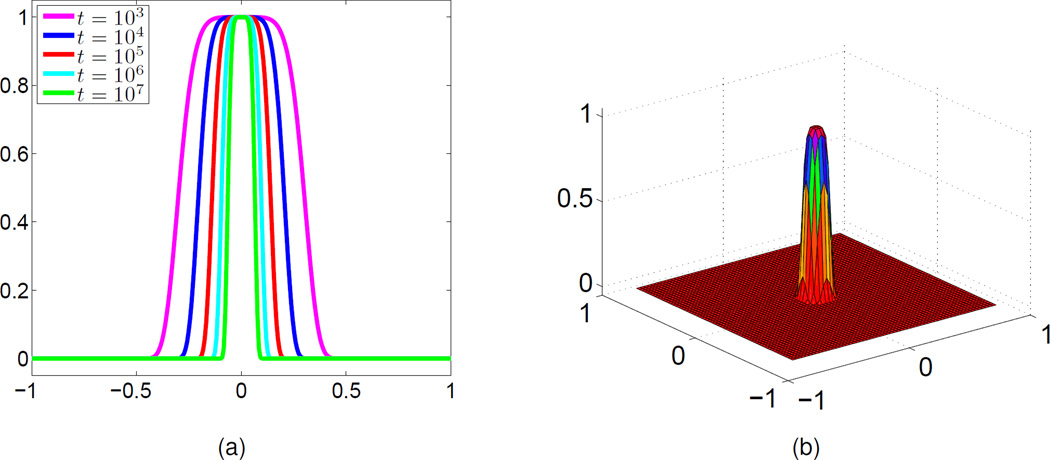
We next conduct a different test. Assuming that the order of the PDE transform is fixed, then the frequency response function changes with the propagation time. As shown in Fig. 4(a), when the order of the PDE transform is set to 2m = 6, as the propagation time t gets longer, the frequency response function provides a smaller low-pass window with smooth transition regions.
Figure 4.
Frequency response functions. (a) 1D frequency response functions obtained at different time t (2m = 6); (b) 2D frequency response function (t = 106 and 2m = 6).
The earlier case where surface function is formed by three circles is studied to examine the effect of the propagation time t for the surface formation. Again, the initial isosurface at u(r, 0) = 1.0 (here s = 1.0) is shown in Fig. 5(a). The PDE transform is applied to the initial value with 2m = 6 and 5 different propagation time (t = 103, 104, 105, 106 and 107), where a 1D graph is shown in Fig. 4(a), and a 2D illustration is shown in Fig. 4(b) with n = 6 and t = 106. One observes near-ideal low-pass filters.
Figure 5.
The isosurface of the initial value and isosurfaces u(r, t) = 1.0 after PDE transforms with 2m = 6. (a) Initial isosurface; (b) The isosurface after the PDE transform with t = 103; (c) The isosurface after the PDE transform with t = 104; (d) The isosurface after the PDE transform with t = 105; (e) The isosurface after the PDE transform with t = 106; (f) The isosurface after the PDE transform with t = 107.
After the PDE transform, resulting isosurfaces given at the same isovalue u(r, t) = 1.0 are shown in Figs. 5(b)–(f). It is observed that in subfigures (b)–(c), the intersection corners of different circles are smoothed in different levels but the cavity part is remained. In subfigures (d), (e) and (f), the resulting isosurfaces are smooth, without cavity, and also keeps the basic features of the original isosurface. Furthermore, subfigures (d) (e), and (f) are different in terms of the transition feature. That is, subfigure (f) has lower curvatures compared to (d) and (e) at intersectional regions. Therefore, with an appropriate propagation time, higher order PDE transforms can also provide desirable computational results in the surface generation. We omit the further test of higher order PDE transforms. However, in the next section, we demonstrate some practical applications of higher order PDE transforms for biomolecular surface generations.
III.C Three-dimensional test studies
In this section, we carry out the PDE transform based surface generation by embedding the 2D surface in the ℝ3, namely, an Eulerian representation of 2D surfaces.17 We first examine appropriate conditions which lead to surfaces with suitable biomolecular morphologies, i.e., maintaining biomolecular characteristic, being free of geometric singularities and having a good resolution. Impacts of PDE transform order and propagation time are studied.
All atomic coordinates of proteins are downloaded from the Protein Data Bank (PDB). Atomic van der Waals radii of proteins are adopted from the CHARMM force field.40
Three-atom test case
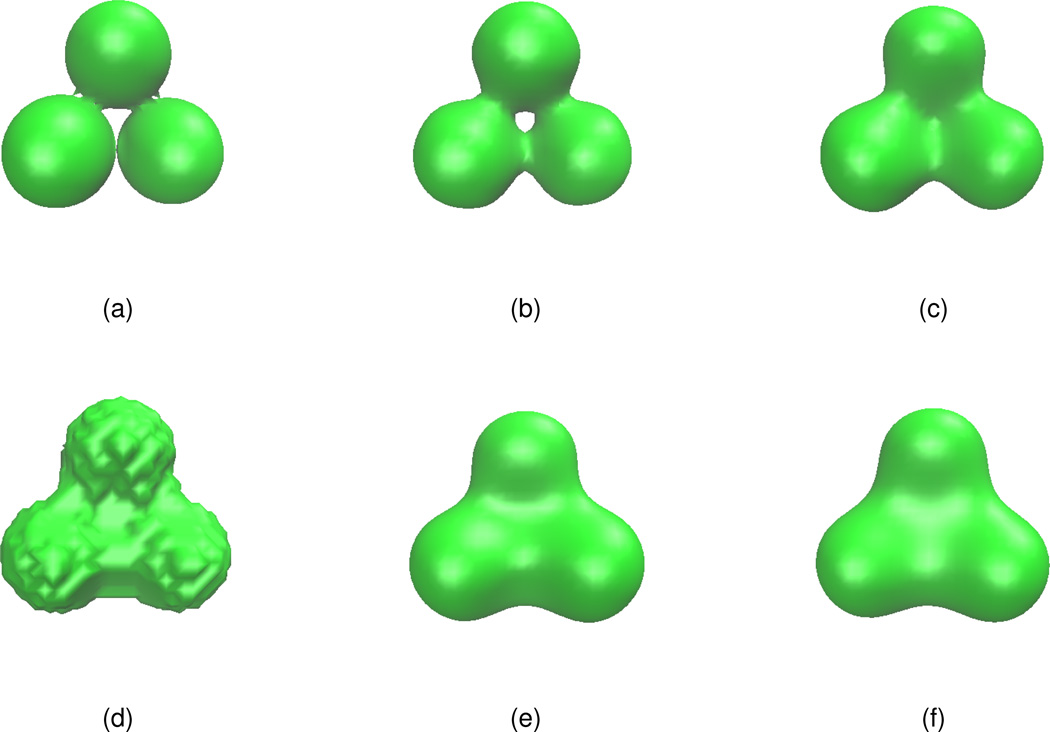
We first consider a simple test example: a 3-sphere case. The initial atomic coordinates are given as (0,0,1.8), (0,0,−1.8), (0,3.12,0) with a uniform radius of 1.8 Å. The effect of the two different sets of initial values presented in Eq. (17) and Eq. (18) are examined. The Gaussian initial value defined by Eq. (18) with the isovalue=1.0 is shown in Fig. 6(a). As in the 2D case, the Gaussian functions lead to geometric singularities in molecular surfaces. As a comparison, the piecewise-constant initial value defined by Eq. (17) with the isovalue=0.6 is shown in Fig. 6(d). Obviously, it is a low quality surface. The surface generated by the PDE transform are presented in Figs. 6(b),(c), (e) and (f). It is seen that the surfaces generated by using the piecewise-constant initial value have a better quality.
Figure 6.
The isosurface of the initial value and isosurfaces u(r, t) = 1.0 after PDE transforms. (a) Initial isosurface defined by Eq. (18); (b) The isosurface after the PDE transform with 2m = 12, t = 104; (c) The isosurface after the PDE transform with 2m = 12, t = 106; (d) Initial isosurface defined by Eq. (17); (e) The isosurface after the PDE transform with 2m = 12, t = 104; (f) The isosurface after the PDE transform with 2m = 12, t = 106
Effects of isovalue and integration time
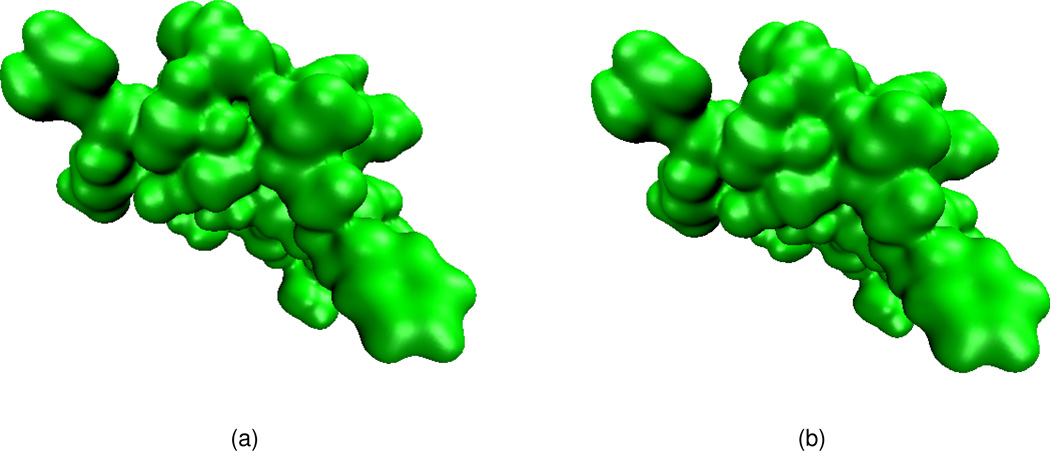
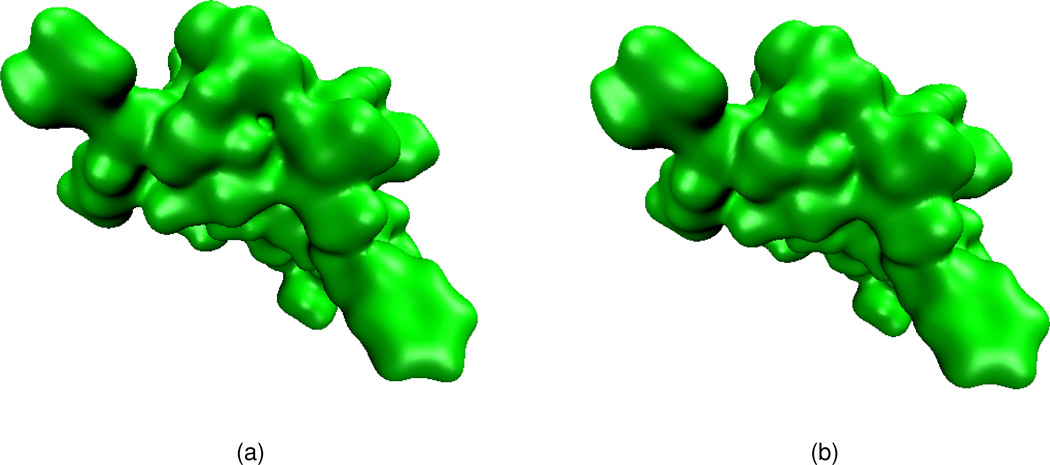
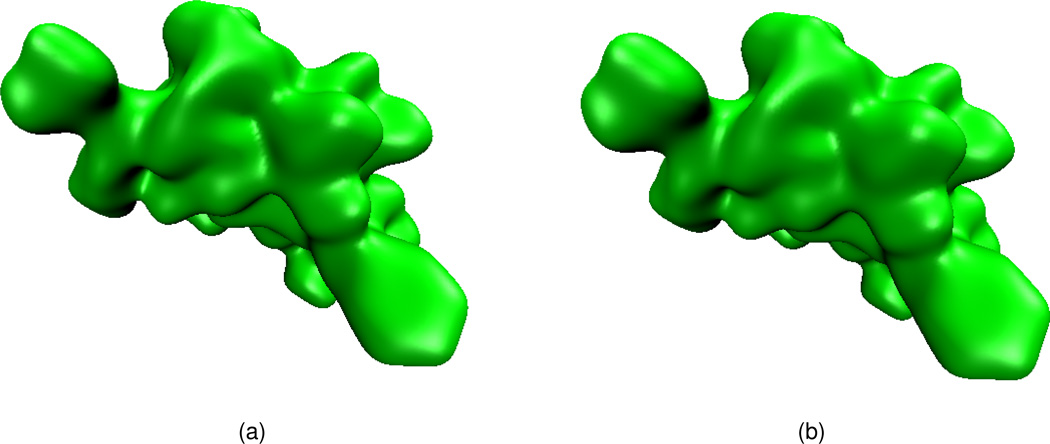
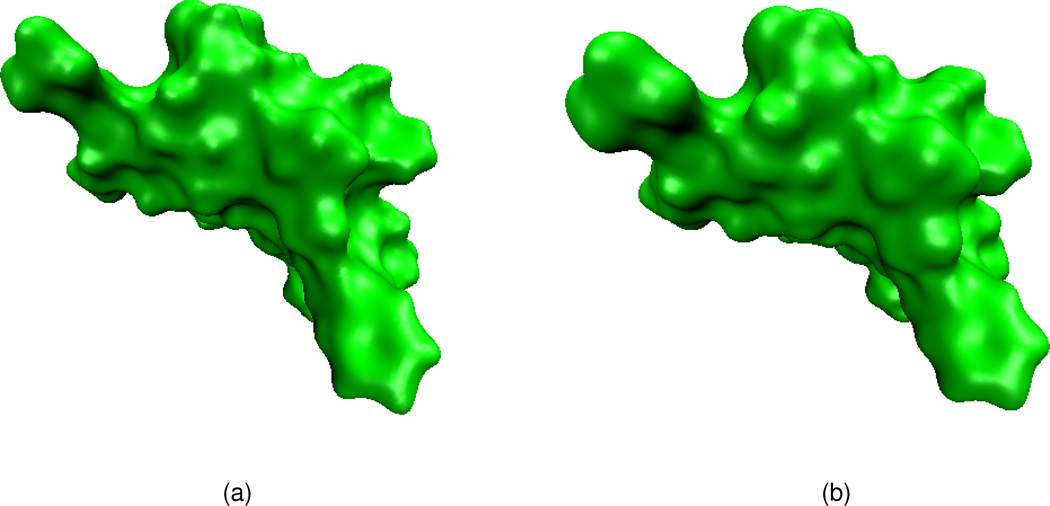
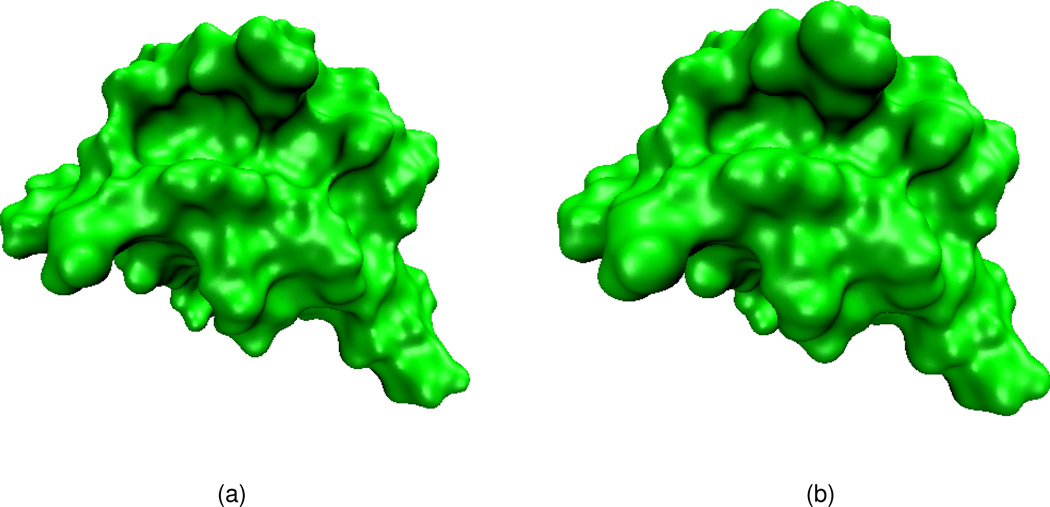
We carry out our further tests with realistic surface generation of proteins. Choosing a specific protein structure (e.g., PDB ID: 1ajj), the initial value u (r, 0) is provided according to Eq. (18) and other type of initial values will be examined later. The final surface of the PDE transform is obtained with appropriate isovalues. In Figs. 7, 8 and 9, we plot three surfaces with the propagation time t = 102, t = 103 and t = 104 respectively and the order of the PDE transform is fixed at 2m = 6. In these figures, subfigure (a) shows the surface when the isovalue equals 1.0, while subfigure (b) depicts the surface when the isovalue equals 0.9.
Figure 7.
Surfaces of protein 1ajj generated by applying the PDE transform with 2m = 6 and t = 102. (a) Isovalue=1.0; (b) Isovalue=0.9.
Figure 8.
Surfaces of protein 1ajj generated by applying the PDE transform with 2m = 6 and t = 103. (a) Isovalue=1.0; (b) Isovalue=0.9.
Figure 9.
Surfaces of protein 1ajj generated by applying the PDE transform with 2m = 6 and t = 104. (a) isovalue=1.0; (b) isovalue=0.9.
Figures 7(a) and (b) both give good characterizations of the original protein. However, Fig. 7(a) has a cavity which is smaller than the solvent size, which is normally regarded as unphysical. The surface in Fig. 7(b) is preferred. For the same reason, the surface in Fig. 8(b) is preferred over that in Fig. 8(a). Both surfaces in Fig. 9(a) and (b) appear to have been over smeared, if a model is parameterized according to the solvent excluded surface.
Nevertheless, the present PDE transform is able to provide multiresolution representations by controlling the propagation time when the diffusion coefficients are fixed. As it is well known that different resolutions can serve different purposes in practical applications. The ability of offering multiresolution surface analysis is a common property for PDE based methods as originally discussed in our earlier work.64
In general, a smaller isovalue produces a more smoother and inflated surface. The selection of a surface depends on the parameterization of the theoretical model. For example, some models use solvent accessible surfaces, while other models use solvent excluded surfaces. For a given protein, the solvent accessible surface is much more inflated than the solvent excluded surface. With appropriate parameterizations, one can make both surfaces working well.
Test of piecewise-constant initial values
We now test piecewise-constant initial values given in Eq. (17) for protein surface generation via the PDE transform. After applying the PDE transform with 2m = 12 and t = 104, the final surfaces for Protein structures (PDB codes: 1ajj and 1hpt) are shown in Figs. 10 and 11 with isovalues 1.0 and 0.6. As observed from these figures, subfigures (a) in both figures illustrated much smoother structures comparing to that in subfigures (b).
Figure 10.
Surfaces of protein 1ajj generated by using the PDE transform with 2m = 12 and t = 104. (a) Isovalue=1.0; (b) Isovalue=0.6.
Figure 11.
Surfaces of protein 1hpt generated by using the PDE transform with 2m = 12 and t = 104. (a) Isovalue=1.0; (b) Isovalue=0.6.
Note that a higher order of the PDE transform is utilized in the present example because piecewise-constant initial values involve many more high frequency components in their Fourier spectra as illustrated in Fig. 3. Therefore, the appropriate use of a higher order PDE transform can result in a better thresholding of high frequency components.
IV Algorithm validations
In this section, we validate the proposed PDE transform method for realistic biomolecular surface generation. We first examine the computational efficiency of the PDE transform for surface generation. As discussion in the Introduction, the computational speed is crucial for many dynamical applications, such Poisson-Boltzmann based molecular dynamics26 and coupled nonlinear Poisson-Nernst-Planck equations.79,81 In fact, surface generation is a major bottleneck in our earlier implicit molecular simulations.26 In addition, we analyze protein surface area and surface enclosed volume. These quantities are useful in molecular biology. To ensure the acceptance of the present method by the community, it is important to investigate its consistency with well established biophysical models in the field. We compare the present results with those of the solvent excluded surfaces (SES) for a large number of protein molecules.
In all computations involving protein structures, atomic coordinates are obtained from the Protein Data Bank (www.pdb.org). The missing hydrogen atoms are added and point charges at atomic centers assigned by using the PDB2PQR package - a python-based structural conversion utility,23 based on the CHARMM force field.40 The the initial values for u can be obtained by Eq. (17) or Eq. (18). Then the fast Fourier transform (FFT) is performed to solve u by using the fftw software package (www.fftw.org). Therefore û is in the frequency domain, i.e., û = FFT(u). Equation (16) is applied to û and we denote the updated values as û̂. Then the inverse fast Fourier transform is carried out on û̂ and unew = IFFT(û̂). The final surface can be extracted from unew by choosing an appropriate isovalue of unew. The computer graphics algorithm, matching cubes, is used to extract the final surface and calculate the surface norm.4
While the two initial values can be used for the surface generation, we note that compared with results computed from Gaussian initial values, results from piecewise-constant initial values are more consistent with those of other established methods, such as the solvent excluded surface. In the rest of this paper, the 12th order PDE transform is used with t = 104 for all the calculations. The isovalue of 0.6 is used for all the surface extractions. The MSMS package50 is used to generate solvent excluded surfaces. In the MSMS surface generation, the probe radius is set to 1.4 and the density is chosen as 10 which is equivalent to a Cartesian mesh size of 0.316 Å.
IV.A Computational efficiency
The computational efficiency for the surface generation is important for certain applications, such as molecular dynamics where one needs to repeatedly generate the surface tens of millions of times. The MSMS is known to be very fast in the molecular surface generation. However, the MSMS surface are provided in the Lagrangian form, i.e., in terms of the triangular surface mesh. In Eulerian computations, the Cartesian mesh is used. Therefore, a Lagrangian to Eulerian conversion, which transfers the surface information from the 2D triangular surface mesh to the 3D Cartesian mesh, is required. This conversion can be very time consuming. In our earlier work, a program for converting the triangular surface mesh to the 3D Cartesian mesh was developed to provide surface information in solving the Poisson Boltzmann equation.82 This program is used in the present work. The surface generated by the present PDE transform is directly recorded in the 3D Cartesian mesh. Therefore, no additional Lagrangian to Eulerian conversion is required. Table 1 provides the details of the CPU time during the whole process of the surface information generation for four different Cartesian mesh sizes: 0.25, 0.5, 0.75 and 1.0 Å. By surface information, we mean three components: identifying points inside and outside the protein, locating and recording the intersection points (the surface points which intersect with the mesh lines), and extracting the normal direction at each intersection point. In Table 1, Ttot denotes the time for the surface information generation. For the MSMS approach, Ts represents the time for MSMS surface generation presented in the triangular surface mesh, and Tc represents the time to convert the 2D triangular surface mesh into the 3D Cartesian mesh. The first column of the table shows the PDB codes of proteins as obtained from the PDB bank. Here Na is the total number of atoms in the protein, which is counted after the PDB2PQR conversion. The third column lists two different methods, one is based on the PDE transform and the other based on the MSMS approach. The reported CPU time is recorded from a departmental workstation cluster which might be subject to the interruption from jobs submitted by other users during the computation. The MSMS surface generation is essentially a 2D process and depends on the output mesh density. Density 10 is used in the present calculation. It is seen from the table that the MSMS surface generation is very fast compared to the generation by using the PDE transform at finer meshes, which is a 3D processing. However, it takes a major effort to convert the MSMS surface mesh into the 3D Cartesian mesh, which is used in most applications. The surface generation time by using the PDE transform depends crucially on the grid size of the Cartesian mesh. For all proteins tested in the present work, the MSMS approach, including its time for the Lagrangian to Eulerian conversion, is slightly more efficient than the PDE transform at the mesh size of 0.25 Å However, at a larger mesh size of h = 0.5Å the PDE transform is generally more efficient than the MSMS approach; and at the mesh sizes of h = 0.75 and 1.0 Å the PDE transform is much faster than the MSMS approach. The efficiency of the PDE transform surface generation promises a potential improvement to the molecular dynamics simulation.26
Table 1.
Comparison of time efficiency (in seconds) for surface generation in Cartesian meshes by the PDE transform and the MSMS approach
| h = 0.25 Å | h = 0.5 Å | h = 0.75 Å | h = 1.0 Å | ||||||||
|---|---|---|---|---|---|---|---|---|---|---|---|
| PDB ID | Na | Method | Ts | Tc | Ttot | Tc | Ttot | Tc | Ttot | Tc | Ttot |
| 1ajj | 519 | PDE transform MSMS |
0.41 | 6.50 | 6.52 6.91 |
2.74 | 0.49 3.15 |
2.70 | 0.21 3.11 |
2.65 | 0.10 3.06 |
| 1bor | 832 | PDE transform MSMS |
0.56 | 8.54 | 9.52 9.1 |
4.02 | 0.67 4.58 |
3.41 | 0.23 3.97 |
3.42 | 0.11 3.98 |
| 1neq | 1187 | PDE transform MSMS |
0.91 | 12.13 | 16.29 13.04 |
6.15 | 1.51 7.06 |
5.95 | 0.34 6.86 |
5.81 | 0.14 6.72 |
| 1a63 | 2065 | PDE transform MSMS |
1.31 | 16.37 | 18.42 17.68 |
9.03 | 2.21 10.34 |
8.23 | 0.47 9.54 |
8.4 | 0.22 9.71 |
| 1a7m | 2809 | PDE transform MSMS |
1.73 | 20.36 | 24.45 22.09 |
9.83 | 2.72 11.56 |
8.99 | 0.60 10.72 |
9.14 | 0.31 10.87 |
| 1beb | 4972 | PDE transform MSMS |
2.38 | 30.1 | 36.57 32.48 |
18.44 | 5.12 20.82 |
16.34 | 1.04 18.72 |
15.92 | 0.58 18.3 |
| 1vng | 8808 | PDE transform MSMS |
5.69 | 46.6 | 55.29 52.29 |
27.15 | 7.26 32.84 |
24.71 | 2.24 30.4 |
22.19 | 0.96 27.88 |
| 1a8r | 52425 | PDE transform MSMS |
10.19 | NA | 976.86 NA |
NA | 132.87 NA |
NA | 36.29 NA |
NA | 14.62 NA |
| 1h2i | 64460 | PDE transform MSMS |
19.36* | NA | 646.99 NA |
NA | 91.91 NA |
NA | 30.66 NA |
NA | 10.1 NA |
| 1gtp | 69980 | PDE transform MSMS |
22.47† | NA | 527.56 NA |
NA | 64.21 NA |
NA | 19.73 NA |
NA | 11.79 NA |
Surface generated at density 1.454.
Surface generated at density 1.546.
We also tested some relatively proteins, i.e., 1a8r, 1h2i and 1gtp that were tested in the literature.28 In the MSMS surface generation process using probe radius 1.4A and density 10, error messages showed up for the 1a8r calculation, and the Lagrangian to Eulerian conversion by using our program82 was failed. For the MSMS surface generation of 1h2i and 1gtp, no triangular surface data were reported due to error messages and segmentation fault. Alternatively, if one allows the MSMS program to automatically define its density and probe radius parameters, triangular surface meshes could be obtained for 1h2i at a small density of 1.454 and probe radius of 1.5Å, and for 1gtp at a small density of 1.546 and probe radius of 1.5Å. However, the Lagrangian to Eulerian conversion still can not be properly performed due to the poor surface quality. For the PDE transform, the surface generation for these large proteins is stable and the corresponding CPU time is reported in Table 1.
IV.B Surface area and surface enclosed volume
In this subsection, the quality of the surface generated by the PDE transform is examined through some quantitative studies of surface area and surface enclosed volume. The performance in these quantitative studies gives an indication of the usefulness of the proposed PDE transform for practical biophysical applications.
To compute surface area and volume in the Eulerian representation, i.e., a 2D surface of a biomolecule embedded in a 3D Cartesian grid, we need a numerical algorithm, which is discussed below. The surface integral of a density function f ∈ ℝ3 can be evaluated by26
| (19) |
where h is the grid spacing size, (xo, yj, zk) is the intersecting point of the interface Γ and the x meshline that passes through (xi, yj, zk), and nx is the x component of the unit normal vector at (xo, yj, zk). Similar notations are used for y and z directions too. Defining irregular grid points as points with a neighbor from the other side of the interface Γ, I is the set of irregular grid points inside or on the interface.26 Furthermore, the volume integral of a density function f is approximated by
| (20) |
where J1 is the set of the points inside Ωm and J2 = J1 ∪ JIrr, where JIrr indicates the set of the irregular points. Let f ≡ 1, then Eq. (19) and Eq. (20) can be applied to compute the surface area and volume, respectively. This approach is second order in accuracy.26
Table 2 lists a comparison of surface areas and surface enclosed volumes for a total of 13 proteins using two types of interfaces: one is constructed by the PDE transform and the other is generated by using the MSMS package.50 MSMS package provides solvent excluded surfaces in the triangulation form and reports surface areas and surface enclosed volumes. It is seen from Table 2 that surface areas and surface enclosed volumes generated by these two approaches compare well, which indicates the proposed PDE transform is useful in biophysical applications.
Table 2.
Comparison of surface areas, surface enclosed volumes and electrostatic free energies of solvation for surfaces generated by the PDE transform and the MSMS package. The grid resolution is 0.5Å.
| MSMS surface | PDE transform surface | |||||
|---|---|---|---|---|---|---|
| PDB ID | Volume (Å3) | Area (Å2) | Energy (kcal/mol) | Volume (Å3) | Area (Å2) | Energy (kcal/mol) |
| 1ajj | 4653.4 | 2166.7 | −1136.5 | 4666.4 | 2124.5 | −1134.1 |
| 1bor | 7139.1 | 2898.0 | −852.6 | 7181.9 | 2832.7 | −841.0 |
| 2pde | 5994.6 | 2715.9 | −820.3 | 6071.4 | 2662.1 | −807.3 |
| 451c | 10874.8 | 4156.3 | −1038.6 | 10917.8 | 4050.1 | −1032.9 |
| 1svr | 11961.9 | 4644.0 | −1709.7 | 11979.9 | 4588.1 | −1703.5 |
| 1a7m | 24025.1 | 7733.6 | −2155.2 | 24103.9 | 7524.7 | −2135.1 |
| 1vii | 5050.7 | 2476.2 | −900.4 | 5084.7 | 2404.7 | −890.0 |
| 1vjw | 7693.2 | 2785.8 | −1237.3 | 7618.6 | 2851.3 | −1238.5 |
| 1uxc | 6791.4 | 2835.5 | −1137.7 | 6842.0 | 2785.4 | −1129.3 |
| 1mbg | 7843.3 | 3070.7 | −1348.2 | 7887.7 | 2983.7 | −1339.9 |
| 1ptq | 7121.9 | 2897.4 | −872.3 | 7140.3 | 2831.6 | −870.0 |
| 1sh1 | 6400.7 | 2743.8 | −754.2 | 6410.7 | 2683.9 | −749.1 |
| 1hpt | 7660.9 | 3262.9 | −811.1 | 7699.4 | 3186.3 | −810.1 |
V Applications
As discussed in the Introduction, the solvent-solute interface is a crucial element in the implicit solvent models,1,4 electrostatic calculations,27 solvation analysis,17 molecular dynamics simulations,26 diffusion analysis79,81 and the differential geometry based solvation models.62 Furthermore, it is the starting point to discern the function from geometric structures.7 The surface generation provides the boundary of the protein region, which is defined as the interface between the solvent region and the protein region.
In this section, we apply the PDE transform surfaces to the electrostatic analysis of proteins. The Poisson-Boltzmann model is utilized for this purpose in the present work, although other implicit solvent models, such as generalized Born, can be similarly used. The Poisson-Boltzmann equation reduces to the Poisson equation when there is no ion in the solvent. Electrostatic solvation free energies and electrostatic surface potentials of proteins are evaluated. These properties are important for understanding a wide variety of applications in biophysics and molecular biology. Charge transport analysis is an important approach for a number of applications, including ion channel studies, reaction rate estimation, binding site specification. We carry out this analysis by applying PDE transform surfaces to the Poisson-Nernst-Planck model. Finally, we consider the construction of viral surfaces, which involves excessively large number of atoms.
V.A Electrostatic analysis
Once the surface has been generated, the electrostatic potential can be calculated according to the Poisson equation13,27,71
| (21) |
where qβ are the (fractional) charges of atoms at position rβ(β = 1, 2,⋯,Na). The dielectric function ε is defined as a piecewise constant
| (22) |
where εm = 1 and εs = 80 are the dielectric constants in the molecular and solvent regions, respectively. Equation (21) is a typical elliptic interface problem with discontinuous coefficients and singular sources, i.e., Dirac delta functions. It is very difficult to construct second order convergent methods for this equation in the biomolecular context due to the geometric complexity, non-smooth interface, and singular charge sources.13,27,71
To remove the Dirac delta functions, the Green’s function formulation is employed.27 In this approach, one splits ϕ into the regular part ϕ̃(r) and the singular part ϕ̄(r), i.e. ϕ = ϕ̃ + ϕ̄, where ϕ̄(r) is defined only in Ωm.18,27 The singular part can be further written as the sum of two terms, ϕ̄(r) = ϕ*(r) + ϕ0(r).
The first term ϕ*(r) is the Green’s function which can be analytically written as
| (23) |
To compensate the values induced by the Green’s function ϕ* on the interface Γ, the second term ϕ0(r) satisfies the following Laplace equation with a Dirichlet boundary condition
| (24) |
The regular part ϕ̃ of the electrostatic potential satisfies the homogeneous Poisson equation with a modified Neumann condition at the biomolecular interface.27
| (25) |
In this work, we use the matched interface and boundary (MIB) method13,72,73,78,83,84 to solve Eq. (25). The solution of the Poisson equation can be used for the calculation of electrostatic solvation free energies and for the analysis of electrostatic surface potentials. In the following contents, the electrostatic potential is computed in units of kBT/ec, and the energy is in units of kcal/mol.
Electrostatic solvation free energy
By definition, the solvation free energy is obtained by
| (26) |
where ϕ and ϕhomo correspond to the electrostatic potentials in the inhomogeneous and homogeneous environments respectively. Based on the decomposition of ϕ, the solvation energy can be calculated by27
| (27) |
The MIB method is used for computing the electrostatics potential values and the electrostatic solvation free energy based on MSMS surfaces. The corresponding results are also shown in Table 2. From the table, it is seen that the surfaces generated by the PDE transform lead to similar results comparing to those of the surfaces generated by the MSMS. Moreover, it can be noticed that surface volumes are slightly larger for those of PDE transform surfaces, which results in relatively smaller (in magnitude) electrostatic solvation free energies.
Electrostatic surface potential
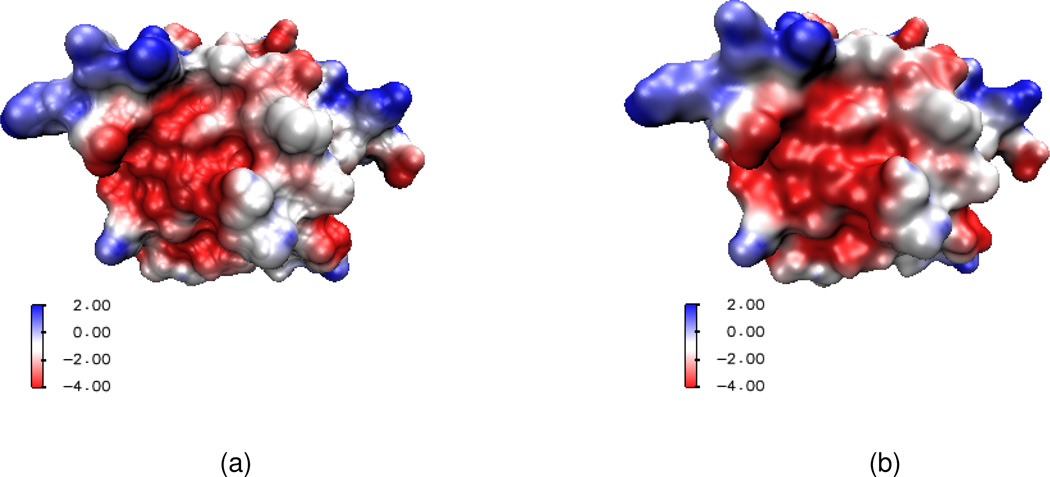
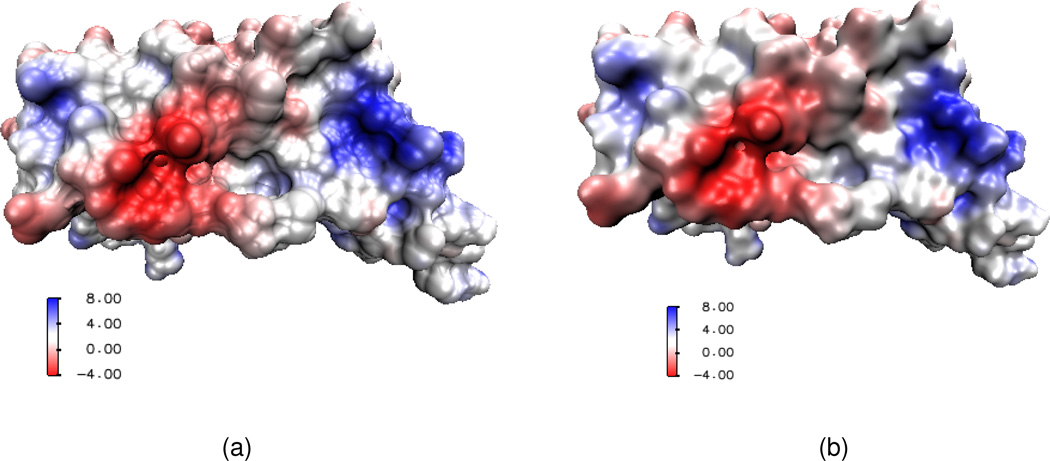
We next consider the electrostatic surface potential, which is useful in the understanding of protein-protein interaction, drug design target, DNA specification, etc. We compute the electrostatic potential by solving the Poisson equation and map the potential on a surface with the VMD software package. Two protein molecules, 1svr and 1a7m, are selected in our analysis. Our results are compared with those of the MSMS surfaces. As shown in Table 2, for each of these two proteins, the electrostatic free energies of two surfaces agree very well. It can be seen from Figs. 12 and 13 that surface electrostatic potentials produced by two surface models give a very good match too. However, visually, the surfaces generated by the present PDE transform appear to be more smooth and have more reasonable morphologies. Specifically, in Fig. 13(a), there is a sharp tip in the cavity region of the solvent excluded surface. Whereas, as shown in Fig. 13(b), the PDE transform surface does not create unphysical geometric singularities.
Figure 12.
Electrostatic surface potentials for protein 1svr mapped on two surfaces. (a) Surface generated by MSMS; (b) Surface generated by the 12th order PDE transform.
Figure 13.
Electrostatic surface potentials for protein 1a7m mapped on two surfaces. (a) Surface generated by MSMS; (b) Surface generated by the 12th order PDE transform.
V.B Charge transport analysis
Charge transport phenomena are extremely common in nano-bio systems. In many continuum models and multiscale models, the computational domain is separated into different subdomains with different physics and governing equations. One major role for the biomolecular surfaces is to define the boundary of the solute region or ion exclusion region, i.e., the interface between the solvent and solute region. Here, we devise the surfaces generated by PDE transform for charge transport analysis.
One of the most popular models is the Poisson-Nernst-Planck (PNP) equations, which has a wide variety of applications, including ion channel system, electrochemical diffusion, etc. The PNP model employs the mean-field theory for describing the electrostatic potential via the Poisson equation and the Nernst-Planck theory description of electrodiffusion of ions in the biological environment. We utilize PDE transform surfaces to describe interface between solvent and biomolecule. The electrostatic potential profile Φ(r) is determined by the Poisson equation
| (28) |
where qβ is the (fractional) charge of the protein at position rβ(β = 1, 2,…,Na), qα and Cα are respectively the charge and concentration of the αth ionic species (α = 1, 2, …,Nc). Constants Na and Nc are, respectively, the number of charged atoms in the biomolecule, and the number of ionic species in the solvent. The Nernst-Planck equation describes the rate of change of the concentration of each ion species due to the concentration flux
| (29) |
where the concentration flux is defined by
| (30) |
Here constants kB and T are, respectively, the Boltzmann constant and the absolute temperature, Dα(r) is the spatially dependent diffusion coefficient of species α.
On the interface Γ, the Poisson equation (28) satisfies the jump conditions
| (31) |
where εm and εs are the dielectric functions in the molecular and solvent regions, the superscripts in Φm and Φs indicate Φ is defined in Ωm and Φ is defined in Ωs, n = (n1, n2, n3) is the outward normal direction of the interface. Physically there is no ion penetration through the interface Γ, one simply requires that the flux vanishes on Γ, that is
| (32) |
As observed from Eq. (31) and Eq. (32), the implementation relies on the definition of the interface Γ. The PDE transform surface serves as the interface Γ during the solution of the Poisson-Nernst-Planck equation.
Based on the MIB technique, we have developed a second order convergent algorithm for solving the PNP equations.79 Here, we utilize this algorithm and the surface generated by the PDE transform to compute the electrostatic potential and concentration profiles of protein 1ajj. To test accuracy, we have designed analytical test solutions for the PNP equations with biomolecular surfaces79
| (33) |
| (34) |
| (35) |
where ϕ* is given by Eq. (23) with all point charges from the CHARMM force field of protein 1ajj.
Errors of our calculation are listed in Table 3. Second order convergence is observed in both L∞ norm and L2 norm, which serves as an indication of good surface quality. At equilibrium, the electrostatic potential computed with the PNP equations is similar to that obtained with the Poisson-Boltzmann model.81 In the present case, it is given by Eq. (33). Therefore, we refrain from offering its illustration.
Table 3.
Numerical errors in solving PNP equations for surfaces of protein 1ajj.
| Numerical errors | |||||
|---|---|---|---|---|---|
| Mesh size (Å ) | L∞ | L∞ order | L2 | L2 order | |
| h = 1.0 | 9.43E-002 | — | 6.43E-003 | — | |
| Φ | h = 0.5 | 9.43E-002 | 2.0107 | 1.59E-003 | 2.0158 |
| h = 0.25 | 5.95E-003 | 1.9755 | 3.99E-004 | 1.9946 | |
| h = 1.0 | 6.16E-002 | — | 6.10E-003 | — | |
| C1 | h = 0.5 | 8.19E-003 | 2.9110 | 1.44E-003 | 2.0827 |
| h = 0.25 | 2.02E-003 | 2.0195 | 3.54E-004 | 2.0242 | |
| h = 1.0 | 3.50E-002 | — | 3.29E-003 | — | |
| C2 | h = 0.5 | 5.14E-003 | 2.7675 | 7.59E-004 | 2.1159 |
| h = 0.25 | 1.14E-003 | 2.1727 | 1.84E-004 | 2.0444 | |
V.C Virus surface generation
Surface generation of excessively large biomolecules, such viruses, is relatively difficult. Recently, we have developed the geometric flow approach for viral surface construction.12 In the present work, we apply our PDE transform method for viral surface generation.
Viral surfaces usually contain from tens of thousands to tens of millions of atoms, depending on viral species. Many viruses make use of symmetry to reduce genome size and increase stability. The same symmetry can be utilized to reduce the data size during the surface construction. To further reduce the data size, one can make use of coarse-grained models, in which each amino acid can be represented by one or a few super-atoms.12 These techniques are also employed in the present study.
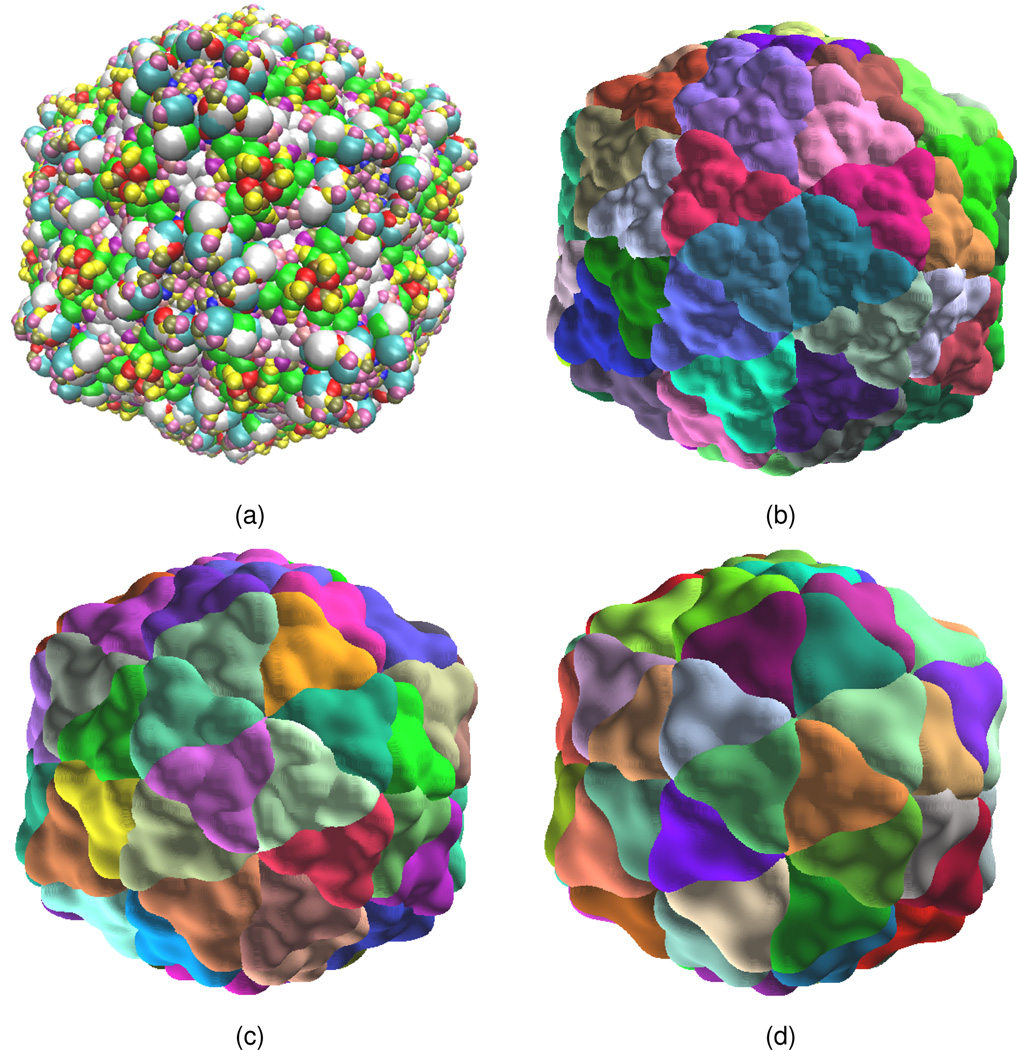
We consider the rice yellow mottle virus, a major pathogen that dramatically reduces rice production in many African countries. Its structure has an icosahedral symmetry. Its atomic coordinates are obtained from the Protein Data Bank (PDB ID: 1f2n).37 Based on the surface patch generated by the PDE transform, we compute its unit normal direction as , where u is a surface function,17 by using the points on the surface which intersects with the mesh lines. Then according to the symmetric information recorded in the pdb file, the surface patch is extended to the whole virus domain. We have generated virus surface patches with three propagation lengths, i.e., t = 104, t = 105 and t = 106, and the resulting virus surfaces are shown in Figs. 14(b)–(d). It is interesting to note that these virus surfaces demonstrate different resolutions of the same virus. Therefore, our PDE transform is able to provide a multiresolution analysis in surface visualization. As a comparison, one of VMD representations is illustrated in Fig. 14(a).
Figure 14.
Surfaces of virus 1f2n. (a) VMD surface constructed via symmetry (colors indicate amino acid residues); (b) PDE transform surface constructed via symmetry (t = 104, 2m = 6, colors indicate symmetric elements); (c) PDE transform surface constructed via symmetry (t = 105, 2m = 6, colors indicate symmetric elements); (d) PDE transform surface constructed via symmetry (t = 106, 2m = 6, colors indicate symmetric elements);.
VI Concluding remarks
Mode decomposition is an elementary task in signal and image processing. A new approach, partial differential equation (PDE) transform, was proposed recently for mode decomposition.59,60 Like the wavelet transform, the PDE transform is able to decompose signal, image, and data into intrinsic modes and functional modes, such as trend, texture, edge, noise, feature, etc. Additionally, the PDE transform makes use of arbitrarily high order PDEs to achieve the desirable time-frequency localization and tunable frequency precision in a very robust way. In the present work, we explore the use of the PDE transform for the generation of biomolecular surfaces, which are crucial components in the implicit solvent models,27 charge transport models79 and differential geometry based multiscale models62 for biomolecular systems. These models have a wide variety of applications in biophysics and molecular biology.
We first give a different derivation of the total variational formulation of the arbitrarily high order PDEs. Additionally, we propose a fast Fourier transform algorithm to implement the present PDE transform for surface construction. Moreover, we consider two types of initial values, ones generated by using Gaussian functions, and ones by using piece-wise constants. We found that although both initial values work well, the piece-wise constant initial values deliver better results. It is noticed that biomolecular surfaces generated via a direct isosurface extraction from Gaussian functions located atomic centers may have a very low regularity. Consequently, they may not be suitable for surface meshing and biophysical applications. Further, we examine the impact of PDE orders in the PDE transform on the surface morphology. It is found that high order PDE transforms are very useful in surface generations. We also test the effect of the PDE integration time on the surface formation. A proper combination of the PDE oder and integration time is required to deliver good quality surfaces, which maintain biomolecular traits, are free of geometric singularities and have a good resolution. Furthermore, we validate the proposed method by computational efficiency and quantitative analysis of surface areas and surface enclosed volumes of a set of test proteins. Finally, the present surface generation approach is applied to a number of problems.
In the validation analysis, biomolecular surfaces of 13 proteins are generated by using the PDE transform. Quantitative analysis is carried out on the surface areas and surface enclosed volumes in the present study. As an additional validation, we have compared our results with those of an established method, the solvent excluded surface47 implemented by the MSMS package.50 Very good consistency is observed. We choose a set of 10 proteins to test computational efficiency for the surface generation in the Cartesian mesh. The present surface generation method is more efficient than the MSMS approach at mesh sizes larger than 0.5Å, while less efficient at mesh sizes less than 0.25Å. The present method is more stable than the MSMS approach for proteins of tens of thousands atoms. To further validate the proposed PDE transform approach for biomolecular surface construction, we considered electrostatic solvation analysis via the Poisson-Boltzmann model. Electrostatic solvation free energies of 13 proteins are computed with the Poisson equation model based on our new surfaces. Our results compare well with those of solvent excluded surfaces. Electrostatic surface potentials are mapped on to our new surfaces. Compared with surfaces generated by the MSMS, the PDE transform surfaces have better visual effects for electrostatic surface potentials. In another application, we have solved the Poisson-Nernst-Planck equations defined on our PDE transform surface of protein 1ajj. Second order convergent numerical methods based on matched interface and boundary (MIB) are utilized in computation. Finally, we have demonstrate the ability of the proposed method for the surface construction of excessively large biomolecules, namely, viral capsids. Both coarse-graining and symmetry techniques are utilized to reduce data size and improve the computational capability. We show that the present PDE transform has the ability to offer a multiresolution analysis in virus surface visualization. Our extensive numerical validation and application indicate that the proposed PDE transform offers a feasible, robust and efficient new approach for the construction of macromolecular surfaces.
While our previous work on the molecular surface generation1,4 relies on the second order nonlinear PDE and the surface evolution is subject to the constraint of the VDW surface; the present work explores the impact of high order PDEs on the surface generation and the surface evolution starts from the VDW surface embedded in 3D Cartesian meshes without any constraints. Consequently, the high order linear PDEs are solved by using the FFT, which leads to computational efficiency. In fact, previous nonlinear PDE methods are able to embed geometric information such that the minimal molecular surface can be created.4 In contrast, the present approach based on the FFT does not preserve geometric information, although other computational techniques might be resorted to enforce the geometric constraint. However, we anticipate computational difficulty in the implementation of high order nonlinear PDE transform.
The present PDE transform based surface generation has a few special features. One feature of the present approach is that it makes use of the fast Fourier transform to avoid direct time integration of high order PDEs. Another feature of the present approach is that the resulting surfaces are given in the Cartesian representation, which is convenient for subsequent electrostatic analysis by using the Poisson-Boltzmann equation or the charge transport evaluation by using the Poisson-Nernst-Planck equations. The other feature of the present approach is that the resulting biomolecular surfaces are of high regularity and free of geometric singularities. Finally, multiresolution representations of a surface can be achieved by adjusting the PDE propagation time with fixed diffusion coefficients.
Acknowledgments
This work was supported in part by NSF grant CCF-0936830, NIH grant R01GM-090208 and MSU Competitive Discretionary Funding Program grant 91-4600.
Literature cited
- 1.Bates PW, Chen Z, Sun YH, Wei GW, Zhao S. Geometric and potential driving formation and evolution of biomolecular surfaces. J. Math. Biol. 2009;59:193–231. doi: 10.1007/s00285-008-0226-7. [DOI] [PubMed] [Google Scholar]
- 2.Bates PW, Wei GW, Zhao S. The minimal molecular surface. arXiv:q-bio/0610038v1. 2006 [q-bio.BM] [Google Scholar]
- 3.Bates PW, Wei GW, Zhao S. Midwest Quantitative Biology Conference. Mackinac Island, MI: Mission Point Resort; 2006. The minimal molecular surface. September 29 – October 1. [Google Scholar]
- 4.Bates PW, Wei GW, Zhao S. Minimal molecular surfaces and their applications. J. of Comput. Chem. 2008;29(3):380–91. doi: 10.1002/jcc.20796. [DOI] [PubMed] [Google Scholar]
- 5.Bergstrom C, Strafford M, Lazorova L, Avdeef A, Luthman K, Artursson P. Absorption classification of oral drugs based on molecular surface properties. J. Medicinal Chem. 2003;46:558–570. doi: 10.1021/jm020986i. [DOI] [PubMed] [Google Scholar]
- 6.Bertozzi AL, Greer JB. Low-curvature image simplifiers: Global regularity of smooth solutions and laplacian limiting schemes. Communications on Pure and Applied Mathematics. 2004;57(6):764–790. [Google Scholar]
- 7.Bhat S, Purisima EO. Molecular surface generation using a variable-radius solvent probe. Proteins: Structure, Function, and Bioinformatics. 2006;62:244–261. doi: 10.1002/prot.20682. [DOI] [PubMed] [Google Scholar]
- 8.Blomgren P, Chan T. Color TV: total variation methods for restoration of vector-valued images. Image Processing, IEEE Transactions on. 1998;7(3):304–309. doi: 10.1109/83.661180. [DOI] [PubMed] [Google Scholar]
- 9.Carstensen V, Kimmel R, Sapiro G. Geodesic active contours. International Journal of Computer Vision. 1997;22:61–79. [Google Scholar]
- 10.Chambolle A, Lions PL. Image recovery via total variation minimization and related problems. Numerische Mathematik. 1997;76(2):167–188. [Google Scholar]
- 11.Chan T, Marquina A, Mulet P. High-order total variation-based image restoration. SIAM Journal on Scientific Computing. 2000;22(2):503–516. [Google Scholar]
- 12.Chen CJ, Saxena R, W G. Wei. Differential geometry based multiscale models for virus formation and evolution. Int. J. Biomed. Imaging. 2010;2010(308627) doi: 10.1155/2010/308627. [DOI] [PMC free article] [PubMed] [Google Scholar]
- 13.Chen D, Chen Z, Chen CJ, Geng WH, Wei GW. MIBPB: A software package for electrostatic analysis. J. Comput. Chem. 2011;32:657–670. doi: 10.1002/jcc.21646. [DOI] [PMC free article] [PubMed] [Google Scholar]
- 14.Chen D, Chen Z, Wei GW. Quantum dynamics in continuum for proton transport II: Varia-tional solvent-solute intersurface. International Journal for Numerical Methods in Biomedical Engineering. 2011 doi: 10.1002/cnm.1458. Submitted, [DOI] [PMC free article] [PubMed] [Google Scholar]
- 15.Chen D, Wei GW. Quantum dynamics in continuum for proton transport I: Basic formulation. Commun. Comput. Phys. 2011 doi: 10.4208/cicp.050511.050811s. Submitted, [DOI] [PMC free article] [PubMed] [Google Scholar]
- 16.Chen Z, Baker NA, Wei GW. Differential geometry based solvation models I: Eulerian formulation. J. Comput. Phys. 2010;229:8231–8258. doi: 10.1016/j.jcp.2010.06.036. [DOI] [PMC free article] [PubMed] [Google Scholar]
- 17.Chen Z, Baker NA, Wei GW. Differential geometry based solvation models II: Lagrangian formulation. J. Math. Biol. 2011 doi: 10.1007/s00285-011-0402-z. pages DOI:10.1007/s00285–011–0402–z. [DOI] [PMC free article] [PubMed] [Google Scholar]
- 18.Chern IL, Liu J-G, Weng W-C. Accurate evaluation of electrostatics for macromolecules in solution. Methods and Applications of Analysis. 2003;10(2):309–28. [Google Scholar]
- 19.Connolly ML. Depth buffer algorithms for molecular modeling. J. Mol. Graphics. 1985;3:19–24. [Google Scholar]
- 20.Corey RB, Pauling L. Molecular models of amino acids, peptides and proteins. Rev. Sci. Instr. 1953;24:621–627. [Google Scholar]
- 21.Crowley P, Golovin A. Cation-pi interactions in protein-protein interfaces. Proteins - Struct. Func. Bioinf. 2005;59:231–239. doi: 10.1002/prot.20417. [DOI] [PubMed] [Google Scholar]
- 22.Didas S, Weickert J, Burgeth B. Properties of higher order nonlinear diffusion filtering. Journal of mathematical imaging and vision. 2009;35(3):208–226. [Google Scholar]
- 23.Dolinsky TJ, Nielsen JE, McCammon JA, Baker NA. PDB2PQR: an automated pipeline for the setup, execution, and analysis of Poisson-Boltzmann electrostatics calculations. Nucleic Acids Research. 2004;32(S2):W665–W667. doi: 10.1093/nar/gkh381. [DOI] [PMC free article] [PubMed] [Google Scholar]
- 24.Dragan A, Read C, Makeyeva E, Milgotina E, Churchill M, Crane-Robinson C, Pri-valov P. Dna binding and bending by hmg boxes: Energetic determinants of specificity. J. Mol. Biol. 2004;343:371–393. doi: 10.1016/j.jmb.2004.08.035. [DOI] [PubMed] [Google Scholar]
- 25.Eisenhaber F, Argos P. Improved strategy in analytic surface calculation for molecular systems: Handling of singularities and computational efficiency. J. Comput. Chem. 1993;14:1272–1280. [Google Scholar]
- 26.Geng WH, Wei GW. Multiscale molecular dynamics using the matched interface and boundary method. J Comput. Phys. 2011;230(2):435–457. doi: 10.1016/j.jcp.2010.09.031. [DOI] [PMC free article] [PubMed] [Google Scholar]
- 27.Geng WH, Yu SN, Wei GW. Treatment of charge singularities in implicit solvent models. Journal of Chemical Physics. 2007;127:114–106. doi: 10.1063/1.2768064. [DOI] [PubMed] [Google Scholar]
- 28.Giard J, Macq B. Molecular surface mesh generation by filtering electron density map. International Journal of Biomedical Imaging. 2010;2010(923780):9. doi: 10.1155/2010/923780. pages, [DOI] [PMC free article] [PubMed] [Google Scholar]
- 29.Gilboa G, Sochen N, Zeevi YY. Forward-and-backward diffusion processes for adaptive image enhancement and denoising. IEEE Transactions on Image Processing. 2002;11(7):689–703. doi: 10.1109/TIP.2002.800883. [DOI] [PubMed] [Google Scholar]
- 30.Gilboa G, Sochen N, Zeevi YY. Image sharpening by flows based on triple well potentials. Journal of Mathematical Imaging and Vision. 2004;20(1–2):121–131. [Google Scholar]
- 31.Gogonea V. Implementation of solvent effect in molecular mechanics 1 EOsawa model development and analytical algorithm for the solvent -accessible surface area. Supramol. Chem. 1994;3:303–317. [Google Scholar]
- 32.Greer JB, Bertozzi AL. H-1 solutions of a class of fourth order nonlinear equations for image processing. Discrete and Continuous Dynamical Systems. 2004;10(1–2):349–366. [Google Scholar]
- 33.Greer JB, Bertozzi AL. Traveling wave solutions of fourth order PDEs for image processing. SIAM Journal on Mathematical Analysis. 2004;36(1):38–68. [Google Scholar]
- 34.Jackson R, Sternberg M. DNA binding and bending by HMG boxes: Energetic determinants of specificity. J. Mol. Biol. 1995;250:258–275. doi: 10.1016/j.jmb.2004.08.035. [DOI] [PubMed] [Google Scholar]
- 35.Jin ZM, Yang XP. Strong solutions for the generalized Perona-Malik equation for image restoration. Nonlinear Analysis-Theory Methods and Applications. 2010;73(4):1077–1084. [Google Scholar]
- 36.Kuhn L, Siani MA, Pique ME, Fisher CL, Getzoff ED, Tainer JA. The interdependence of protein surface topography and bound water molecules revealed by surface accessibility and fractal density measures. J. Mol. Biol. 1992;228:13–22. doi: 10.1016/0022-2836(92)90487-5. [DOI] [PubMed] [Google Scholar]
- 37.Lawson CL, Dutta S, Westbrook JD, Henrick K, Berman HM. Representation of viruses in the remediated pdb archive. Acta Crystallographica Section D- Biological Crystalography. 2008;64:874–882. doi: 10.1107/S0907444908017393. [DOI] [PMC free article] [PubMed] [Google Scholar]
- 38.LiCata V, Allewell N. Functionally linked hydration changes in escherichia coli aspartate tran-scarbamylase and its catalytic subunit. Biochemistry. 1997;36:10161–10167. doi: 10.1021/bi970669r. [DOI] [PubMed] [Google Scholar]
- 39.Lysaker M, Lundervold A, Tai XC. Noise removal using fourth-order partial differential equation with application to medical magnetic resonance images in space and time. IEEE Transactions on Image Processing. 2003;12(12):1579–1590. doi: 10.1109/TIP.2003.819229. [DOI] [PubMed] [Google Scholar]
- 40.MacKerell J, D A, Bashford D, Bellot M, Dunbrack RJ, Evanseck JD, Field MJ, Fischer S, Gao J, Guo H, Ha S, Joseph-McCarthy D, Kuchnir L, Kuczera K, Lau FTK, Mattos C, Michnick S, Ngo T, Nguyen DT, Prodhom B, Reiher I, E. W, Roux B, Schlenkrich M, Smith JC, Stote R, Straub J, Watanabe M, Wiorkiewicz-Kuczera J, Yin D, Karplus M. All-atom empirical potential for molecular modeling and dynamics studies of proteins. Journal of Physical Chemistry B. 1998;102(18):3586–3616. doi: 10.1021/jp973084f. [DOI] [PubMed] [Google Scholar]
- 41.Mumford D, Shah J. Optimal approximations by piecewise smooth functions and associated variational problems. Communications on Pure and Applied Mathematics. 1989;42(5):577–685. [Google Scholar]
- 42.Osher S, Fedkiw RP. Level set methods: An overview and some recent results. J. Comput. Phys. 2001;169(2):463–502. [Google Scholar]
- 43.Osher S, Rudin LI. Feature-oriented image enhancement using shock filters. SIAM Journal on Numerical Analysis. 1990;27(4):919–940. [Google Scholar]
- 44.Osher S, Sethian J. Fronts propagating with curvature-dependent speed: algorithms based on Hamilton-Jacobi formulations. Journal of computational physics. 1988;79(1):12–49. [Google Scholar]
- 45.Perona P, Malik J. Scale-space and edge-detection using anisotropic diffusion. IEEE Transactions on Pattern Analysis and Machine Intelligence. 1990;12(7):629–639. [Google Scholar]
- 46.Raschke T, Tsai J, Levitt M. Quantification of the hydrophobic interaction by simulations of the aggregation of small hydrophobic solutes in water. Proc. Natl. Acad. Sci. USA. 2001;98:5965–5969. doi: 10.1073/pnas.111158498. [DOI] [PMC free article] [PubMed] [Google Scholar]
- 47.Richards FM. Areas, volumes, packing, and protein structure. Annual Review of Biophysics and Bioengineering. 1977;6(1):151–176. doi: 10.1146/annurev.bb.06.060177.001055. [DOI] [PubMed] [Google Scholar]
- 48.Rudin LI, Osher S, Fatemi E. Proceedings of the eleventh annual international conference of the Center for Nonlinear Studies on Experimental mathematics : computational issues in nonlinear science. Amsterdam, The Netherlands, The Netherlands: Elsevier North-Holland, Inc; 1992. Nonlinear total variation based noise removal algorithms; pp. 259–268. [Google Scholar]
- 49.Rudin LI, Osher S, Fatemi E. Nonlinear total variation based noise removal algorithms. Physica D. 1992;60(1–4):259–268. [Google Scholar]
- 50.Sanner M, Olson A, Spehner J. Reduced surface: An efficient way to compute molecular surfaces. Biopolymers. 1996;38:305–320. doi: 10.1002/(SICI)1097-0282(199603)38:3%3C305::AID-BIP4%3E3.0.CO;2-Y. [DOI] [PubMed] [Google Scholar]
- 51.Sapiro G, Ringach DL. Anisotropic diffusion of multivalued images with applications to color filtering. Image Processing, IEEE Transactions on. 1996;5(11):1582–1586. doi: 10.1109/83.541429. [DOI] [PubMed] [Google Scholar]
- 52.Sethian JA. Evolution, implementation, and application of level set and fast marching methods for advancing fronts. J. Comput. Phys. 2001;169(2):503–555. [Google Scholar]
- 53.Sochen N, Kimmel R, Malladi R. A general framework for low level vision. Image Processing, IEEE Transactions on. 1998;7(3):310–318. doi: 10.1109/83.661181. [DOI] [PubMed] [Google Scholar]
- 54.Soltanianzadeh H, Windham JP, Yagle AE. A multidimensional nonlinear edge-preserving filter for magnetic-resonace image-restoration. IEEE Transactions on Image Processing. 1995;4(2):147–161. doi: 10.1109/83.342189. [DOI] [PubMed] [Google Scholar]
- 55.Spolar RS, Record MT., Jr Coupling of local folding to site-specific binding of proteins to dna. Science. 1994;263:777–784. doi: 10.1126/science.8303294. [DOI] [PubMed] [Google Scholar]
- 56.Sun YH, Wu PR, Wei GW, Wang G. Evolution-operator-based single-step method for image processing. Int. J. Biomed. Imaging. 2006;83847:1–27. doi: 10.1155/IJBI/2006/83847. [DOI] [PMC free article] [PubMed] [Google Scholar]
- 57.Tasdizen T, Whitaker R, Burchard P, Osher S. Geometric surface processing via normal maps. Acm Transactions on Graphics. 2003;22(4):1012–1033. [Google Scholar]
- 58.Wang Y, Wei GW, Yang S-Y. Iterative filtering decomposition based on local spectral evolution kernel. Journal of Scientific Computing. 2011 doi: 10.1007/s10915-011-9496-0. pages DOI: 10.1007/s10915–011–9496–0. [DOI] [PMC free article] [PubMed] [Google Scholar]
- 59.Wang Y, Wei GW, Yang S-Y. Mode decomposition evolution equations. Journal of Scientific Computing. 2011 doi: 10.1007/s10915-011-9509-z. pages DOI: 10.1007/s10915–011–9509–z. [DOI] [PMC free article] [PubMed] [Google Scholar]
- 60.Wang Y, Wei GW, Yang S-Y. Partial differential equation transform – Variational formulation and Fourier analysis. International Journal for Numerical Methods in Biomdeical Engineering. 2011 doi: 10.1002/cnm.1452. page DOI: 10.1002/cnm.1452. [DOI] [PMC free article] [PubMed] [Google Scholar]
- 61.Wei GW. Generalized Perona-Malik equation for image restoration. IEEE Signal Processing Letters. 1999;6(7):165–167. [Google Scholar]
- 62.Wei GW. Differential geometry based multiscale models. Bulletin of Mathematical Biology. 2010;72:1562–1622. doi: 10.1007/s11538-010-9511-x. [DOI] [PMC free article] [PubMed] [Google Scholar]
- 63.Wei GW, Jia YQ. Synchronization-based image edge detection. Europhysics Letters. 2002;59(6):814–819. [Google Scholar]
- 64.Wei GW, Sun YH, Zhou YC, Feig M. Molecular multiresolution surfaces. 2005:1–11. arXiv:math-ph/0511001v1, pages. [Google Scholar]
- 65.Willmore TJ. Riemannian Geometry: Oxford University Press, USA; 1997. [Google Scholar]
- 66.Witelski TP, Bowen M. ADI schemes for higher-order nonlinear diffusion equations. Applied Numerical Mathematics. 2003;45(2–3):331–351. [Google Scholar]
- 67.Witkin A. Scale-space filtering: A new approach to multi-scale description. Proceedings of IEEE International Conference on Acoustic Speech Signal Processing. 1984;9:150–153. [Google Scholar]
- 68.Xu M, Zhou SL. Existence and uniqueness of weak solutions for a fourth-order nonlinear parabolic equation. Journal of Mathematical Analysis and Applications. 2007;325(1):636–654. [Google Scholar]
- 69.Yang SY, Zhou YC, Wei GW. Comparison of the discrete singular convolution algorithm and the fourier pseudospectral methods for solving partial differential equations. Comput. Phys. Commun. 2002;143:113–135. [Google Scholar]
- 70.You Y, Kaveh M. Fourth-order partial differential equations for noise removal. IEEE Transactions on Image Processing. 2002;9(10):1723–1730. doi: 10.1109/83.869184. [DOI] [PubMed] [Google Scholar]
- 71.Yu SN, Geng WH, Wei GW. Treatment of geometric singularities in implicit solvent models. Journal of Chemical Physics. 2007;126:244108. doi: 10.1063/1.2743020. [DOI] [PubMed] [Google Scholar]
- 72.Yu SN, Wei GW. Three-dimensional matched interface and boundary (MIB) method for treating geometric singularities. J. Comput. Phys. 2007;227:602–632. [Google Scholar]
- 73.Yu SN, Zhou YC, Wei GW. Matched interface and boundary (MIB) method for elliptic problems with sharp-edged interfaces. J. Comput. Phys. 2007;224(2):729–756. [Google Scholar]
- 74.Yu Z, Holst M, Cheng Y, McCammon JA. Feature-preserving adaptive mesh generation for molecular shape modeling and simulation. Journal of Molecular Graphics and Modeling. 2008;26:1370–1380. doi: 10.1016/j.jmgm.2008.01.007. [DOI] [PubMed] [Google Scholar]
- 75.Zhang Y, Bajaj C, Xu G. Surface smoothing and quality improvement of quadrilat-eral/hexahedral meshes with geometric flow. Communications in Numerical Methods in Engineering. 2009;25:1–18. doi: 10.1002/cnm.1067. [DOI] [PMC free article] [PubMed] [Google Scholar]
- 76.Zhang Y, Hubner IA, Arakaki AK, Shakhnovich E, Skolnick J. On the origin and completeness of highly likely single domain protein structures. Proc. Natl. Acad. Sci. USA. 2006;103:2605–2610. doi: 10.1073/pnas.0509379103. [DOI] [PMC free article] [PubMed] [Google Scholar]
- 77.Zhang Y, Xu G, Bajaj C. Quality meshing of implicit solvation models of biomolecular structures. Computer Aided Geometric Design. 2006;23(6):510–30. doi: 10.1016/j.cagd.2006.01.008. [DOI] [PMC free article] [PubMed] [Google Scholar]
- 78.Zhao S, Wei GW. High-order FDTD methods via derivative matching for Maxwell’s equations with material interfaces. J. Comput. Phys. 2004;200(1):60–103. [Google Scholar]
- 79.Zheng Q, Chen D, Wei GW. Second-order Poisson-Nernst-Planck solver for ion transport. Journal of Comput. Phys. 2011;230:5239–5262. doi: 10.1016/j.jcp.2011.03.020. [DOI] [PMC free article] [PubMed] [Google Scholar]
- 80.Zheng Q, Chen Z, Wei GW. Variational multiscale models for charge transport I: Basic formulation. submitted. 2011 doi: 10.1137/110845690. [DOI] [PMC free article] [PubMed] [Google Scholar]
- 81.Zheng Q, Wei GW. Poisson-Boltzmann-Nernst-Planck model. Journal of Chemical Physics. 2011;134:194101. doi: 10.1063/1.3581031. [DOI] [PMC free article] [PubMed] [Google Scholar]
- 82.Zhou YC, Feig M, Wei GW. Highly accurate biomolecular electrostatics in continuum dielectric environments. Journal of Computational Chemistry. 2008;29:87–97. doi: 10.1002/jcc.20769. [DOI] [PubMed] [Google Scholar]
- 83.Zhou YC, Wei GW. On the fictitious-domain and interpolation formulations of the matched interface and boundary (MIB) method. J. Comput. Phys. 2006;219(1):228–246. [Google Scholar]
- 84.Zhou YC, Zhao S, Feig M, Wei GW. High order matched interface and boundary method for elliptic equations with discontinuous coefficients and singular sources. J. Comput. Phys. 2006;213(1):1–30. [Google Scholar]


