

Abstract
We have used spin-labeled ADP to investigate the dynamics of the nucleotide-binding pocket in a series of myosins, which have a range of velocities. Electron Paramagnetic Resonance spectroscopy reveals that the pocket is in an equilibrium between open and closed conformations. In the absence of actin, the closed conformation is favored. When myosin binds actin the open conformation becomes more favored, facilitating nucleotide release. We found that faster myosins favor a more closed pocket in the actomyosin•ADP state, with smaller values of ΔH and ΔS, even though these myosins release ADP at a faster rate. A model involving a partitioning of free energy between work generating steps prior to rate-limiting ADP release explains both the unexpected correlation between velocity and opening of the pocket, and the observation that fast myosins are less efficient than slow myosins.
Introduction
Different members of the myosin superfamily move along actin filaments with widely varying velocities. This difference was first characterized in the case of skeletal muscle myosin. Skeletal muscles can be broadly classified into two types: slow twitch, Type I, fibers, and fast twitch, Type II, fibers. The Type I fibers have three- to five-times slower velocities and lower isometric ATPase activities than do the Type II fibers1; 2. The Type I fibers are also more fatigue resistant than Type II fibers3; 4. A similar phenomenon is observed in cardiac muscles where the ventricle fibers are slower than the atrial fibers5. Smooth muscles are generally slower than skeletal or cardiac muscles6. Myosins from insect flight muscles on the other hand are very fast7. A vast difference in velocity is also observed in the nonmuscle myosins. For example, mammalian myosin V has a relatively slow velocity but some plant myosin XIs, while structurally similar to myosin V, can have velocities two orders of magnitude faster8; 9. While the velocity of movement along actin filaments varies widely, the capacity to exert force is relatively constant in different myosins10. The ATPase activity varies with the faster translation velocities associated with higher ATP turnover rates, particularly when bearing high loads as seen in isometric contractions3. The tension cost defined as the amount of ATP required to maintain tension for a given time is thus much lower in slower myosins. Consequently myosins have evolved to either move rapidly or to maintain load economically11.
The difference in function between fast and slow muscle fibers is undoubtedly due to multiple isoforms of a number of different sarcomeric proteins2. The difference in fiber shortening velocity and probably also in isometric ATPase activity, must be due in large part to differences in myosin isozymes, as the variations in fiber velocity are also found for filament translation by purified myosins, as reviewed in12. The slower velocity observed for slower myosins is due to alterations in the rates of a number of reactions. However, there is evidence that a major determinant for velocity is the rate of release of ADP from the Actin•Myosin•ADP (A•M•ADP) complex near the end of the power stroke11; 13. While other steps in the reaction cycle could limit ATPase, sliding velocity is limited by the slowest rate kmin in an attached state. Siemankowski13 compared the rate of ADP dissociation in several different skeletal myosins and concluded that the measured ADP release rate from actomyosin (k−AD) correlates closely to sliding velocity and is slow enough to be the rate limiting step even in fast skeletal myosins. Weiss et al. measured the rates of both ATP binding and ADP release and also concluded that under physiological conditions the ADP release rate k−AD was sufficiently slow to be the limiting factor in shortening14.
Nyitrai et al.11 corrected for numerous systematic errors and again found a good correlation between k−AD and sliding velocity. They suggested a two-step mechanism for the release of ADP from actomyosin. A•M’•ADP <−> A•M•ADP <-> A•M + ADP (figure 1A), in which A•M’•ADP is assumed to be a state with a closed nucleotide pocket and A•M•ADP is open. Nyitrai and Geeves suggested that the closed pocket is favored in slower myosins while the open state is favored in faster myosins15. If this transition is coupled with external force, it provides a mechanism for strain sensing or gating to efficiently conserve ATP in slower muscles.
Figure 1.
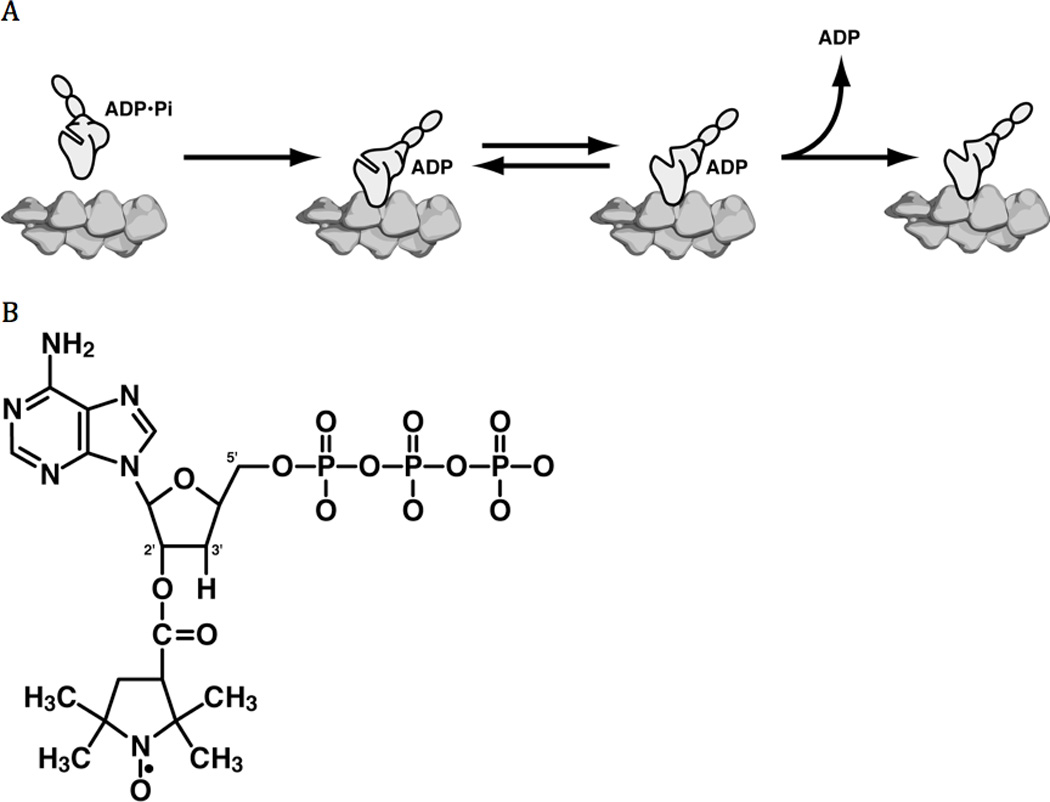
A) Reaction pathway for ADP release from Actomyosin. Panes from left to right (1) Pre-power stroke primed myosin with ADP•Pi binds to actin. (2) Phosphate release and the lever arm swing. (2 and 3) There is an equilibrium between closed and open nucleotide pockets. (4) ADP release occurs from the open state resulting in rigor state. B) The structure of 2’-SLATP.
In this paper we have explored conformational changes in myosin that are thought to be associated with the binding and release of nucleotides. As discussed above the velocity of filament movement is determined by the rate of release of ADP, which is mediated by interaction of the myosin head with actin. By analogy with the G-proteins16, the interaction with actin is transmitted to the nucleotide pocket by a region called switch 1. Electron paramagnetic resonance (EPR) spectroscopy using spin-labeled nucleotide analogs has been shown to be a useful method for monitoring movements of switch 1 in kinesin17; 18 and myosin19. For the spin probe employed, 2’-SLADP, the nitroxide spin label is attached at the 2’-hydroxy of the ribose ring in 3’-deoxyATP (figure 1B). This probe binds at the nucleotide-binding site and is able to sense the surrounding conformation of the protein. Known movements of switch 1 would influence the mobility of the probe.
Nucleotide spin probes have shown decreased mobility when kinesin binds to microtubules and increased mobility when myosin binds to actin17; 18; 19. These results fit into the kinetic schemes of the two motors, with the closing of the kinesin nucleotide pocket promoting nucleotide hydrolysis and the opening of the myosin nucleotide pocket promoting product release. EPR spectroscopy using spin-labeled nucleotide demonstrates that the nucleotide pocket of fast skeletal muscle myosin has two conformations, a closed conformation favored in myosin alone and an open conformation that is favored upon the binding of myosin to actin. An open nucleotide pocket for myosin has also been shown by a variety of techniques. Myosin V crystal structures have shown that the upper 50 kDa domain can move, closing the prominent cleft in the 50 kD domain and moving switch 1 to produce a more open conformation of the nucleotide pocket20. Reconstructions of electron micrographs of the Actin•Myosin complex have shown that this conformational change occurs when myosin binds to actin21.
An opening of the myosin nucleotide pocket upon binding to actin is also reported in Myosin V22, smooth muscle myosin23, and Dictyostelium myosin24, and by a variety of other techniques reviewed in25. Opening of the pocket has also been shown by a functional assay, which showed that ATP analogs with large moieties attached to the gamma phosphate could still bind to myosin26. Together these results strongly suggest that upon binding of myosin to actin, switch 1 opens, allowing more rapid binding and release of nucleotides. Furthermore the spin-labeled nucleotide analogs have shown that the pocket is in an equilibrium between open and closed forms in the actomyosin•ADP complex, with the open conformation favored at higher temperatures19.
Here we have extended our previous EPR studies on the conformation of the nucleotide pocket of myosin to include myosins from both fast and slow muscle types as well as two non-muscle myosins. We have developed more sensitive techniques for quantitating the population of states allowing direct observation of the thermodynamics of the closed to open transition. We show that upon binding to actin, the equilibrium between the open and closed conformations of the myosin nucleotide pocket correlates with the velocity of the myosin. To our surprise, the open conformation of the nucleotide site is favored more strongly in the slower myosin. The observation of a more open pocket in slower myosins is unexpected, as the slower myosins are known to bind ADP more strongly. In addition we find that the values of ΔH and TΔS for the transition are greater for slower myosins. Here we explain the EPR results in terms of a model of the actin-myosin-ADP states that reconciles the EPR observations with the kinetic data, and connects both to the observed correlation between efficiency of doing work and myosin velocity.
Results
EPR results
Figure 2A shows representative EPR spectra of spin-labeled ADP in the presence of slow skeletal myosin. Each spectral component contributes three lines. For the unbound probes in solution, the fast rotational motion produces spin narrowing leading to three very sharp lines, labeled P2, P3 and P4. When the probe binds to the protein its rotational mobility is restricted by the protein surface and the spectral lines are broadened, leading to peaks at the low and high field labeled P1 and P5, respectively. All probes contribute to the central peak, P3. For slow skeletal myosin, shown in Figure 2A, the main bound component has a P1–P5 splitting of 6.2 mT. This splitting was similar in the absence of actin for all myosins studied. The spectra can be modeled by rapid rotational diffusion within a cone of vertex angles defined by the protein surface27; 28. The observed splitting for myosin is consistent with a cone of 35° (half angle).
Figure 2.
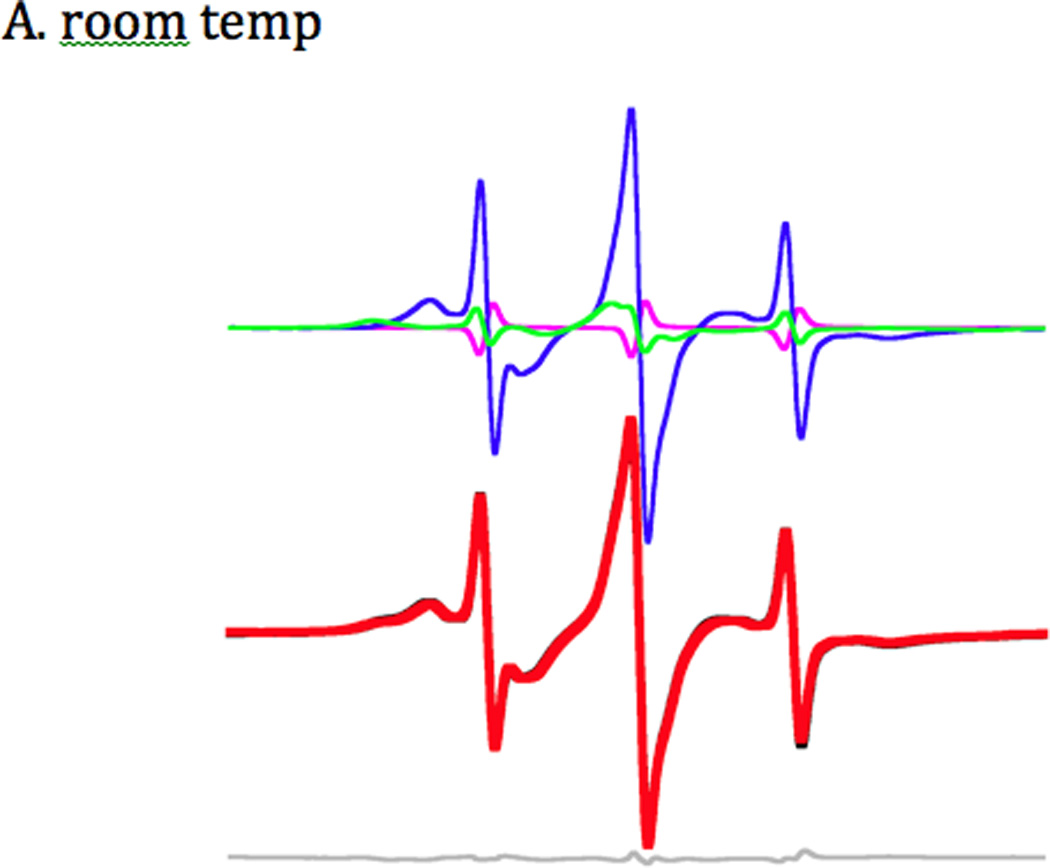
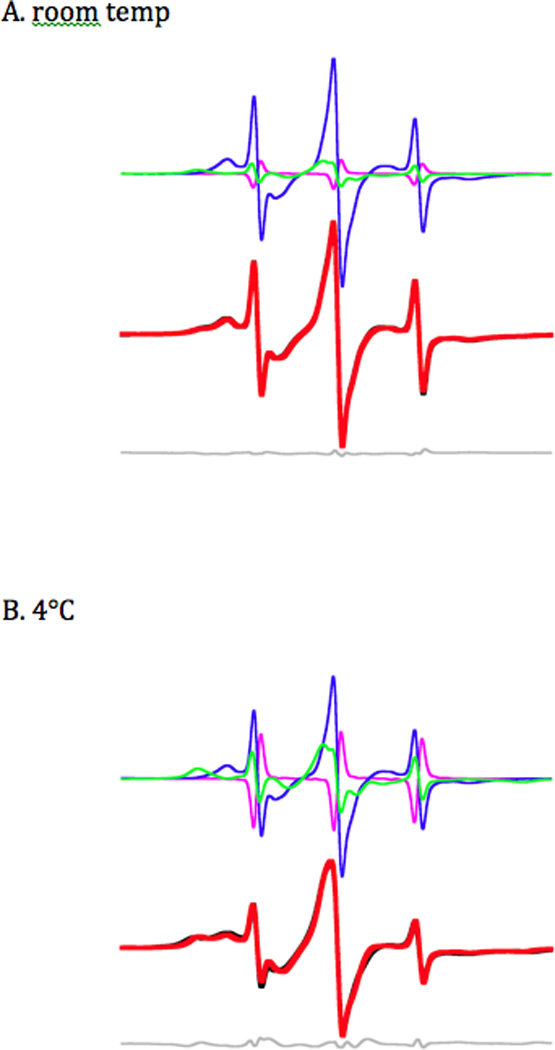
A) EPR spectra from rabbit slow skeletal myosin plus and minus actin. The horizontal axis is magnetic field (10 mT wide with center field at 350 mT). The vertical axis is the derivative of absorbance. The blue trace shows 2’-SLADP with purified slow skeletal myosin in the absence of actin. The red trace is 2’-SLADP on slow skeletal fibers. Unbound spin-labeled nucleotide contributes to peaks P2, P3 and P4. Binding to myosin restricts the motion of the spin-label moiety, causing P2 to move downfield to P1 and P4 to move up-field to P5. The splitting of the outermost peaks is a function of the restriction of motion in the spin label, with the most restricted spin label seen in the absence of actin (blue trace). Binding to actin in the fibers causes the nucleotide pocket to open, resulting in P1 and P5 moving closer together as a result of the greater freedom of movement for the spin label.
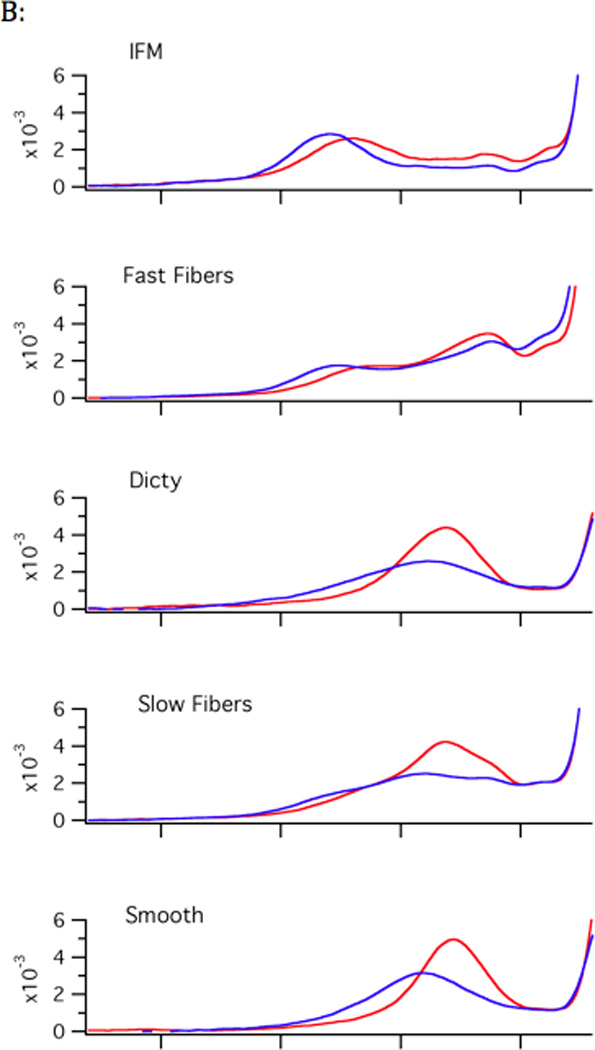
B) Room temperature vs. cold spectra. The low-field segment (P1 component) from room temperature spectra (22–24°C, red traces) and cold spectra (2–4°C, blue traces). In each case, at lower temperatures, there is a greater amplitude on the left hand side, representing decreased mobility of the nucleotide spin probe, implying that the fraction of myosin with a closed nucleotide pocket increases. This figure also shows the correlation for nucleotide pocket to the speed of the myosin. In the fastest myosins, Insect Flight Muscle (IFM) and fast skeletal muscle, the closed fraction is significantly populated, even at room temperature, whereas the open fraction dominates slow myosins such as smooth and slow skeletal.
In the presence of actin, the bound component has a more narrow P1–P5 splitting of 5.3 mT indicating that the nucleotide pocket has opened, consistent with rotational diffusion within a more open cone with a vertex angle of 51° (Figure 2A). Additionally, the spectra show that although the main low-field component is changing, the low-field component also retains a shoulder indicating a mix of more and less mobile probes. This indicates an equilibrium between open and closed conformations of the nucleotide site. Similar data were obtained using a panel of different myosins in the actomyosin complex. The low-field components of the different EPR spectra are shown in Figure 2B.
Deconvolution
Deconvolution allows quantitative measurement of the occupancy of the closed and open components of the spectra. Spectra representing open and closed myosin nucleotide pockets were obtained by differential subtraction. The number of available spectra for quantitative analysis varied with myosin isoform. Depending upon the isoform, 16 to 81 spectra that had primarily open nucleotide pockets as reported by probe mobility were averaged together and then subtracted from 25 to 42 averaged spectra with a primarily closed bound nucleotide pocket. The normalized difference results in a spectrum that has no spectral intensity corresponding to the more mobile bound probes, which represent the open nucleotide-pocket component. Instead the difference spectrum has intensity from more immobile probes representing the closed nucleotide-pocket component of the spectrum and also from the three sharp P2–P4 components from unbound probe free in solution. The inverse subtraction results in a spectrum representing only the open nucleotide pocket and the unbound probe components. The bound fraction of each representative spectrum was calculated by comparison to unbound spin-labeled nucleotide EPR spectra obtained in the absence of protein. Experimental spectra were then fit by a least squares minimization to a linear sum of three representative spectra: open, closed and free (figure 3). Double Integration of the component spectra yields the fractional occupancy of each component.
Figure 3. Deconvolution fast skeletal actomyosin.
Representative spectra for closed (green), open (blue) and unbound (magenta) are summed to create a least-squares best-fit spectrum (red, middle panel) to the experimental spectra (black, middle panel) with the residual shown in grey below. The open and closed representative spectra are a combination of bound and free spectra, so the pure free spectrum is actually subtracted in some cases to compensate for the fraction of free nucleotide in the experimental spectrum.
Once the population of each spectral component has been determined as described above, the equilibrium constant Keq can be determined from a single spectrum. Values of Keq were used to calculate the free energy of the closed-to-open transition ΔG0 = −RT ln Keq. Determination of ΔG0 as a function of temperature was used to determine ΔH and ΔS. Values for ΔG, below, are given at 25°C.
Under most conditions, myosin with spin-label ADP bound shows a mixture of open and closed states. In rabbit fast skeletal muscle myosin in the absence of actin, the closed form is favored, with a ΔG for the closed-to-open transition of 2.0 ± 0.1 kJ mol−1. In the presence of rabbit skeletal actin, the closed-to-open transition becomes favorable, with a ΔG of −1.1 kJ mol−1.
ΔG correlation to speed
An advantage of using spin-labeled nucleotides is that they can be used in any myosin that can be obtained in sufficient quantities for EPR spectroscopy. Rabbit slow skeletal myosin also showed a closed nucleotide pocket in the absence of actin (ΔG =1.9 kJ mol−1). For slow actomyosin, the open nucleotide state becomes greatly favored, ΔG =−3.9 kJ mol−1. Surprisingly, slow muscle with an unloaded sliding velocity of 1.6 µm s−1 has a greater propensity for an open conformation of the nucleotide pocket compared with fast skeletal myosin (4.7 µm s−1) (both values of velocity were measured using skinned rabbit skeletal muscle fibers). Because faster myosin has a faster ADP release rate, we anticipated that the open nucleotide pocket conformation would be more energetically favored rather than less occupied as seen in our data.
In order to see if an increased velocity was the key correlative factor for this observation, we extended our analysis to other myosins with a range of speeds. We examined pig cardiac muscle, including atrial (fast, 2.7 µm s−1, 5) and ventricle (slow, 1.3 µm s−1, 5). These tissues recapitulated the trend seen in fast and slow skeletal muscle, with the ΔG for fast atrial at −1.9 kJ mol−1 and slow ventricle at −3.9 kJ mol−1. Smooth muscle from chicken gizzard is slower (0.67 µm s−1)29 than slow skeletal and cardiac. Purified chicken gizzard myosin bound to actin shows a very open nucleotide pocket with a ΔG of −3.8 kJ mol−1. Similar results were obtained in expressed recombinant motor domain with essential light chain alone bound to actin. The correlation extends to faster muscle myosins as well. Even in the actomyosin state, in Drosophila melanogaster indirect flight muscle (in vitro motility of 6.4 µm s−1) the ΔG for the closed to open transition is +2.9 kJ mol−1.
In addition we looked at non-muscle myosins. For velocity, we used the in vitro motility rate as an analogue of unloaded sliding velocity. Baculovirus expressed chicken Myosin V is a slow myosin with an in vitro motility rate of 0.3 µm s−18 and it has an open nucleotide pocket when bound to actin, ΔG= −3.9 kJ mol−1. Expressed Dictyostelium myosin II is intermediate between fast and slow skeletal myosins (2.4 µm s−1) and has an intermediate ΔG of −2.4 kJ mol−1 favoring the open nucleotide pocket.
Thus the degree that the nucleotide pocket stays closed in the actomyosin state correlates to sliding velocity (Figure 4). There are several factors that contribute to the sliding velocity for a given myosin, including lever-arm length and other rate limiting steps, which could account for the deviation from a linear relationship. However as we show below, the data suggest a model in which the nucleotide pocket reflects the energy of the actomyosin•ADP (A•M•D) complex and should correlate to the thermodynamics of this complex’s formation.
Figure 4. ΔG vs. in vitro motility.
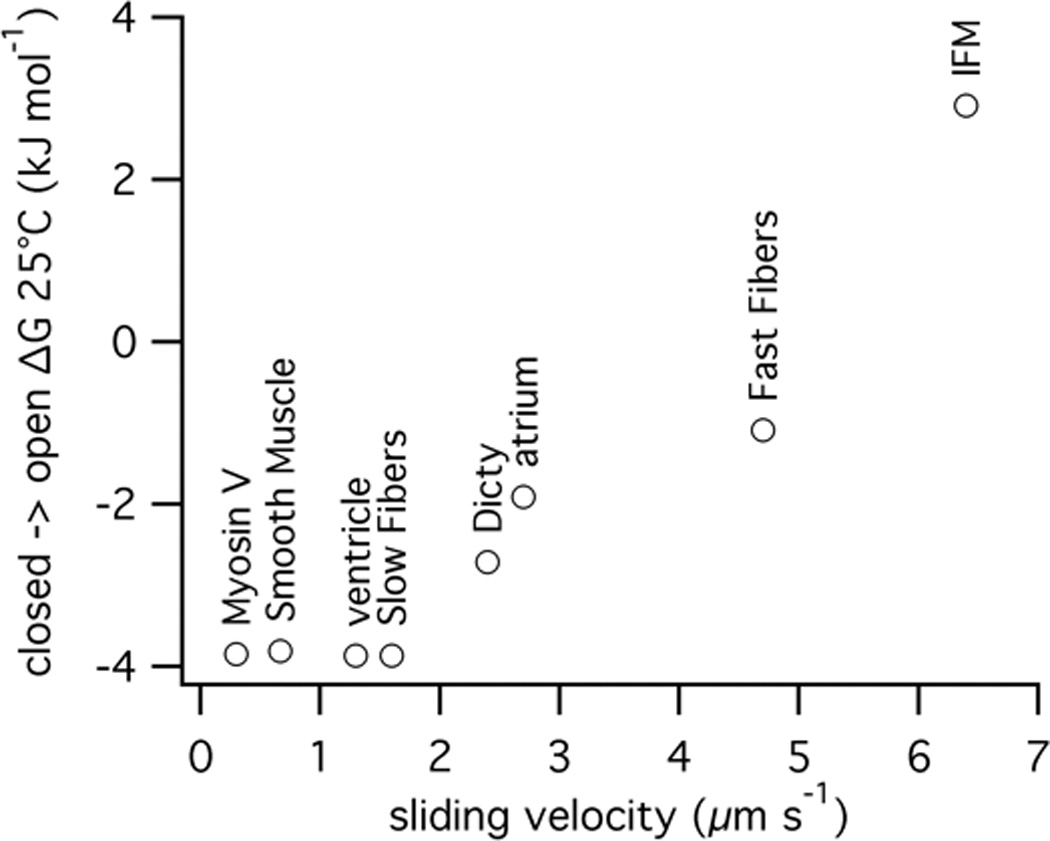
The equilibrium between closed and open nucleotide pocket calculated from EPR data for a range of myosins from slow myosin V to fast insect flight muscle (IFM).
Temperature variation gives ΔH and TΔS
The closed-to-open transition is temperature sensitive. For all of the myosins studied the equilibrium of the actomyosin complex shifts back to favor the closed conformation (figure 2B) as the temperature is lowered. We measured the equilibrium constant as a function of temperature for each of the myosins studied. Plotting the log of the equilibrium constant as a function of reciprocal temperature yields the entropic and enthalpic components by a fit to the linear equation −R ln K = ΔH T−1 − ΔS (figure 5). The magnitudes of ΔH and ΔS indicate a significant conformational change (table 1). For example, the values are of the same magnitude as observed for kinesin neck linker undocking30. Naber19 showed a much larger ΔH (79 kJ mol−1) and ΔS (280 J K−1 mol−1) for fast skeletal acto-S1 however that was 1) with S1 and 2) earlier version of the temperature control that had calibration issues. Near room temperature the ΔG values are close only at low temperatures and they do deviate to increase apparent ΔH and ΔS. The exact nature of the conformational change is difficult to determine from these experiments, whether it’s dynamics in the myosin actin interface or dynamics within the myosin itself.
Figure 5. Representative van’t Hoff plots.
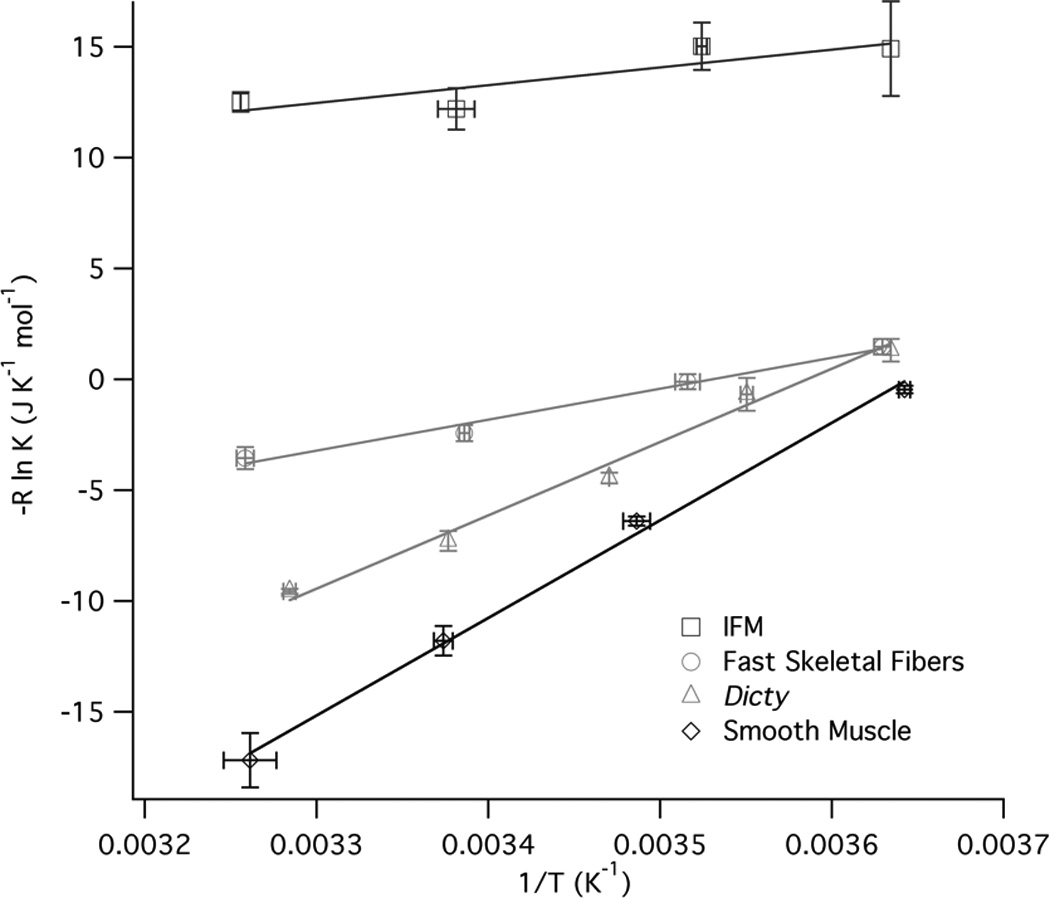
Data for the closed to open transition equilibrium (K) is fit by −R ln K = ΔH (1/T) − ΔS. The fits show that both ΔH and ΔS increase going from faster IFM and fast skeletal fibers to slower Dictyostelium and smooth muscle myosin
Table 1.
| Myosin | Sliding velocity (µm/s) |
ΔG0 25°C * (kJ mol−1) |
ΔH0 (kJ mol−1) | ΔS0 (J mol−1 K− 1) |
|---|---|---|---|---|
| IFM | 6.4 | +2.9 ± 0.1 | 10.4 ± 3.6 | 25 ± 12 |
| Fast Skeletal | 4.7 | −1.1 ± 0.2 | 17.7 ± 2.8 | 63 ± 10 |
| Atrial | 2.7 | −1.9 ± 0.1 | 25.5 ± 5.3 | 92 ± 2 |
| Dicty | 2.4 | −2.7 ± 0.2 | 44.1 ± 1.7 | 157 ± 5 |
| Slow Skeletal | 1.6 | −3.9 ± 0.2 | 50.4 ± 2.2 | 182 ± 8 |
| Ventricle | 1.3 | −3.9 ± 0.2 | 55.5 ± 9.0 | 199 ± 31 |
| Smooth | 0.7 | −3.8 ± 0.1 | 43.9 ± 0.1 | 160 ± 1 |
| Myosin V | 0.3 | −3.9 ± 0.1 | 50.1 ± 2.0 | 181 ± 7 |
Extrapolated from van’t Hoff plot
Discussion
Our previous work with spin-labeled nucleotides has shown that the mobility of bound probes increases when myosin binds to actin, implying that the nucleotide pocket of myosin adopts a more open conformation19. We have interpreted our spectral changes in terms of an opening and closing of the switch 1 region, because this is the region with known structural changes that would be in a position to influence the mobility of our ribose bound probe26. Known movements of Switch 2 would not alter probe mobility. As discussed in the introduction, a variety of techniques agree that the nucleotide pocket of myosin opens upon binding to actin19; 20; 22; 24; 25; 31.
Our previous results showing an opening of the nucleotide pocket upon binding to actin support our findings in light of the above structural interpretation. The bond with actin promotes release of phosphate first and subsequently ADP. Release of ADP would be expected to be enhanced by an open conformation of the nucleotide pocket, weakening the association of ADP. This has been postulated to be the state from which ADP is released in previous kinetic models32. Furthermore a greater population of the open state could be expected to promote more rapid release of ADP, as has also been postulated in previous kinetic models32. Thus the present results, which show that the more open form is favored in slower myosins, is counterintuitive. One would expect slower myosins to favor the closed form to slow the release of ADP. However, we note that the rate of release of ADP is not always correlated with the switch 1 conformation. X-ray structures of kinesin and ncd show an extremely open Switch 1 coupled with very tight binding and a very slow release of ADP. Release of nucleotides from G-proteins is associated with alterations at the nucleotide site to the P-loop and switch regions by guanine exchange factors33.
Our observation that actomyosin•ADP has multiple conformational states is consistent with other kinetic and spectroscopic studies for several myosins studied here, including myosin V34; 35, smooth muscle myosin II36 and Dictyostelium myosin24. The kinetics of Myosin V actomyosin•ADP are consistent with a high- and low-affinity state as measured in Rosenfeld 200534. This could correspond to the open and closed state with a ΔG at 20°C of −3.0 kJ mol−1. Hannemann et al35 also measured a similar apparent equilibrium between high and low affinity states, −3.3 kJ mol−1 at 25°C. Both of these values are close to the equilibrium observed in EPR of −3.0 kJ mol−1 and −3.9 kJ mol−1 for 20°C and 25°C respectively. In the absence of actin, the Hannemann equilibrium Kisom,Mg of +1.3 kJ mol−1 is close to what we observe with EPR in the absence of actin (+0.9 kJ mol−1). This value for ΔG is different from that measured by Rosenfeld (−1.9 kJ mol−1) although both papers agree on the general observation that binding to actin results in a relative increase in the fraction of the open nucleotide pocket. Spectroscopic experiments with smooth muscle myosin II are also consistent with two fluorescent states in the actomyosin•mant-ADP state. At 20°C acto-S1•ADP has a ΔG −0.7 kJ mol−1 compared to our EPR derived value of −3.0 kJ mol−1. Rosenfeld et al36 obtained values strongly favoring the closed form, with a ΔG of +7.6 in the absence of actin, which are greater than found here. They also found the entropy and enthalpy values by van’t Hoff analysis in the absence of actin. The ΔH and ΔS values were 44 kJ mol−1 and 123 J K−1 mol−1 respectively, similar to our values of 44 kJ mol−1 and 160 J K−1 mol−1 that were calculated for actomyosin and 32 kJ mol−1 and 109 J K−1 mol−1 for myosin.
Fluorescence spectroscopy experiments with Dictyostelium myosin also showed evidence for two A•M•ADP states24. Using a construct with a single tryptophan mutant, F239W, in a tryptophan-free background, they found a ΔG of +0.8 kJ mol−1 for ADP binding in the absence of actin at 12°C, close to our own value of +1.0 kJ mol−1 measured by EPR spectroscopy using the same mutant. In summary there are a variety of techniques that agree that the myosin nucleotide pocket has two conformations, with reasonable agreement in the magnitude of the energetic differences between them, given the uncertainties in the methods.
A model to explain the correlation between ΔG and velocity
Below we discuss a model that can explain the unexpected relationship between the open and closed conformations of the nucleotide pocket and ADP release. As with previous models, ADP release occurs only from the open state. In previous models the rate-limiting state in ADP release was the transition from the closed to the open state. Once in the open state, ADP release was fast. If instead, the rate-limiting step is placed between the open state and the rigor state, and the free energy of the open state is varied while keeping the free energies of the closed and ADP-release transition states fixed, the correlation between velocity and ΔG can be explained. The lower the free energy of the open state, relative to the closed state, the more the open conformation of the nucleotide pocket is favored. As seen in figure 6, slow myosin (red) has a lower energy state than the fast myosin (blue) in the A•Mopen•D state. Assuming the ADP-releasing transition state, A•M‡D, is similar in energy for faster and slower myosins, the greater ΔG between the open state and the transition state results in a slower release of ADP. We further show below that this model explains the correlation between ΔG and velocity and makes a connection between both of these observations and the efficiency of performing mechanical work.
Figure 6. Energy Diagram.
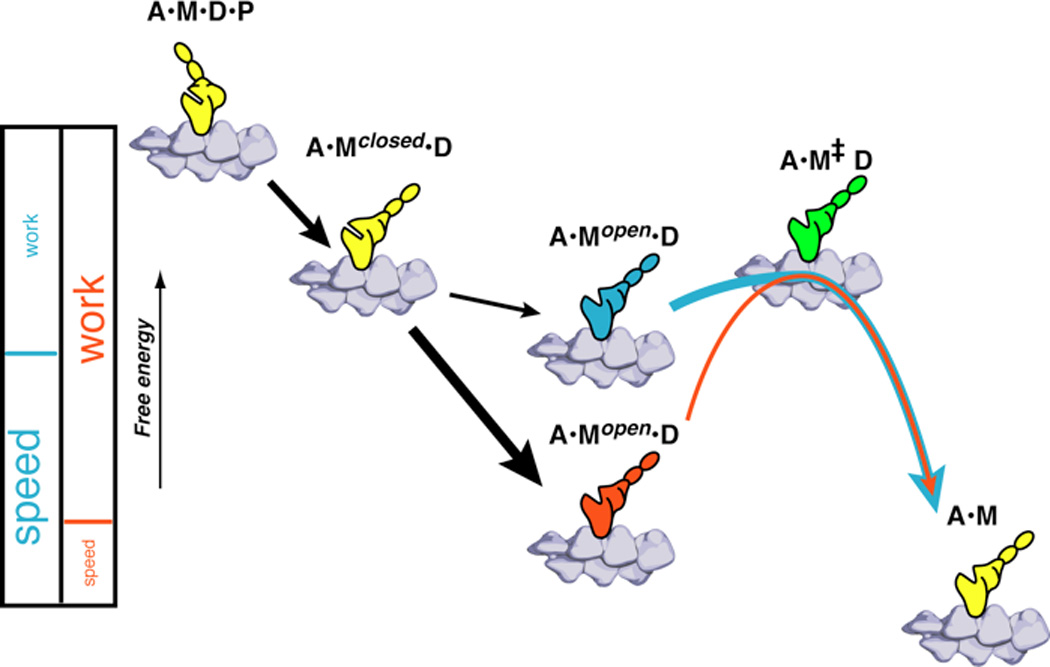
Slow myosin (red) has a lower energy state than the fast myosin (blue) in the A•Mopen•D state. Assuming the ADP releasing transition state A•M‡ D is similar in energy for faster and slower myosins the greater ΔG causes a slower release of ADP. The relationship between speed and efficiency is illustrated by the partitioning between two phases. The steps up to the A•Mopen•D state contribute to the work output of the myosin, the large free energy drop in the slower myosin allows a greater portion of the free energy to be used for work resulting in a more efficient myosin. The faster myosin budgets less energy for the work phases of the stroke but has a greater fraction of energy left over to drive nucleotide release resulting in a faster but less efficient myosin.
As discussed in the introduction, there is a reasonable correlation between velocity and the affinity of ADP for the actomyosin complex, KAD11. Our own measurements, however, relate not directly to the affinity of ADP, but to the relative energies of two A•M•ADP states. The four affinities defining the binding of actin, myosin and ADP to form the A•M•ADP state are related by virtue of being involved in a closed thermodynamic box (figure 7). The affinity values most directly associated with the A•M•ADP state, KAD and KDA, have a stronger correlation with the velocity of the myosin. The coupling coefficient is a measure of the reduction of KAD and KDA compared to KD and KA. Slow myosins have a lower coupling coefficient indicating ADP affinity is high, with or without actin, and actin affinity is high, with or without ADP. On the other hand the coupling coefficient is high in fast myosins indicating that ADP binding is destabilized in actomyosin relative to myosin. If the other states were relatively constant in energy, this would indicate that the A•M•D state is specifically destabilized in faster myosins. In other words the free energy released in the formation of the A•M•ADP complex becomes greater as the velocity decreases. As shown in Figure 6, the free energy measured here, ΔG, reports on the change in energy between the lowest two states of the A•M•ADP complex: AMclosedD to AMopenD. If one assumes, arbitrarily, that the free energy of AMclosedD is reasonably constant with velocity, changes in the free energy of the AMopenD state will determine the overall free energy of the A•M•D state and overall affinity of actomyosin to ADP. Thus, ignoring many other factors, the log of the velocity would correlate inversely to the stabilization of the open state. This model explains three things: the pocket is more open in slower myosins, the affinity of ADP for the A•M complex is greater, and a greater amount of energy is released in the formation of the A•M•ADP complex. This last quantity can be related to muscle efficiency, as discussed below. We also note that the slower myosins are associated with greater values of ΔH and TΔS. If changes in ΔH and TΔS reflect alteration in the size of the protein interface formed in the actomyosin complex, the observed correlations would suggest that a greater amount of protein-protein interface is formed in the open state of the pocket in slower myosins. It is possible that this interface contributes to the lower free energy of the A•M•ADP complex. The collection of myosins at the lowest end of the speed range has approximately the same ΔG for the closed-to-open equilibrium. There might no longer be a way to stabilize the A•M•ADP complex without equally affecting both A•Mclosed•ADP and A•Mopen•ADP states.
Figure 7.
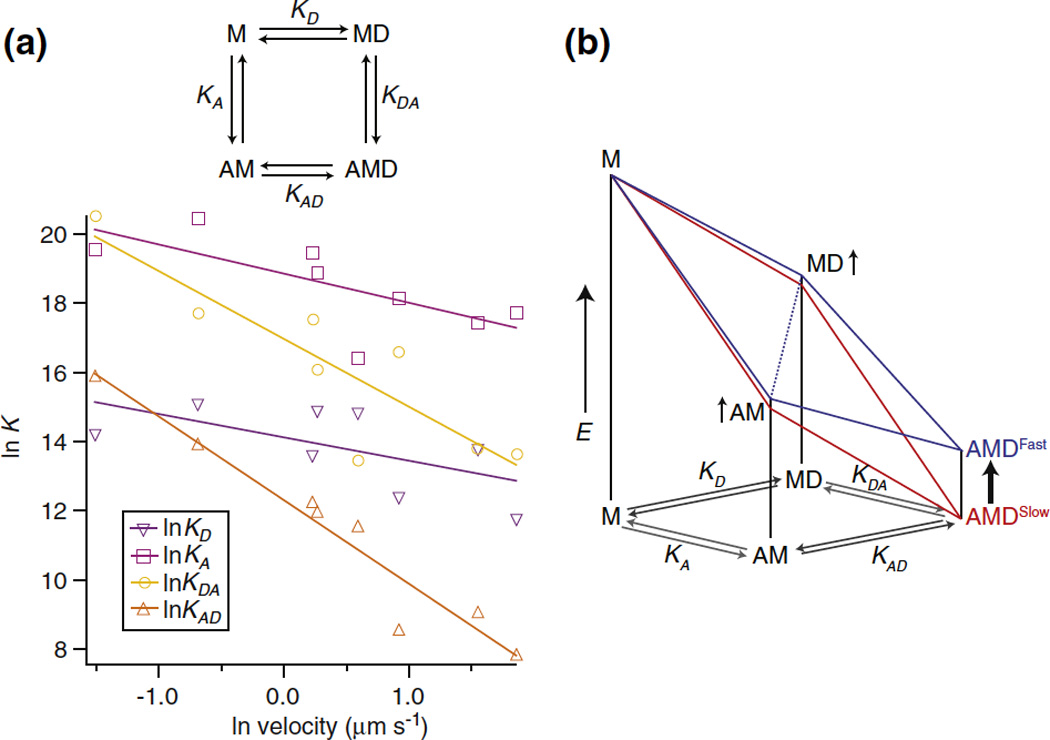
K vs velocity (left panel). Eqilibrium constants estimated from published values (right panel). Log Kapp is proportional to square root of Ionic strength. Part B, data from graph showing difference between fast and slow myosins. Altitude scales relative energy difference proportional to log K. The energy landscape for a fast myosin has a kink in the middle, indicating that the coupling constant relates specifically to destabilization of the AMD state. K values are taken from literature, from slowest to fastest the myosins are Human non-muscle myosin IIB [52], chicken myosin V [53], chicken gizzard smooth muscle myosin II [54], Dictyostelium myosin II [55], Bovine ventricle cardiac myosin II, rabbit slow skeletal muscle (soleus) myosin II [56], rabbit fast skeletal (psoas) myosin II [11], Drosophila flight muscle[57, 58]. Affinities at 100 mM KCl were estimated from published values using equation log K α 5 × √Ionic Strength [59] and corrected to 25°C [60]
Efficiency
There is some evidence that the efficiency of performing mechanical work is greater in slower fibers. This was first determined from a comparison of two vertebrate muscles, frog and tortoise fibers37. In particular this can be seen upon comparison of different muscle types from a given organism, or upon comparison of different isoforms from the same family. For example mouse slow-twitch soleus was reported to have an efficiency of 43% compared to fast twitch EDL with an efficiency of 33%38. A similar correlation is seen with fast and slow muscles of the chicken39. The efficiency of myosin V is estimated from in vitro measurements to approach 100%40. Myosin XI in Tobacco yellow bright-2 cells is another processive myosin that is functionally and structurally similar to myosin V in that it takes 36 nm steps corresponding to the actin pseudorepeat, but has a velocity that is twenty-fold faster than myosin V. For this myosin isoform, the efficiency drops down to 20%9. This correlation further extends across species from very slow muscles such as Tortoise rectus femoris, efficiency of 77%37 and Myosin V, 80%8, to the fastest muscles considered here, Drosophila indirect flight muscle. Drosophila flight muscle (IFM) has an estimated efficiency around 30%41. Significantly, extrapolating the correlation shown in figure 8 out to zero efficiency gives a theoretical maximum velocity for actomyosin of around 50 µm s−1, which is on the order of the fastest observed sliding velocities from plant myosin XI42.
Figure 8. efficiency vs velocity.
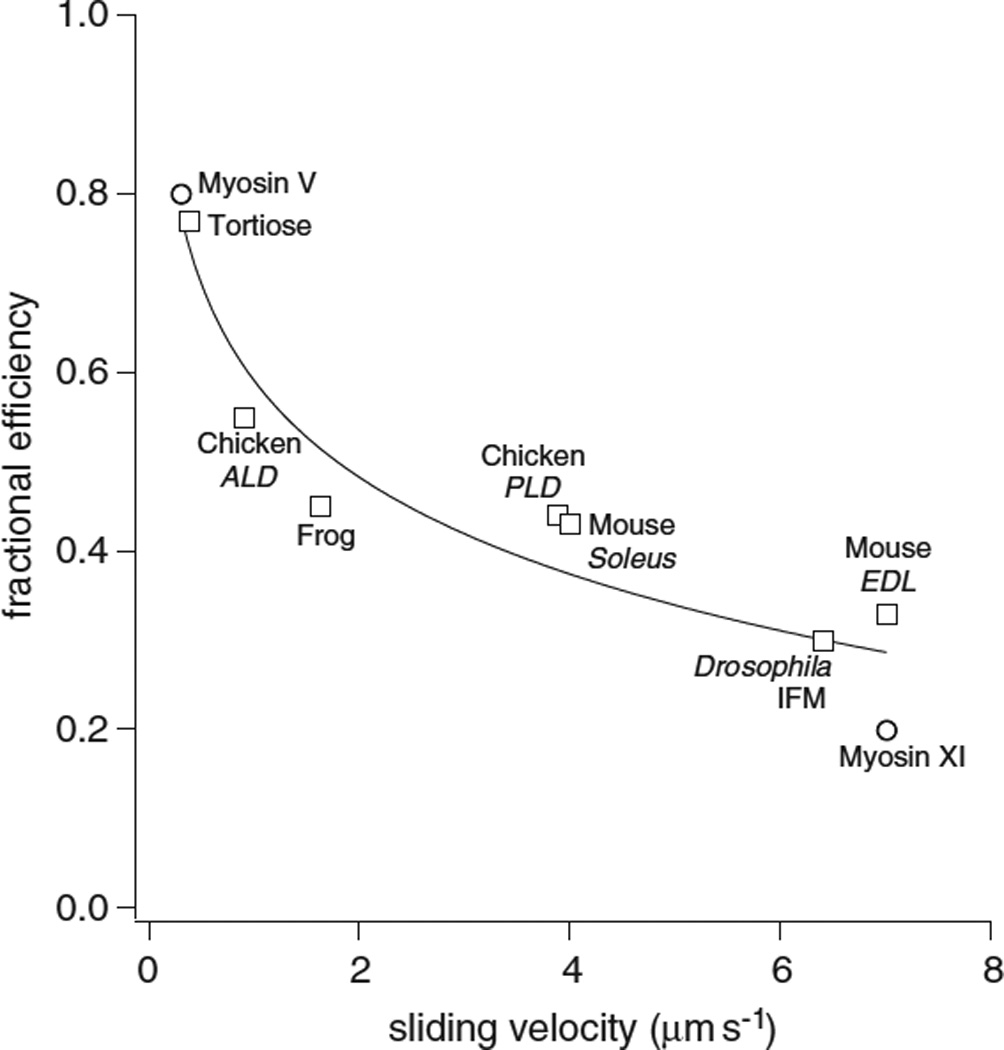
Fractional efficiencies for muscle (squares) and processive non-muscle (circles) myosins. Fractional efficiency (eff) is fit to velocity (v) by eff = −1.6 ln v + 0.59.
Muscles: Tortoise rectus femoris, Chicken anterior latissimus dorsi, Frog sartorius, Chicken posterior latissimus dorsi, Mouse soleus, Drosophila adult indirect flight muscle, Mouse extensor digitorum muscle
Non-Muscle: MV chicken myosin V, MXI Tobacco yellow bright-2 cells myosin XI
There is evidence that the stronger the A•M•ADP complex, the more energy is available to do work. A very large amount of free energy is released upon formation of this complex, and the high efficiencies of some myosins would require that a large fraction of this free energy be used to do work. A number of models have assumed that the energy released in formation of this complex is used to drive production of mechanical work43, and references therein. Variation of the strength of the A•M•ADP complex has additionally shown that the isometric force is directly correlated to the free energy released by formation of the A•M•ADP complex44. Thus the above model, which links slower velocities to a more open myosin nucleotide pocket and to a stronger A•M•ADP complex, would explain the correlation between efficiency and velocity. In this model, a partitioning of some subset of the total energy available between work (W) and ADP release would result in a negative correlation between efficiency and the log of velocity, see figure 8.
Discussion Summary
EPR spectroscopy using a spin-labeled nucleotide has resulted in structural information about the actomyosin•ADP state, a state that has not been studied by x-ray crystallography. Furthermore, quantitative analysis results in thermodynamic information about this state, confirming an equilibrium between open and closed conformations of the nucleotide pocket. Because the spectroscopic probe was attached to nucleotide that bound effectively to myosin, a panel of myosins with a greater than 20-fold range of sliding velocities could be studied, resulting in the counterintuitive result that the open nucleotide-pocket state is favored in myosins that slowly release ADP, even though ADP release is thought to occur from the open conformation. Our analysis suggests that destabilization of the open actomyosin ADP state in faster myosins lowers the free energy barrier for ADP release through a transition-state intermediate, resulting in faster ADP release. This destabilization comes at the cost of work-producing transitions leading up to the opening of the nucleotide-binding pocket. This model results in a simplified thermodynamic model for the relationship between speed and efficiency in myosin based motility.
Methods
Protein preparations
F-actin was purified from rabbit skeletal muscle45. The Dictyostelium discoideum tryptophan-free M761 motor domain cDNA fragment was expressed in Dd AX2-ORF+cells, and isolated as described previously46. Cardiac atrial and ventricular myosins were isolated from porcine hearts using the protocols of Tonomura et al47. Chicken gizzard smooth muscle myosin was isolated following the protocols of Ikebe and Hartshorn48. Myosin V motor domain was expressed, harvested and purified as in Sweeney et al49. Myosin subfragment-1 (S1) was prepared by chymotryptic digestion of myosin as described in Weeds and Taylor50.
Myosin fiber preparations
Fast (psoas) and slow (soleus) rabbit skeletal fibers were harvested and chemically skinned as described in Naber et al19. IFM fibers were dissected from 2 to 3-day-old female Drosophila and chemically skinned and stored as previously described, except that fibers were not split in half51. The demembranated fibers were used within 5 days.
Solutions
The basic rigor experimental buffer consisted of 5 mM Mg(OAc)2,1 mM EGTA, 40 mM MOPS, pH 7.0. For experiments involving skinned fibers, 50 mM KOAc was added to the rigor buffer.
EPR spectroscopy
For experiments with S1 or expressed motor domain, with or without actin present, protocols for spin-labeling and mounting the protein in a capillary for EPR spectral accumulation were as in Naber et al.19. IFM fibers were washed in a 500-fold excess (v/v) of rigor buffer and isolated via centrifugation to eliminate the DTT present in the glycerination and storage buffers. The process was repeated 4 times. Rabbit psoas and soleus fibers were minced with a razor blade for EPR spectroscopy experiments. The fiber preparation was then spin-labeled and mounted on a flat cell for spectral accumulation as described in Naber et al.19. EPR measurements were performed with a Bruker EMX EPR spectrometer (Billerica, MA). First derivative, X-band spectra were recorded in a high-sensitivity microwave cavity using 50 s, 10 mT-wide magnetic field sweeps. The instrument settings were as follows: microwave power, 25 mW; time constant, 164 ms; frequency, 9.83 GHz; modulation, 0.1 mT at a frequency of 100 kHz. Each spectrum used in data analysis was an average of 5–50 sweeps from an individual experimental preparation. Temperature was controlled by blowing dry air (warm or cool) into the cavity and monitored using a thermistor placed close to the experimental sample. Effective cone angles of mobility were determined following Griffith and Jost, and Alessi et al.27; 28
Acknowledgements
This work was supported by NIH grants HL032145 (T.P., K.F.-S.), AR042895 (R.C., N.N.), GM077067 (E.P., N.N.), AR055611 (D.M.S., C.J.E.), HL063798 (C.J.B.), NEED ALEX DUNN AND JIM SPUDICH, and the European Research Council IDEAS forcemap (208319) (A.M.-C.)
References
- 1.Bottinelli R, Betto R, Schiaffino S, Reggiani C. Unloaded shortening velocity and myosin heavy chain and alkali light chain isoform composition in rat skeletal muscle fibres. J Physiol. 1994;478(Pt 2):341–349. doi: 10.1113/jphysiol.1994.sp020254. [DOI] [PMC free article] [PubMed] [Google Scholar]
- 2.Weiss A, Leinwand LA. The mammalian myosin heavy chain gene family. Annu Rev Cell Dev Biol. 1996;12:417–439. doi: 10.1146/annurev.cellbio.12.1.417. [DOI] [PubMed] [Google Scholar]
- 3.Bottinelli R, Canepari M, Reggiani C, Stienen GJ. Myofibrillar ATPase activity during isometric contraction and isomyosin composition in rat single skinned muscle fibres. J Physiol. 1994;481(Pt 3):663–675. doi: 10.1113/jphysiol.1994.sp020472. [DOI] [PMC free article] [PubMed] [Google Scholar]
- 4.Fitts RH. Cellular mechanisms of muscle fatigue. Physiol Rev. 1994;74:49–94. doi: 10.1152/physrev.1994.74.1.49. [DOI] [PubMed] [Google Scholar]
- 5.Malmqvist UP, Aronshtam A, Lowey S. Cardiac myosin isoforms from different species have unique enzymatic and mechanical properties. Biochemistry. 2004;43:15058–15065. doi: 10.1021/bi0495329. [DOI] [PubMed] [Google Scholar]
- 6.Arner A, Lofgren M, Morano I. Smooth, slow and smart muscle motors. J Muscle Res Cell Motil. 2003;24:165–173. doi: 10.1023/a:1026001513928. [DOI] [PubMed] [Google Scholar]
- 7.Swank DM, Vishnudas VK, Maughan DW. An exceptionally fast actomyosin reaction powers insect flight muscle. Proc Natl Acad Sci U S A. 2006;103:17543–17547. doi: 10.1073/pnas.0604972103. [DOI] [PMC free article] [PubMed] [Google Scholar]
- 8.Mehta AD, Rock RS, Rief M, Spudich JA, Mooseker MS, Cheney RE. Myosin-V is a processive actin-based motor. Nature. 1999;400:590–593. doi: 10.1038/23072. [DOI] [PubMed] [Google Scholar]
- 9.Tominaga M, Kojima H, Yokota E, Orii H, Nakamori R, Katayama E, Anson M, Shimmen T, Oiwa K. Higher plant myosin XI moves processively on actin with 35 nm steps at high velocity. EMBO J. 2003;22:1263–1272. doi: 10.1093/emboj/cdg130. [DOI] [PMC free article] [PubMed] [Google Scholar]
- 10.Stienen GJ, Kiers JL, Bottinelli R, Reggiani C. Myofibrillar ATPase activity in skinned human skeletal muscle fibres: fibre type and temperature dependence. J Physiol. 1996;493(Pt 2):299–307. doi: 10.1113/jphysiol.1996.sp021384. [DOI] [PMC free article] [PubMed] [Google Scholar]
- 11.Nyitrai M, Rossi R, Adamek N, Pellegrino MA, Bottinelli R, Geeves MA. What limits the velocity of fast-skeletal muscle contraction in mammals? J Mol Biol. 2006;355:432–442. doi: 10.1016/j.jmb.2005.10.063. [DOI] [PubMed] [Google Scholar]
- 12.Bottinelli R. Functional heterogeneity of mammalian single muscle fibres: do myosin isoforms tell the whole story? Pflugers Arch. 2001;443:6–17. doi: 10.1007/s004240100700. [DOI] [PubMed] [Google Scholar]
- 13.Siemankowski RF, Wiseman MO, White HD. ADP dissociation from actomyosin subfragment 1 is sufficiently slow to limit the unloaded shortening velocity in vertebrate muscle. Proc Natl Acad Sci U S A. 1985;82:658–662. doi: 10.1073/pnas.82.3.658. [DOI] [PMC free article] [PubMed] [Google Scholar]
- 14.Weiss S, Rossi R, Pellegrino MA, Bottinelli R, Geeves MA. Differing ADP release rates from myosin heavy chain isoforms define the shortening velocity of skeletal muscle fibers. J Biol Chem. 2001;276:45902–45908. doi: 10.1074/jbc.M107434200. [DOI] [PubMed] [Google Scholar]
- 15.Nyitrai M, Geeves MA. Adenosine diphosphate and strain sensitivity in myosin motors. Philos Trans R Soc Lond B Biol Sci. 2004;359:1867–1877. doi: 10.1098/rstb.2004.1560. [DOI] [PMC free article] [PubMed] [Google Scholar]
- 16.Vetter IR, Wittinghofer A. The guanine nucleotide-binding switch in three dimensions. Science. 2001;294:1299–1304. doi: 10.1126/science.1062023. [DOI] [PubMed] [Google Scholar]
- 17.Naber N, Minehardt TJ, Rice S, Chen X, Grammer J, Matuska M, Vale RD, Kollman PA, Car R, Yount RG, Cooke R, Pate E. Closing of the nucleotide pocket of kinesin-family motors upon binding to microtubules. Science. 2003;300:798–801. doi: 10.1126/science.1082374. [DOI] [PubMed] [Google Scholar]
- 18.Wong YL, Dietrich KA, Naber N, Cooke R, Rice SE. The Kinesin-1 tail conformationally restricts the nucleotide pocket. Biophys J. 2009;96:2799–2807. doi: 10.1016/j.bpj.2008.11.069. [DOI] [PMC free article] [PubMed] [Google Scholar]
- 19.Naber N, Purcell TJ, Pate E, Cooke R. Dynamics of the nucleotide pocket of myosin measured by spin-labeled nucleotides. Biophys J. 2007;92:172–184. doi: 10.1529/biophysj.106.090035. [DOI] [PMC free article] [PubMed] [Google Scholar]
- 20.Coureux PD, Sweeney HL, Houdusse A. Three myosin V structures delineate essential features of chemo-mechanical transduction. Embo J. 2004;23:4527–4537. doi: 10.1038/sj.emboj.7600458. [DOI] [PMC free article] [PubMed] [Google Scholar]
- 21.Holmes KC, Angert I, Kull FJ, Jahn W, Schroder RR. Electron cryo-microscopy shows how strong binding of myosin to actin releases nucleotide. Nature. 2003;425:423–427. doi: 10.1038/nature02005. [DOI] [PubMed] [Google Scholar]
- 22.Sun M, Oakes JL, Ananthanarayanan SK, Hawley KH, Tsien RY, Adams SR, Yengo CM. Dynamics of the upper 50-kDa domain of myosin V examined with fluorescence resonance energy transfer. J Biol Chem. 2006;281:5711–5717. doi: 10.1074/jbc.M508103200. [DOI] [PubMed] [Google Scholar]
- 23.Robertson CI, Gaffney DP, 2nd, Chrin LR, Berger CL. Structural rearrangements in the active site of smooth-muscle myosin. Biophys J. 2005;89:1882–1892. doi: 10.1529/biophysj.105.059840. [DOI] [PMC free article] [PubMed] [Google Scholar]
- 24.Kintses B, Gyimesi M, Pearson DS, Geeves MA, Zeng W, Bagshaw CR, Malnasi-Csizmadia A. Reversible movement of switch 1 loop of myosin determines actin interaction. EMBO J. 2007;26:265–274. doi: 10.1038/sj.emboj.7601482. [DOI] [PMC free article] [PubMed] [Google Scholar]
- 25.Malnasi-Csizmadia A, Dickens JL, Zeng W, Bagshaw CR. Switch movements and the myosin crossbridge stroke. J Muscle Res Cell Motil. 2005;26:31–37. doi: 10.1007/s10974-005-9004-y. [DOI] [PubMed] [Google Scholar]
- 26.Pate E, Naber N, Matuska M, Franks-Skiba K, Cooke R. Opening of the myosin nucleotide triphosphate binding domain during the ATPase cycle. Biochemistry. 1997;36:12155–12166. doi: 10.1021/bi970996z. [DOI] [PubMed] [Google Scholar]
- 27.Griffith OH, Jost PC, editors. Spin Labeling: Theory and Applications. Berlinger, L.J. NY., NY: Academic Press; 1976. Lipid spin labels in biological membranes. [Google Scholar]
- 28.Alessi DR, Corrie JE, Fajer PG, Ferenczi MA, Thomas DD, Trayer IP, Trentham DR. Synthesis and properties of a conformationally restricted spin-labeled analog of ATP and its interaction with myosin and skeletal muscle. Biochemistry. 1992;31:8043–8054. doi: 10.1021/bi00149a039. [DOI] [PubMed] [Google Scholar]
- 29.Warshaw DM, Desrosiers JM, Work SS, Trybus KM. Smooth muscle myosin cross-bridge interactions modulate actin filament sliding velocity in vitro. J Cell Biol. 1990;111:453–463. doi: 10.1083/jcb.111.2.453. [DOI] [PMC free article] [PubMed] [Google Scholar]
- 30.Rice S, Cui Y, Sindelar C, Naber N, Matuska M, Vale R, Cooke R. Thermodynamic properties of the kinesin neck-region docking to the catalytic core. Biophys J. 2003;84:1844–1854. doi: 10.1016/S0006-3495(03)74992-3. [DOI] [PMC free article] [PubMed] [Google Scholar]
- 31.Schröder RR, Manstein DJ, Jahn W, Holden H, Rayment I, Holmes KC, Smith CA, Rayment I. Three-dimensional atomic model of F-acton decorated with Dictyostelium myosin S1. Nature. 1993;364:171–174. doi: 10.1038/364171a0. [DOI] [PubMed] [Google Scholar]
- 32.Geeves MA, Holmes KC. Structural mechanism of muscle contraction. Annu Rev Biochem. 1999;68:687–728. doi: 10.1146/annurev.biochem.68.1.687. [DOI] [PubMed] [Google Scholar]
- 33.Bos JL, Rehmann H, Wittinghofer A. GEFs and GAPs: critical elements in the control of small G proteins. Cell. 2007;129:865–877. doi: 10.1016/j.cell.2007.05.018. [DOI] [PubMed] [Google Scholar]
- 34.Rosenfeld SS, Houdusse A, Lee Sweeney H. Magnesium Regulates ADP Dissociation from Myosin V. J Biol Chem. 2005;280:6072–6079. doi: 10.1074/jbc.M412717200. [DOI] [PubMed] [Google Scholar]
- 35.Hannemann DE, Cao W, Olivares AO, Robblee JP, De La Cruz EM. Magnesium, ADP, and Actin Binding Linkage of Myosin V: Evidence for Multiple Myosin V-ADP and Actomyosin V-ADP States. Biochemistry. 2005;44:8826–8840. doi: 10.1021/bi0473509. [DOI] [PubMed] [Google Scholar]
- 36.Rosenfeld SS, Xing J, Whitaker M, Cheung HC, Brown F, Wells A, Milligan RA, Sweeney HL. Kinetic and spectroscopic evidence for three actomyosin:ADP states in smooth muscle. J Biol Chem. 2000;275:25418–25426. doi: 10.1074/jbc.M002685200. [DOI] [PubMed] [Google Scholar]
- 37.Woledge RC. The energetics of tortoise muscle. J Physiol. 1968;197:685–707. doi: 10.1113/jphysiol.1968.sp008582. [DOI] [PMC free article] [PubMed] [Google Scholar]
- 38.Smith NP, Barclay CJ, Loiselle DS. The efficiency of muscle contraction. Prog Biophys Mol Biol. 2005;88:1–58. doi: 10.1016/j.pbiomolbio.2003.11.014. [DOI] [PubMed] [Google Scholar]
- 39.Rall JA, Schottelius BA. Energetics of contraction in phasic and tonic skeletal muscles of the chicken. J Gen Physiol. 1973;62:303–323. doi: 10.1085/jgp.62.3.303. [DOI] [PMC free article] [PubMed] [Google Scholar]
- 40.Clemen AE, Vilfan M, Jaud J, Zhang J, Barmann M, Rief M. Force-dependent stepping kinetics of myosin-V. Biophys J. 2005;88:4402–4410. doi: 10.1529/biophysj.104.053504. [DOI] [PMC free article] [PubMed] [Google Scholar]
- 41.Lehmann FO, Heymann N. Dynamics of in vivo power output and efficiency of Nasonia asynchronous flight muscle. J Biotechnol. 2006;124:93–107. doi: 10.1016/j.jbiotec.2005.12.008. [DOI] [PubMed] [Google Scholar]
- 42.Higashi-Fujime S, Ishikawa R, Iwasawa H, Kagami O, Kurimoto E, Kohama K, Hozumi T. The fastest actin-based motor protein from the green algae, Chara, and its distinct mode of interaction with actin. FEBS Lett. 1995;375:151–154. doi: 10.1016/0014-5793(95)01208-v. [DOI] [PubMed] [Google Scholar]
- 43.Pate E, Cooke R. A model of cross-bridge action: the effects of ATP, ADP and Pi. J. Muscle Res. Cell Motil. 1989;10:181–196. doi: 10.1007/BF01739809. [DOI] [PubMed] [Google Scholar]
- 44.Karatzaferi C, Chinn MK, Cooke R. The force exerted by a muscle cross-bridge depends directly on the strength of the actomyosin bond. Biophys J. 2004;87:2532–2544. doi: 10.1529/biophysj.104.039909. [DOI] [PMC free article] [PubMed] [Google Scholar]
- 45.Spudich JA, Watt S. The regulation of rabbit skeletal muscle contraction. I. Biochemical studies of the interaction of the tropomyosin-troponin complex with actin and the proteolytic fragments of myosin. J Biol Chem. 1971;246:4866–4871. [PubMed] [Google Scholar]
- 46.Malnasi-Csizmadia A, Woolley RJ, Bagshaw CR. Resolution of conformational states of Dictyostelium myosin II motor domain using tryptophan (W501) mutants: implications for the open-closed transition identified by crystallography. Biochemistry. 2000;39:16135–16146. doi: 10.1021/bi001125j. [DOI] [PubMed] [Google Scholar]
- 47.Tonomura Y, Appel P, Morales M. On the molecular weight of myosin. II. Biochemistry. 1966;5:515–521. doi: 10.1021/bi00866a017. [DOI] [PubMed] [Google Scholar]
- 48.Ikebe M, Hartshorne DJ. Effects of Ca2+ on the conformation and enzymatic activity of smooth muscle myosin. J Biol Chem. 1985;260:13146–13153. [PubMed] [Google Scholar]
- 49.Sweeney HL, Rosenfeld SS, Brown F, Faust L, Smith J, Xing J, Stein LA, Sellers JR. Kinetic tuning of myosin via a flexible loop adjacent to the nucleotide binding pocket. J Biol Chem. 1998;273:6262–6270. doi: 10.1074/jbc.273.11.6262. [DOI] [PubMed] [Google Scholar]
- 50.Weeds AG, Taylor RS. Separation of subfragment-1 isoenzymes from rabbit skeletal muscle myosin. Nature. 1975;257:54–56. doi: 10.1038/257054a0. [DOI] [PubMed] [Google Scholar]
- 51.Yang C, Ramanath S, Kronert WA, Bernstein SI, Maughan DW, Swank DM. Alternative versions of the myosin relay domain differentially respond to load to influence Drosophila muscle kinetics. Biophys J. 2008;95:5228–5237. doi: 10.1529/biophysj.108.136192. [DOI] [PMC free article] [PubMed] [Google Scholar]
- 52.Wang F, Kovacs M, Hu A, Limouze J, Harvey EV, Sellers JR. Kinetic mechanism of non-muscle myosin IIB: functional adaptations for tension generation and maintenance. J Biol Chem. 2003;278:27439–27448. doi: 10.1074/jbc.M302510200. [DOI] [PubMed] [Google Scholar]
- 53.De La Cruz EM, Wells AL, Rosenfeld SS, Ostap EM, Sweeney HL. The kinetic mechanism of myosin V. Proc Natl Acad Sci U S A. 1999;96:13726–13731. doi: 10.1073/pnas.96.24.13726. [DOI] [PMC free article] [PubMed] [Google Scholar]
- 54.Cremo CR, Geeves MA. Interaction of actin and ADP with the head domain of smooth muscle myosin: implications for strain-dependent ADP release in smooth muscle. Biochemistry. 1998;37:1969–1978. doi: 10.1021/bi9722406. [DOI] [PubMed] [Google Scholar]
- 55.Ritchie MD, Geeves MA, Woodward SK, Manstein DJ. Kinetic characterization of a cytoplasmic myosin motor domain expressed in Dictyostelium discoideum. Proc Natl Acad Sci U S A. 1993;90:8619–8623. doi: 10.1073/pnas.90.18.8619. [DOI] [PMC free article] [PubMed] [Google Scholar]
- 56.Iorga B, Adamek N, Geeves MA. The slow skeletal muscle isoform of myosin shows kinetic features common to smooth and non-muscle myosins. J Biol Chem. 2007;282:3559–3570. doi: 10.1074/jbc.M608191200. [DOI] [PubMed] [Google Scholar]
- 57.Miller BM, Nyitrai M, Bernstein SI, Geeves MA. Kinetic analysis of Drosophila muscle myosin isoforms suggests a novel mode of mechanochemical coupling. J Biol Chem. 2003;278:50293–50300. doi: 10.1074/jbc.M308318200. [DOI] [PubMed] [Google Scholar]
- 58.Swank DM, Knowles AF, Kronert WA, Suggs JA, Morrill GE, Nikkhoy M, Manipon GG, Bernstein SI. Variable N-terminal regions of muscle myosin heavy chain modulate ATPase rate and actin sliding velocity. J Biol Chem. 2003;278:17475–17482. doi: 10.1074/jbc.M212727200. [DOI] [PubMed] [Google Scholar]
- 59.Kurzawa SE, Geeves MA. A novel stopped-flow method for measuring the affinity of actin for myosin head fragments using microgram quantities of protein. J Muscle Res Cell Motil. 1996;17:669–676. doi: 10.1007/BF00154061. [DOI] [PubMed] [Google Scholar]
- 60.Highsmith S. The effects of temperature and salts on myosin subfragment-1 and F-actin association. Arch Biochem Biophys. 1977;180:404–408. doi: 10.1016/0003-9861(77)90054-6. [DOI] [PubMed] [Google Scholar]