Abstract
Background
The best timing for patient visits after revision TKA is unclear. Predictors of pain and function reported in the literature typically look at the influence at a given time that might not be ideal if the score is not at a peak or the earliest possible time. Moreover, most reports of predictors include revisions for infection, which typically have a poorer outcome, or for other indications with variable outcome.
Questions/purposes
We therefore determined (1) the trend of recovery after revision TKA to determine the best time to measure the peak patient-reported pain and function scores and (2) the influence of comorbidities and age on the patterns of recovery.
Methods
We prospectively followed 120 patients who had revision TKAs from 2003 to 2008. The patients were assessed within 6 weeks before surgery and at 12 weeks, 1 year, and annually thereafter. We obtained WOMAC and SF-36 scores at each visit. We used a linear mixed model analysis to assess predictors. The minimum followup was 2 years (mean, 3 years; range, 2–7 years).
Results
The majority of improvements in the WOMAC and SF-36 scores occurred during the first year after surgery after which the scores stabilized. One of the seven independent preoperative variables studied (comorbidities) predicted a trend toward improvement of WOMAC pain, WOMAC function, and SF-36 bodily pain scores. The greater the numbers of comorbidities, the worse were the scores. Age, gender, BMI, indication for surgery, and surgeon did not independently influence the WOMAC or SF-36.
Conclusion
Our data suggest that one of the times for patient visits after revision TKA should be 1 year after surgery. This time allows for key discrimination of implant performance. The data also confirm that patients with a greater number of comorbidities had less functional benefit from revision surgery.
Level of Evidence
Level II, prognostic study. See the Guidelines for Authors for a complete description of levels of evidence.
Introduction
The revision burden for knee arthroplasties is increasing globally. The England and Wales 7th National Joint Registry (NJR) report noted an increase in revision knee arthroplasties from 4.3% of primary knee arthroplasties in 2007 to 5.9% in 2009. In excess of 5000 revision knee arthroplasties were performed from 2009 to 2010 [14]. National registries use revision as an end point to compare the performance of various implants and hospitals. However, survivorship determined by revision fails to capture whether the original operation meets the expectations of the patient and should be supplemented by patient-reported outcome measures (PROMS) [9, 22].
The timing of collection of these PROMS is empirical with little evidence for such and a matter of debate [9]. The Department of Health in the United Kingdom recently embarked on using PROMS to assess primary joint arthroplasty with review set somewhat arbitrarily at 6 months after the primary surgery [14]. It has been argued that this may be too soon to capture reliably the peak functional scores [9]. The NJR has proposed extending this to 1, 3, or 5 years after the procedure [14]. It has been estimated that approximately 35,000 patients whose data are included in the NJR would be sent the questionnaire, as an initial pilot study. Collection and analyses for this trial would be an expensive undertaking. To ensure the cost-effectiveness of such an enterprise, the proposed pilot study should account for the natural history of recovery of function and pain relief after surgery. Currently the NJR questionnaires would be for primary joint arthroplasty only, but with time, its scope may be extended to include revision surgery.
In a systematic literature review, Saleh et al. [16] reported that global rating scales improve after revision knee replacement. However, few published studies have reported predictors of function after revision knee replacement and are limited by small sample size and therefore limited power to examine predictors of poor functional scores [15, 18]. The studies that have looked at predictors include revisions for indications like infection, which traditionally have a poorer outcome [2, 5, 16], and also revisions for lesser interventions like polyethylene liner exchange, patellar resurfacings, and revision of unicompartmental knee replacements, which would have better outcomes [6, 10] . Moreover, other than for the study by Ghomrawi et al. [8], these studies have looked at predictors of outcome at a given time (cross-sectional analysis), rather than the trend over a period of time (longitudinal analysis). However, any given time might not be ideal if the score is not at a peak or the earliest possible time.
We therefore asked three questions: (1) When do patients achieve the peak WOMAC pain and function scores and SF-36 bodily pain and function scores after revision TKA? (2) Does age alter the trend of WOMAC and SF-36 scores after revision knee surgery? (3) Does the number of comorbidities predict the trend of WOMAC and SF-36 scores?
Patients and Methods
We prospectively followed 176 patients who underwent 194 revision TKAs from 2003 to 2008. Of these, 161 patients (175 revision TKAs) agreed to participate in this study. The indications for revision TKA were primarily aseptic loosing and instability (Table 1). The contraindications were: (1) poor anesthetic candidate, (2) recurrent infection, (3) poor skin cover, and (4) deficient extensor mechanism. We excluded 43 patients (47 revision TKAs) for infection, isolated patellar resurfacing, tibial polyethylene exchange, failed unicondylar knee replacement, rerevisions, all patients who had undergone revision with unconstrained prostheses; and five patients (eight revision TKAs) who were lost to followup before the minimum followup of 2 years. These exclusions left 113 patients with 120 revision TKAs. The median age of the patients was 69 years (range, 36–88 years) (Table 2). The minimum followup was 2 years (mean, 3 years; range, 2–7 years). Written consent was obtained for inclusion in the local hospital joint registry (FJR) as part of a Caldicott-approved prospective audit [SKMBT_C35310112418090, R&D Department, Newcastle upon Tyne NHS Trust]. The FJR includes prospectively collected PROMS.
Table 1.
Indications for surgery
| Indication | Number (%) |
|---|---|
| Aseptic loosening | 56 (46%) |
| Instability without bone loss | 32 (27%) |
| Unexplained pain | 11 (9%) |
| Polyethylene wear | 15 (13%) |
| Others | 6 (5%) |
Table 2.
Patient demographics
| Patient demographics | Median (range) |
|---|---|
| Age (years) | 69 (36–88) |
| Sex (M:F) | 57:63 |
| Side (R:L) | 66:54 |
| BMI | 28.5 (19–44) |
| Followup (years) | 3 (1–7) |
All patients underwent surgery by or under the direct supervision of one of four experienced revision arthroplasty surgeons. The old scar was used for the incision and a medial parapatellar approach was used. Multiple tissue and fluid specimens were sent for microbiology analysis. After removing the polyethylene liner, the tibial base plate and the femoral components were removed. The femur and tibia were prepared with minimal additional removal of bone. The joint line was established using a combination of old meniscal scars and epicondyles, if identifiable. Spacers were used to balance flexion and extension gaps and collateral ligament integrity was established. It was agreed uniformly that an incompetent medial collateral ligament would necessitate a rotating hinge prosthesis. A lesser degree of combined lateral collateral ligament posterolateral and posteromedial instability was addressed with either a constrained condylar or a rotating hinge device, at the discretion of the operating surgeon. Definitive components were implanted with cement at the surface, but stems were not cemented and final stability was confirmed before closure. In all cases, an unconstrained type of knee replacement (cruciate retaining or sacrificing) was explanted with introduction of a greater level of constraint to either a nonlinked constrained device (constrained condylar) with varus-valgus control or a linked constrained (rotating hinge) construct, which could prevent active or passive hyperextension.
The rehabilitation protocol was similar for all patients under the care of the same group of physiotherapists and consistent through the course of the study. Medical condition permitting, the patients were mobilized the day after surgery, with weightbearing as tolerated, and used crutches for 6 weeks. Static quadriceps exercises were begun immediately in the ward after surgery; and active and passive range of movement exercises started the next day. The patients were discharged when they achieved good quadriceps control and were able to negotiate stairs independently. Supervised physiotherapy was continued for 3 months for all patients and longer if the patients required additional help.
The patients were assessed within 6 weeks before surgery, at 1 year, and annually thereafter. Independent trained research assistants were responsible for data collection. No surgeon was involved with data collection, evaluation, or initial analysis. A case note and operation record review was performed to gather information regarding the indication for surgery and the level of constraint used during the procedure. All surgeons at this institution routinely recorded in writing after surgery, as part of the hospital audit, the principal indication for surgery and this was taken as the baseline for subsequent analyses. The preoperative questionnaire included demographic details, height, weight, and comorbidity. These self-administered comorbidity questions have been validated with a medical record-based comorbidity instrument and with subsequent health status and healthcare utilization [17]. All patients were invited to complete the WOMAC questionnaire [3, 19] and the SF 36v2TM health survey [20] preoperatively, and 1, 2, and 3 years after surgery. Pain and function are primary determining factors of patient satisfaction after TKA [1]. Therefore, particular attention was paid to the pain and function components of WOMAC scores and the bodily pain and physical function components of the SF-36 scores. Scores for WOMAC pain and function domains were transformed to a 0 to 100 scale [21, 23], with 0 indicating extreme pain/functional disability and 100 indicating no pain/functional disability. Because the primary aim of the study was to explore the effect of surgery on pain and function, only the bodily pain (BP) and physical function (PF) components of the SF-36 scores, with scores ranging from 0 to 100 with 100 being best, were included in the final analysis [20]. The trend for improved scores with time was studied up to 3 years after revision surgery. Complete 1-year followup data were available for 120 (100%) procedures, 2-year data for 96 procedures (80%), and 3-year data for 78 (65%).
To determine whether distribution of the data were different from the normal distribution, we used a Kolmogorov-Smirnov test; when the probability was less than 0.05, we treated the data as nonparametric. To improve precision in assessing whether there is a difference between the WOMAC and SF-36 scores, it is important to consider known independent predictors of outcome after primary joint replacement, which include age, sex, comorbid scores, and the preoperative score [12]. To exclude the effect of these potential confounding variables on the trend of the score we used previously described methods [12] to adjust for these variables using general linear models. To compare continuous variables, two-sample t-tests were used for parametric data and the Mann-Whitney U test was used for nonparametric data. All tests were two-tailed. We performed a correlation analysis to examine the association between the 1-year WOMAC pain and function scores with the preoperative WOMAC scores. A linear mixed-effect model was used to estimate the effect of various covariates on the trend of WOMAC pain and function scores and the SF-36 bodily pain and physical function scores. This method of analysis takes into account the correlated nature of repeated measures of the same subject and as the nonlinear patterns in functional improvement by allowing a change in trend for different times [8, 13]. The functional scores were treated as dependent variables and age, sex, BMI, indications of surgery, surgeon, and number of comorbidities as covariates. Statistical analysis was performed using the SPSS®v19 statistical program (IBM, Chicago, IL, USA).
Results
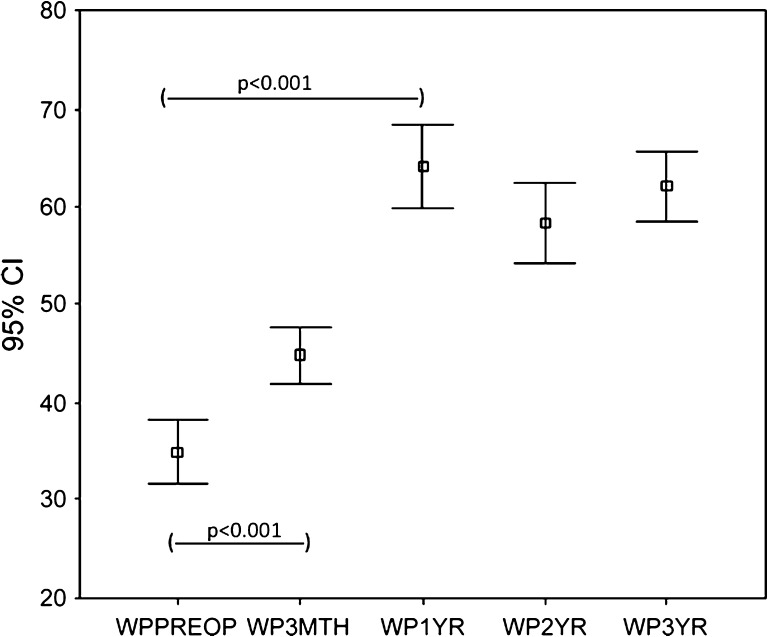
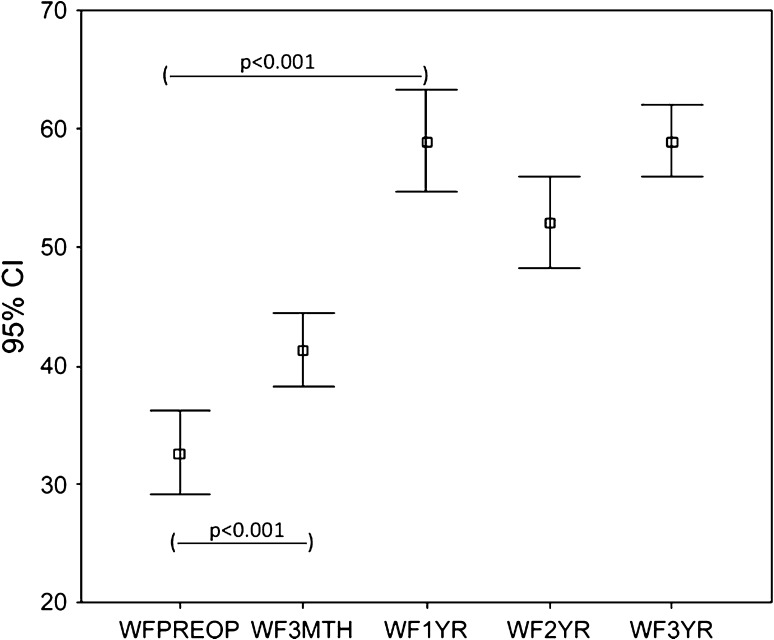
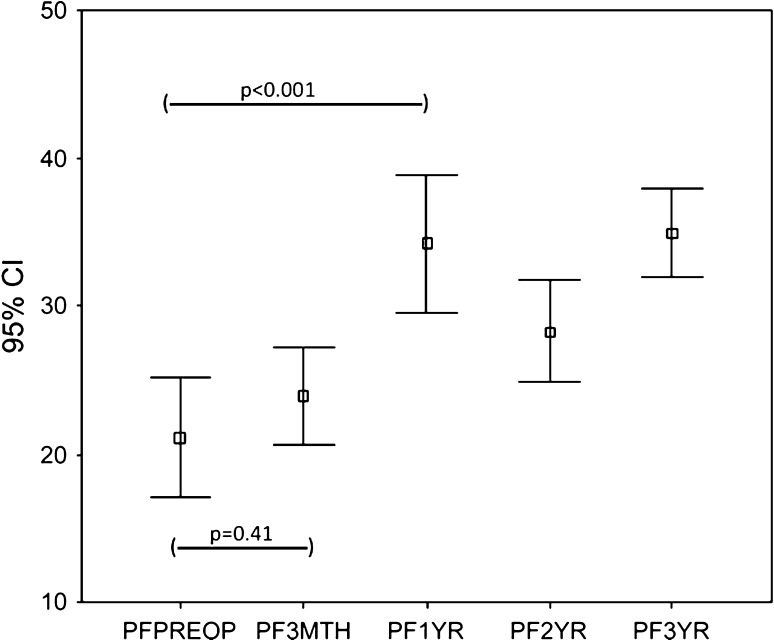
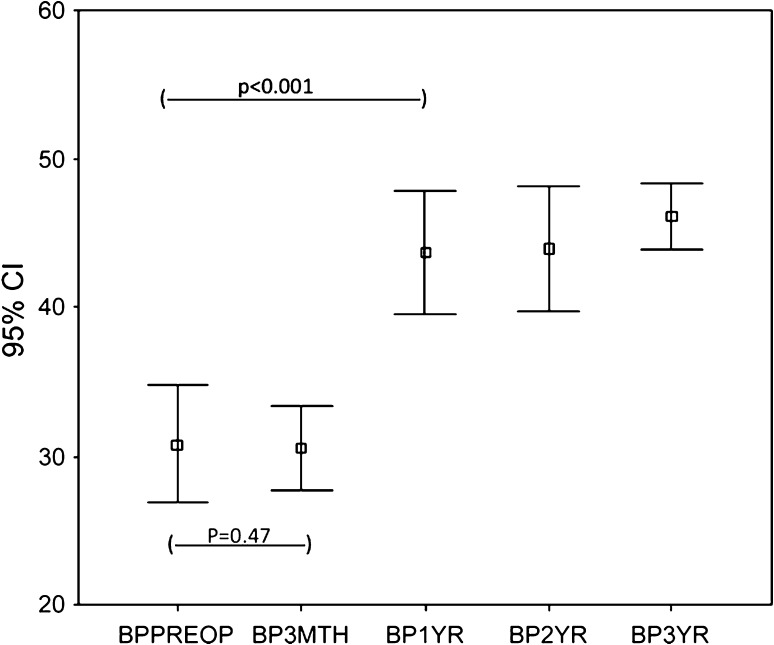
The WOMAC scores (pain and function) and the SF-36 (physical functional and bodily pain scores) improved (p < 0.001) at 3 months and the improvement continued (p < 0.001) up to 1 year with no subsequent change at 2 and 3 years. The trend for WOMAC pain (Fig. 1) and function (Fig. 2) and SF-36 physical function (Fig. 3) and bodily pain (Fig. 4) scores shows that the scores reach their peak at 1 year and then stabilize with minor change at 2 and 3 years.
Fig. 1.
The trend for WOMAC pain scores over 3 years for the whole group is shown. The scores increased at 3 months, reached a peak at 1 year, and then stabilized. WPPreop = preoperative WOMAC pain score; WP3Mth = 3-month WOMAC pain score; WP1 yr = 1-year WOMAC pain score; WP2 yr = 2-year WOMAC pain score; WP3 yr = 3-year WOMAC pain score.
Fig. 2.
The trend for WOMAC function scores over 3 years for the whole group is shown. The scores increased at 3 months, reached a peak at 1 year, and then stabilized. WFPreop = preoperative WOMAC function score; WF3Mth = 3-month WOMAC function score; WF1 yr = 1-year WOMAC function score; WF2 yr = 2-year WOMAC function score; WF3 yr = 3-year WOMAC function score.
Fig. 3.
The trend for the SF-36 physical function (PF) scores over 3 years for the whole group is shown. The scores increased only marginally at 3 months, reached a peak at 1 year, and then stabilized. PFPreop = preoperative SF-36 physical function score; PF3Mth = 3-month SF-36 physical function score; PF1 yr = 1-year SF-36 physical function score; PF2 yr = 2-year SF-36 physical function score; PF3 yr = 3-year SF-36 physical function score.
Fig. 4.
The trend for SF-36 bodily pain (BP) scores over 3 years for the whole group is shown. The scores remained the same at 3 months, increased to almost the peak at 1 year, and then stabilized. BPPreop = preoperative SF-36 bodily pain score; BP3mth = 3-month SF-36 bodily pain score; BP1 yr = 1-year SF-36 bodily pain score; BP2 yr = 2-year SF-36 bodily pain score; BP3 yr = 3-year SF-36 bodily pain score.
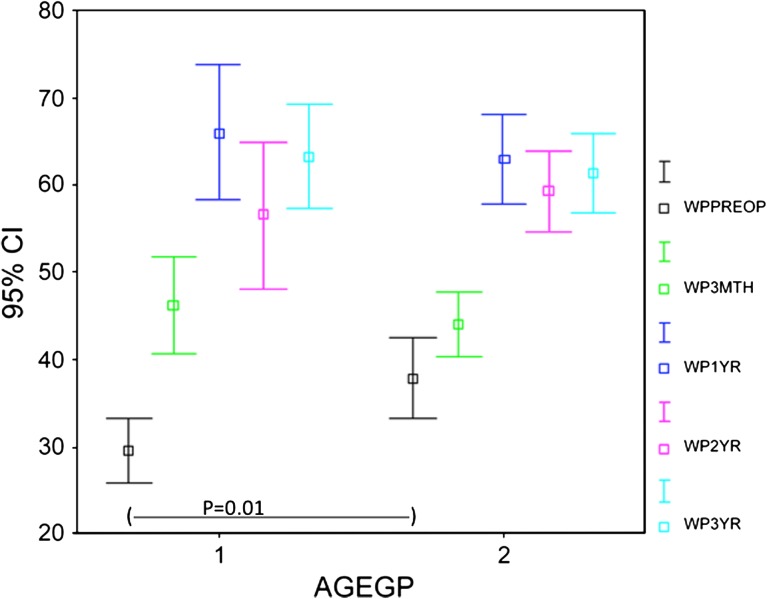
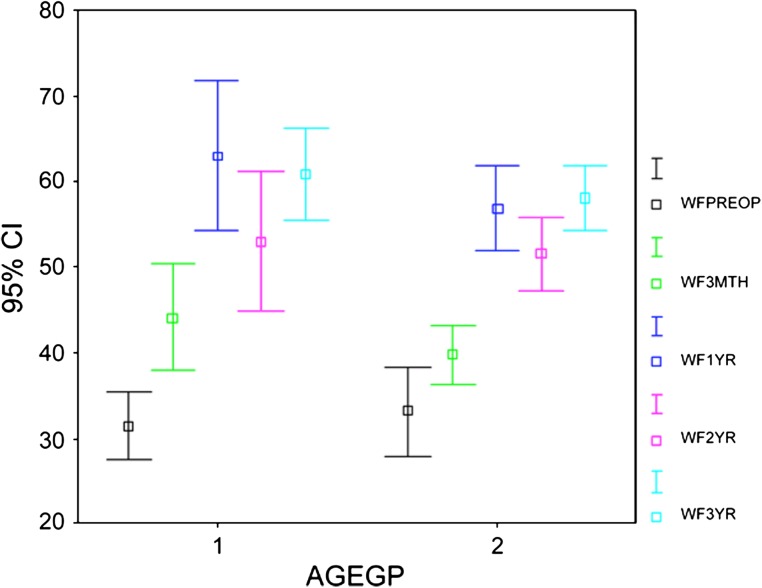
When comparing the trend for WOMAC pain (Fig. 5) and function (Fig. 6) scores between patients 65 years or younger (n = 43) and those older than 65 years (n = 77), we observed no difference between the two groups of scores except for preoperative pain scores. The preoperative WOMAC pain score was worse (p = 0.01) for the patients 65 years or younger. The preoperative bodily pain component of the SF-36 score also was worse (p = 0.05) for the younger age group.
Fig. 5.
A comparison of the trend for WOMAC pain scores for different age groups (AGEGP) is shown. The preoperative score was better for the older group, but the scores at other stages were statistically similar. The trend for the scores also was similar for both groups, with a peak at 1 year. Gp 1 = 65 years or younger; Gp 2 = older than 65 years; WPPreop = preoperative WOMAC pain score; WP3Mth = 3-month WOMAC pain score; WP1 yr = 1-year WOMAC pain score; WP2 yr = 2-year WOMAC pain score; WP3 yr = 3-year WOMAC pain score.
Fig. 6.
A comparison for the trend of WOMAC function scores for different age groups (AGEGP) is shown. The scores were similar for both groups and the trend was similar with a peak at 1 year. Gp 1 = 65 years or younger; Gp 2 = older than 65 years; WFPreop = preoperative WOMAC function score; WF3Mth = 3-month WOMAC function score; WF1 yr = 1-year WOMAC function score; WF2 yr = 2-year WOMAC function score; WF3 yr = 3-year WOMAC function score.
The only predictor of the trend of functional results was the number of comorbidities (Table 3). The total number of comorbidities predicted a trend for improvement of WOMAC pain (p = 0.02), and WOMAC function (p = 0.002) scores, and SF-36 bodily pain scores (p = 0.04). The greater the numbers of comorbidities, the worse the scores except for the SF-36 physical function score. Age, sex, BMI, surgeon, and indication for surgery did not individually influence functional scores.
Table 3.
Results of linear mixed model analysis of predictors of functional scores
| Parameter | WOMAC pain | WOMAC function | SF-36 physical function | SF-36 bodily pain |
|---|---|---|---|---|
| Age | 0.19 | 0.35 | 0.45 | 0.24 |
| BMI | 0.26 | 0.92 | 0.25 | 0.10 |
| Sex | 0.34 | 0.42 | 0.23 | 0.31 |
| Comorbidities | 0.02 | 0.002 | 0.13 | 0.04 |
| Surgeon | 0.85 | 0.92 | 0.24 | 0.65 |
| Indication | 0.41 | 0.41 | 0.06 | 0.59 |
Discussion
Preoperative factors may influence the trend of the pain and function scores over a period of time. Some studies have looked at the influence of these factors at a given time and not the trend in a longitudinal manner [15, 18]. Moreover, the studies may be biased by including cases with traditionally poorer scores (revision for infection) [2, 5, 16] or less complex procedures (polyethylene liner exchange, patellar resurfacing, revision for unicondylar knee replacement) [6, 10]. The aim of this study was to investigate the patterns of recovery after aseptic revision TKA in a prospective, longitudinal analysis of patients who underwent surgery in a tertiary referral unit. Specifically we wanted to explore when patients achieve the peak WOMAC pain and function scores and SF-36 bodily pain and function scores after revision TKA. Our secondary aim was to investigate the role of possible predictor variables like age, sex, BMI, indications of surgery, level of constraint, surgeon, and the number of comorbidities. We wanted to confirm the findings reported by Ghomrawi et al. [8], that their patients achieved maximum pain relief and function 1 year after revision TKA.
This study has some limitations. First, the study has allowed only for short-term followup. Although this might limit the information that can be reported regarding prosthetic survival, it allowed us the opportunity to achieve our key objective of understanding the pattern of recovery after revision TKA. Second, although we limited the data to one center, and perhaps the generalizability of the data, we likely reduced some potentially confounding variables introduced by variable surgical techniques and rehabilitation protocol. Third, we excluded revisions with relatively less intervention such as polyethylene exchange, patellar resurfacing, or revision for unicondylar knee replacement, which would bias the study toward a more positive outcome. We also excluded revisions for indications like infection and rerevisions that may bias a study toward more negative results. This methodology is unique and we believe would strengthen the relevance of the findings in this study. Fourth, we did not perform conventional regression analyses to explore the effect of the predictor variables. Instead, we used a linear mixed-effect model to estimate the effect of various covariates on the trend of pain and function scores. We believe this approach is more appropriate than conventional regression analysis and was used in a study looking at pain and function after an intervention [8]. Not only does it model correlation between repeated measures of the same person, but it also assesses fluctuations in function with time (longitudinal evaluation). Conventional regression analyses, which are conducted separately for each time, evaluate the effect of predictors on functional status at a given time (that is, a cross-sectional evaluation).
We found PROMS pain and functional scores reached a peak at 1 year in the majority of the cases and then enter a steady state beyond that. Despite intense interest in implant survivorship as assessed by registry data, there is limited understanding of the trend in recovery after revision knee surgery. It is unclear if the pattern of improvement after revision surgery mimics that after primary TKA; that is, whether a plateau usually is reached after 1 year [8], yet the numbers of such procedures continue to increase, as a percentage of the total arthroplasty burden and also in total number. Ghomrawi et al. [8], in a multicenter study, looked at the patterns of functional improvement after revision TKA to up to 2 years followup. The pain and function components of the WOMAC scores deteriorated at 2 years as compared with at 1 year. They included cases revised for infection and also procedures in which a single component was revised. Moreover, the multicenter nature of the study brings in confounding variables not only because of surgeon factors, but also rehabilitation protocols, which reportedly are critical for functional recovery [4]. In contrast, in our study, such confounding variables were excluded allowing for assessment in one center of true complete revision for aseptic failure. In addition, we adjusted the data with respect to the influence of patient age, sex, and number of comorbidities. This was achieved using a general linear model with adjusted mean scores [12].
Our data showed no difference between the postoperative scores for patients 65 years and younger as compared with those older than 65 years. Similar to the findings reported by Ghomrawi et al. [8], the linear mixed model analysis of our data also excluded age as a predictor variable (Table 3). We did find that the preoperative WOMAC pain scores and the SF-36 bodily pain scores were worse in younger patients. Singh et al. [18] reported that patients older than 80 years had greater odds of moderate to severe overall activity limitation. However, this was on the basis of a cross-sectional analysis 2 and 5 years after surgery using nonstandard outcome measures. They reported only on functional limitation rather than using functional score.
We found the total number of comorbidities was the only predictor of the trend of improvement of WOMAC pain and function scores and the SF-36 bodily pain scores. Several studies have reported the predictors of functional scores after revision TKA (Table 4). The association between increased number of comorbidities and worse scores also was observed in studies of primary TKAs [7, 11]. Our study confirms the findings reported by Ghomrawi et al. [8], with the additional strength introduced by refining the data by excluding revisions for indications that might introduce bias in assessment. Singh et al. [18] found that age, female sex, number of comorbidities, and obesity were major predictors of moderate to severe functional limitation after revision TKA.
Table 4.
Studies of predictors of functional scores
| Study | Number of revision TKAs | Design | Followup | Outcome | Trend | Predictors |
|---|---|---|---|---|---|---|
| Pun & Ries [15] | 67 | Retrospective | 2 years | Knee Society scores | Not reported | Preoperative diagnosis |
| Ghomrawi et al. [8] | 221 | Prospective | 2 years | WOMAC; SF-36; LEAS | Peak at 1 year; significant decrease at 2 years | Comorbidities; mode of failures |
| Singh et al. [18] | 1456 | Prospective | 2–5 years | Functional limitation | Not reported | BMI > 40; comorbidities; female; age > 80 years |
| Current study | 120 | Prospective | 3 years | WOMAC; SF-36 | Peak at 1 year; no significant change after 1 year | Comorbidities |
LEAS- Lower-extremity activity scale.
We believe this information will be helpful as a benchmark for establishment of a pathway to collect PROMS data in this subgroup of patients undergoing arthroplasties. Data collection is expensive and needs to be rationalized. The cost for data, which might not reflect the true picture, cannot be justified in the current financial climate. From the perspective of the NJR, early identification of unacceptable levels of failure of implants is important, and it likewise is beneficial to identify surgical centers with suboptimal performance. Data collection for groups of underperforming implants or surgical centers is particularly crucial because these implants and the centers at which they are used are at most risk for poorer scores and higher risk of revision. However, revision as the end point might be limited and not always reliable [9, 22]. There may be reluctance to offer surgery considering the complexity of the procedure [9] and associated comorbidities. Patients with a poor score who have not been offered revision surgery or elect not to undergo further surgery will not be captured [22]. The PROMS data in this regard might be a better measure of performance and lower scores may indicate a failing implant earlier than the endpoint of revision [9, 22]. PROMS data examine changing performance after intervention and the ideal time to review would be when a steady state is achieved. This is when it would be most cost-effective and would reflect population behavior. These data support the notion that patients achieve maximum pain relief and function 1 year after revision TKA. The patients who had a greater number of comorbidities had a worse functional benefit. Age of the patient did not determine the WOMAC and SF-36 scores.
Acknowledgments
We thank N.T. Brewster, FRCS(Tr & Orth), J.P. Holland, FRCS(Tr & Orth), and D.J. Weir, FRCS(Tr & Orth) (Consultant Orthopaedic Surgeons, Freeman Hospital, Newcastle upon Tyne, UK) for contributing their cases to be included in this study.
Footnotes
Each author certifies that he or she has no commercial associations (eg, consultancies, stock ownership, equity interest, patent/licensing arrangements, etc) that might pose a conflict of interest in connection with the submitted article.
Clinical Orthopaedics and Related Research neither advocates nor endorses the use of any treatment, drug, or device. Readers are encouraged to always seek additional information, including FDA-approval status, of any drug or device prior to clinical use.
All ICMJE Conflict of Interest Forms for authors and Clinical Orthopaedics and Related Research editors and board members are on file with the publication and can be viewed on request.
Each author certifies that his or her institution approved or waived approval for the reporting of this investigation and that all investigations were conducted in conformity with ethical principles of research.
This work was performed in the Freeman Hospital, Newcastle upon Tyne, UK.
References
- 1.Baker PN, Meulen JH, Lewsey J, Gregg PJ. National Joint Registry for england and Wales. The role of pain and function in determining patient satisfaction after total knee replacement: data from the National Joint Registry for England and Wales. J Bone Joint Surg Br. 2007;89:893–900. doi: 10.1302/0301-620X.89B7.19091. [DOI] [PubMed] [Google Scholar]
- 2.Barrack RL, Engh G, Rorabeck C, Sawhney J, Woolfrey M. Patient satisfaction and outcome after septic versus aseptic revision total knee arthroplasty. J Arthroplasty. 2000;15:990–993. doi: 10.1054/arth.2000.16504. [DOI] [PubMed] [Google Scholar]
- 3.Bellamy N, Buchanan WW, Goldsmith CH, Campbell J, Stitt LW. Validation study of WOMAC: a health status instrument for measuring clinically important patient relevant outcomes to antirheumatic drug therapy in patients with osteoarthritis of the hip or knee. J Rheumatol. 1988;15:1833–1840. [PubMed] [Google Scholar]
- 4.Coyte PC, Young W, Croxford R. Costs and outcomes associated with alternative discharge strategies following joint replacement surgery: analysis of an observational study using a propensity score. J Health Econ. 2000;19:907–929. doi: 10.1016/S0167-6296(00)00041-2. [DOI] [PubMed] [Google Scholar]
- 5.Deehan DJ, Murray JD, Birdsall PD, Pinder IM. Quality of life after knee revision arthroplasty. Acta Orthop. 2006;77:761–766. doi: 10.1080/17453670610012953. [DOI] [PubMed] [Google Scholar]
- 6.Dudley TE, Gioe TJ, Sinner P, Mehle S. Registry outcomes of unicompartmental knee arthroplasty revisions. Clin Orthop Relat Res. 2008;466:1666–1670. doi: 10.1007/s11999-008-0279-3. [DOI] [PMC free article] [PubMed] [Google Scholar]
- 7.Ethgen O, Bruyere O, Richy F, Dardennes C, Reginster JY. Health-related quality of life in total hip and total knee arthroplasty:a qualitative and systematic review of the literature. J Bone Joint Surg Am. 2004;86:963–974. doi: 10.2106/00004623-200405000-00012. [DOI] [PubMed] [Google Scholar]
- 8.Ghomrawi HM, Kane RL, Eberly LE, Bershadsky B, Saleh KJ. North American Knee Arthroplasty Revision (NAKAR) Study Group. Patterns of functional improvement after revision knee arthroplasty. J Bone Joint Surg Am. 2009;91:2838–2845. doi: 10.2106/JBJS.H.00782. [DOI] [PubMed] [Google Scholar]
- 9.Goodfellow JW, O’Connor JJ, Murray DW. A critique of revision rate as an outcome measure: re-interpretation of knee joint registry data. J Bone Joint Surg Br. 2010;92:1628–1631. doi: 10.1302/0301-620X.92B12.25193. [DOI] [PubMed] [Google Scholar]
- 10.Griffin WL, Scott RD, Dalury DF, Mahoney OM, Chiavetta JB, Odum SM. Modular insert exchange in knee arthroplasty for treatment of wear and osteolysis. Clin Orthop Relat Res. 2007;464:132–137. [PubMed] [Google Scholar]
- 11.Heck DA, Robinson RL, Partridge CM, Lubitz RM, Freund DA. Patient outcomes after knee replacement. Clin Orthop Relat Res. 1998;356:93–110. doi: 10.1097/00003086-199811000-00015. [DOI] [PubMed] [Google Scholar]
- 12.Lingard EA, Muthumayandi K, Holland JP. Comparison of patient-reported outcomes between hip resurfacing and total hip replacement. J Bone Joint Surg Br. 2009;91:1550–1554. doi: 10.1302/0301-620X.91B12.22326. [DOI] [PubMed] [Google Scholar]
- 13.Naumova EN, Must A, Laird NM. Tutorial in biostatistics: evaluating the impact of ‘critical periods’ in longitudinal studies of growth using piecewise mixed effects models. Int J Epidemiol. 2001;30:1332–1341. doi: 10.1093/ije/30.6.1332. [DOI] [PubMed] [Google Scholar]
- 14.National Joint Registry. (2010). National Joint Registry 7th Annual Report. 2010. Available at: www.njrcentre.org.uk. Accessed September 27, 2011.
- 15.Pun SY, Ries MD. Effect of gender and preoperative diagnosis on results of revision total knee arthroplasty. Clin Orthop Relat Res. 2008;466:2701–2705. doi: 10.1007/s11999-008-0451-9. [DOI] [PMC free article] [PubMed] [Google Scholar]
- 16.Saleh KJ, Dykes DC, Tweedie RL, Mohamed K, Ravichandran A, Saleh RM, Gioe TJ, Heck DA. Functional outcome after total knee arthroplasty revision: a meta-analysis. J Arthroplasty. 2002;17:967–977. doi: 10.1054/arth.2002.35823. [DOI] [PubMed] [Google Scholar]
- 17.Sangha O, Stucki G, Liang MH, Fossel AH, Katz JN. The Self-Administered Comorbidity Questionnaire: a new method to assess comorbidity for clinical and health services research. Arthritis Rheum. 2003;49:156–163. doi: 10.1002/art.10993. [DOI] [PubMed] [Google Scholar]
- 18.Singh JA, O’Byrne MM, Harmsen WS, Lewallen DG. Predictors of moderate-severe functional limitation 2 and 5 years after revision total knee arthroplasty. J Arthroplasty. 2010;25:1091–1095. doi: 10.1016/j.arth.2009.07.020. [DOI] [PMC free article] [PubMed] [Google Scholar]
- 19.Theiler R, Spielberger J, Bischoff HA, Bellamy N, Huber J, Kroesen S. Clinical evaluation of the WOMAC 3.0 OA Index in numeric rating scale format using a computerized touch screen version. Osteoarthritis Cartilage. 2002;10:479–481. doi: 10.1053/joca.2002.0807. [DOI] [PubMed] [Google Scholar]
- 20.Ware JE., Jr SF-36 health survey update. Spine (Phila Pa 1976) 2000;25:3130–3139. doi: 10.1097/00007632-200012150-00008. [DOI] [PubMed] [Google Scholar]
- 21.Wright RJ, Sledge CB, Poss R, Ewald FC, Walsh ME, Lingard EA. Patient-reported outcome and survivorship after Kinemax total knee arthroplasty. J Bone Joint Surg Am. 2004;86:2464–2470. doi: 10.2106/00004623-200411000-00016. [DOI] [PubMed] [Google Scholar]
- 22.Wylde V, Blom AW. The failure of survivorship. J Bone Joint Surg Br. 2011;93:569–570. doi: 10.1302/0301-620X.93B5.26687. [DOI] [PubMed] [Google Scholar]
- 23.Wylde V, Learmonth I, Potter A, Bettinson K, Lingard E. Patient-reported outcomes after fixed- versus mobile-bearing total knee replacement: a multi-centre randomised controlled trial using the Kinemax total knee replacement. J Bone Joint Surg Br. 2008;90:1172–1179. doi: 10.1302/0301-620X.90B9.21031. [DOI] [PubMed] [Google Scholar]


