Abstract
Background
Screening mammography and invasive breast cancer and ductal carcinoma in situ (DCIS) rates recently declined in the United States; screening mammography declines among former hormone therapy (HT) users may be an important contributor. We longitudinally examined women and compared mammography use and cancer rates by HT use [current, former, and never users of estrogen+progestin (EPT) and estrogen-only (ET)].
Methods
We studied 163,490 unique women aged 50–79 years enrolled in Group Health (Washington State) between 1994–2009. Electronic data identified HT dispensing, mammography use and incident breast cancer diagnosis. We calculated age-adjusted screening compliance as a time-varying variable (screened-within-the-past-26 months, yes/no).
Results
Before 2002, screening compliance differed significantly by HT with current EPT users having the highest rates (83%) followed by former EPT (77%), current ET (77%), former ET (72%) and never users (56%). After 2002, screening was high (~81%) among current and former EPT and ET users and significantly increased among never users (~62%). Invasive breast cancer rates significantly decreased over the whole study period (ptrend≤0.05) for all HT users, except EPT current users (ptrend=0.68); DCIS rates did not change in any group.
Conclusions
Differential screening mammography rates by HT use do not explain invasive breast cancer incidence declines. Our data suggest discontinuing HT has an immediate effect on breast cancer rates, lending support to the mechanism that cessation leads to tumor regression.
Impact
Studies examining the influence of a changing exposure in relation to outcomes should account for varying exposures, individuals’ characteristics, as well as screening methods and frequency.
Keywords: screening mammography, breast cancer incidence, breast carcinoma, ductal carcinoma in situ, hormone therapy
BACKGROUND
Several previous studies have demonstrated a rapid decline in breast cancer incidence following the Women’s Health Initiative (WHI) trial publication in 2002 that demonstrated higher breast cancer rates in estrogen+progestion (EPT) users compared to placebo, but found no association among estrogen only (ET) users (1, 2). After study results were widely publicized, a dramatic decline occurred in both EPT and ET use among women in the US (3). Declines in annual US breast cancer rates have been reported ranging from 5% (4)-8.5% (4, 5) since the early 2000s; the most recent report suggests a 1.8% annual decrease between 2003–2007 (6, 7). These declines have not been consistently demonstrated in other countries, where varying proportions of HT formulations and use occurred before and after WHI, and breast cancer screening programs differed. Germany (8) Switzerland (9), Spain (10) and Canada (11) have all noted declines in breast cancer incidence, whereas New Zealand (12), Norway (13), the Netherlands (9), Scotland (14), and Italy (15) have reported no change.
We have previously described a number of hypotheses that may explain the declining incidence (16), but the leading hypothesis continues to point to the immediate cessation of hormone therapy (HT). Women may also be less inclined to undergo routine screening mammography if they stop taking HT, because they may be less concerned about their breast cancer risk or less likely to regularly see their physician. Notably, screening mammography use has declined in the US by 6.8% between 2000 and 2005 among women aged 50 to 64 years, and the decline is associated with decrease HT use (17). We would expect an immediate decline in early stage invasive breast cancer with screening mammography declines, because many non-palpable cancers would go undetected. We recently completed an analysis using data from the Breast Cancer Surveillance Consortium (BCSC) to address the hypothesis that women who used HT were less likely to return for screening mammograms after cessation (4). In that study, we had no information on those women who stopped HT and mammography screening, because most BCSC registries only capture HT use on women undergoing mammography.
This study was designed to address gaps in knowledge regarding the relationship between mammography, HT use and breast cancer incidence by linking individual women-level data on HT use (current, former and never by EPT and ET) to both mammography screening and breast cancer rates over time.
METHODS
We identified a dynamic cohort of women aged 50–79 years, with no prior history of breast cancer, who were enrolled in Group Health Cooperative’s integrated group practice in western Washington between 1994–2009 and linked their breast cancer risk factor data (18) to automated pharmacy dispensing data, enrollment files, and to the western Washington Surveillance Epidemiology and End Results (SEER) registry. Breast cancer risk factors were obtained through a survey taken at the time of the mammogram, and most women were part of the organized screening program that provided regular mailed reminders directly to women who were due for mammograms (19). Institutional Review Board approval was obtained for all study activities.
To ensure sufficient information on prior and current HT use among the cohort, we required ≥4 years of uninterrupted enrollment (“run-in period”). Women started contributing information to the analysis after 4 years of enrollment. We censored women at the first occurrence of any of the following dates: breast cancer diagnosis, disenrollment from Group Health (>60 day lapse in membership), (3, 20) death, 80th birthday, or the end of the study period (September 30, 2009). A total of 741,681 woman-years of analytic follow-up time (median of 3.3 years per woman) were obtained on 163,490 unique women.
Hormone therapy use was ascertained from our automated pharmacy data system and claims files and captured HT use from Group Health-owned pharmacies and external facilities if a claim was submitted (including Medicare Part D beneficiaries). Nearly all (≥95%) GHC members report filling all or almost all their prescriptions at GHC pharmacies (3, 21). Each dispensing was categorized as EPT or ET using previously developed methods (3). The intended duration of each drug dispensing was based on the number of estrogen pills or patches dispensed. We developed run-out dates for each successive dispensing and bridged gaps in dispensings that were <60 days to allow for some non-compliance with the dispensings (3). Each month, a woman was classified as a current, former or never user of EPT or ET. We defined the monthly indicators as follows: never users had no HT fills within the past 48 months, current users had an HT dispensing within the past two months, and former users had used HT in the last 3–48 months, but not in the last 2 months.
We included all mammograms that met the Breast Cancer Surveillance Consortium screening definition (22). Mammography examinations performed outside Group Health were captured using claims data. Each month, a woman was defined as being screening compliant if she received a screening mammogram in the prior 26 months. We chose 26 months (2 years and 2 months for timing flexibility), because Group Health recommends risk-based screening every 1 to 2 years, depending on a woman’s risk; additionally, 24 months is consistent with definition used for screening compliance by Healthcare Effectiveness Data and Information Set (23). Western Washington SEER data were used to identify all incident cancers diagnosed including ductal carcinoma in situ (DCIS) and invasive cancers.
Statistical Analysis
We summarized characteristics of the study cohort including total women and person-months of follow-up, the age and mammography distribution over time, and the temporal distribution of HT exposure. We also counted the number of women and characterized their age distribution within each of the HT exposure groups per year.
Women had monthly indicators for whether they were screening compliant (screened within the previous 26 months). Using these monthly data, we estimated the percent of screening compliant women for each year and HT exposure group, adjusted to the age distribution of the entire study population in the year 2000. Annual compliance rates were calculated based on an age-adjusted Poisson regression model estimated using generalized estimating equations (GEE) to account for within-woman correlation, and using the method of marginal standardization (24, 25).
Age and time-since-prior-screening-mammography adjusted invasive and DCIS cancer rates (per 1000 person-years), corresponding 95% CIs, and tests for cancer trends were also computed using marginal standardization and Poisson regression models. These adjusted rates were estimated for each year and HT exposure group, and were standardized to the age and mammography distribution of the study population in the year 2000. Two-sided Wald tests were performed (based on the regression models) to test contrasts for linear trends in the log-risk of cancer across the study period. All analyses were performed using SAS software, version 9.2 (SAS Institute, Inc., Cary, NC).
Results
Population Characteristics and HT Status
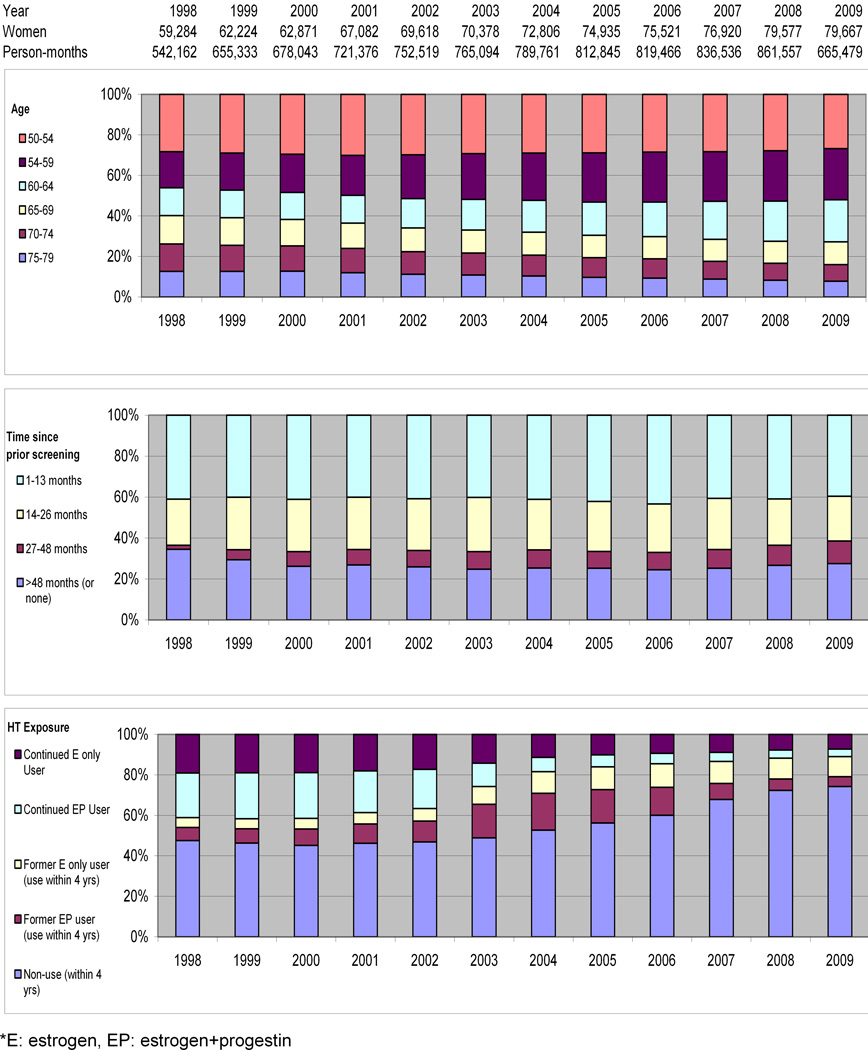
We studied 163,490 unique women (8,900,171 person-months). Our study population averaged 70,907 women per year with an annual average of 741,681 person-months and 25,721 screening mammograms. The number of women in our study population rose each year from 1998 (59,284) to 2009 (79,667). There were moderate fluctuations in the overall distribution of women by age and by time-since-last mammogram and we saw important changes in HT exposure (Figure 1). We noted a large decrease in current HT users over time: ~41% of the study population in 1998 to ~11% in 2009. The distribution of time-since-last screening mammography suggests the proportion of women with annual screening and 2-year screening intervals remained relatively unchanged between 1998–2009 (1998: 41% annual, 23% biennial; 2009: 40% annual, 22% biennial), but there was a decrease in the proportion of women with >48 month screening intervals (35% in 1998 to 28% in 2009).
Figure 1.
Distribution of study population by age, time since prior mammogram and hormone therepy* exposure stratified by year.
In 1998, 46% of women were aged 50–59, 28% were aged 60–69 and 26% were aged 70–79. There was a slow shift in the study population toward a greater proportion of younger women; by 2009, 52% were 50–59 and only 16% were aged 70–79 years (Figure 1). The age distribution also differed by HT group overall and across time (Figure 2). The absolute number in each HT group can be seen over time with the largest increase in never users from 30,009 in 1998 to 60,688 in 2009. The majority of former and continued EPT users were aged 50–59 years; the proportion of this age group increased in never users over the study period.
Figure 2.
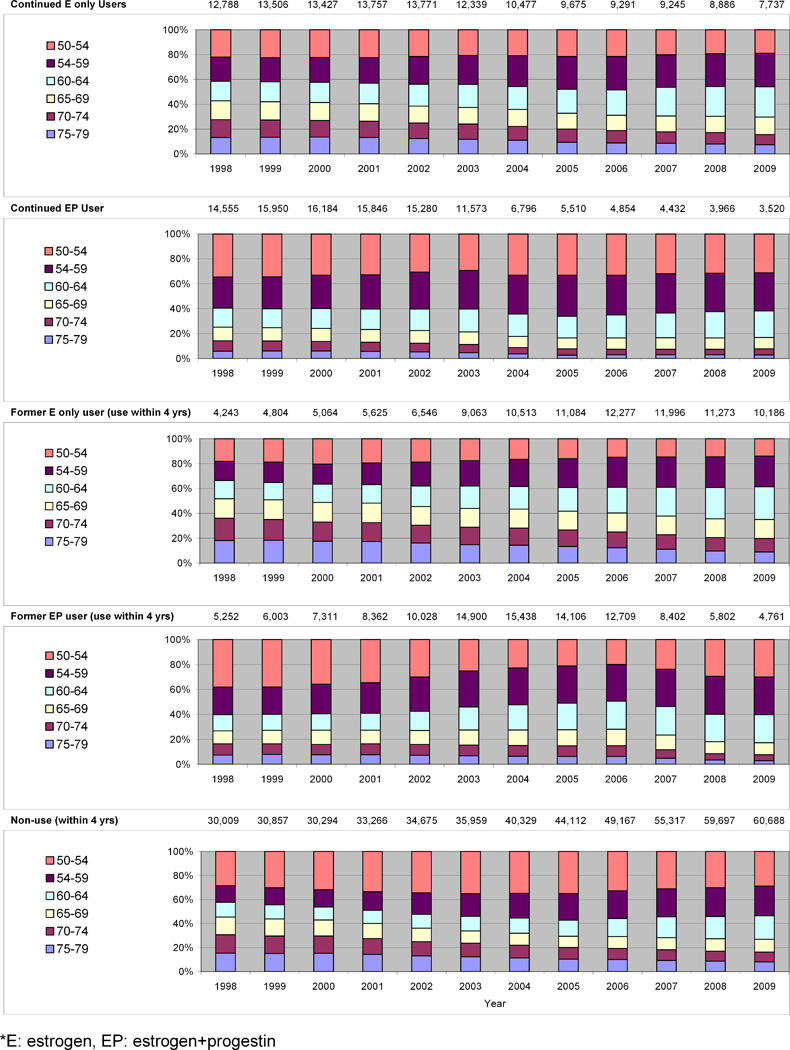
Temporal distribution of hormone therapy* use by age group
Screening by HT Status
Before 2002, screening compliance differed significantly by HT exposure with current EP users having the highest rates (83%) followed by former EPT (77%) and current ET (77%), former ET (72%) and never users hovering at the lowest around 56% (Figure 3). With the exception of current EPT users, screening increased among the different HT exposure groups in the first few years following release of the WHI findings. By 2006, screening compliance was similar among current and former users of both EPT and ET (~81%) and demonstrated significant increases among never users (~62%). The proportion of women in compliance in each group appeared to decrease after 2007 in all groups. Further, while screening increased among most groups between 2002–2006, the overall rate of screening compliance remained relatively constant and ultimately declined in the full population over the 12 year study period.
Figure 3.
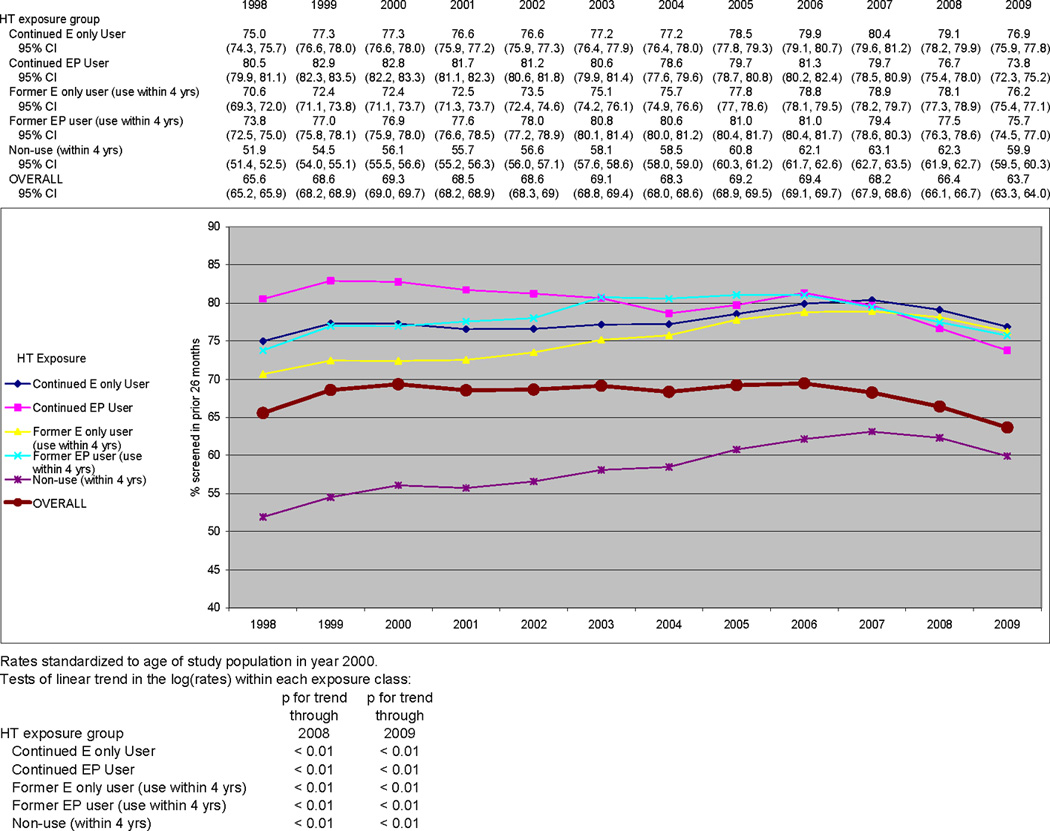
Temporal trends in the percent of women screening in the previous 26 months by HT use category
Cancer Rates
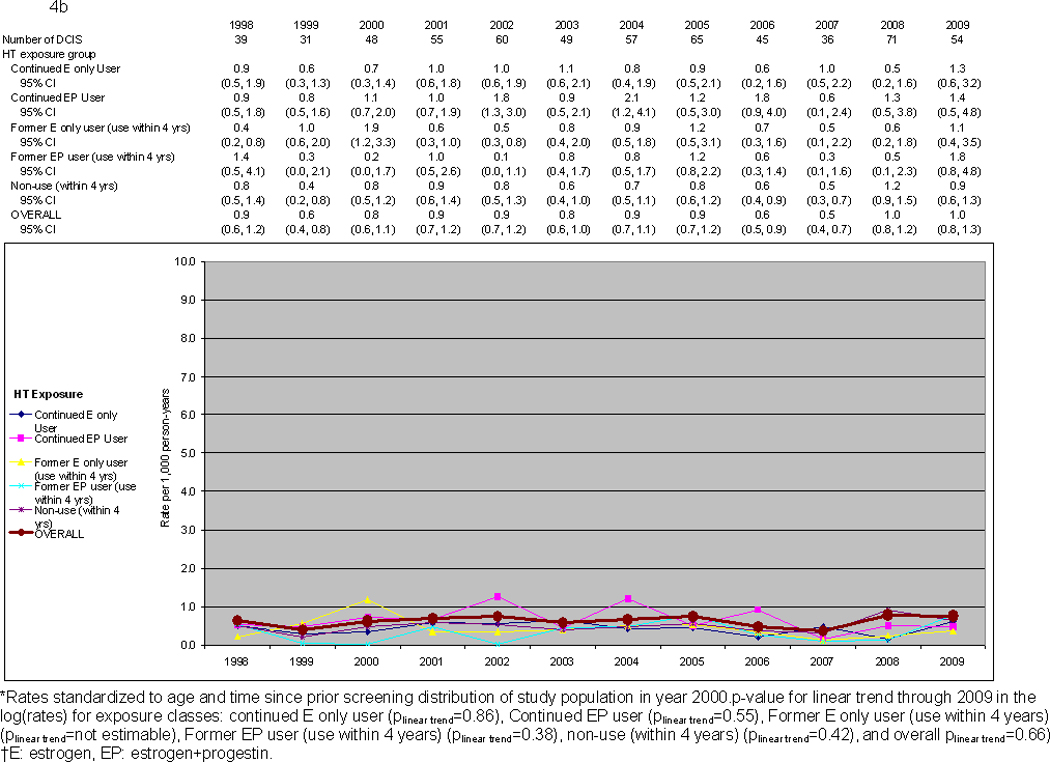
We observed 3,426 cancers over the study period (610 DCIS, 2,816 invasive), with an annual average of 51 DCIS and 235 invasive. The majority of invasive cancers were ER+ (2,180; annual average 182). After adjusting for time since prior screening mammogram and age, invasive breast cancer rates significantly decreased overall (all HT groups combined) across the study period (ptrend<0.01). When stratifying by HT exposure status, declines were significant (ptrend=0.01) or of borderline significance (ptrend=0.05,0.06) for four of the exposure groups. Current EPT users, however, experienced no significant change (ptrend=0.68) (Figure 4a). DCIS rates did not change over time across any HT group (Figure 4b).
Figure 4.
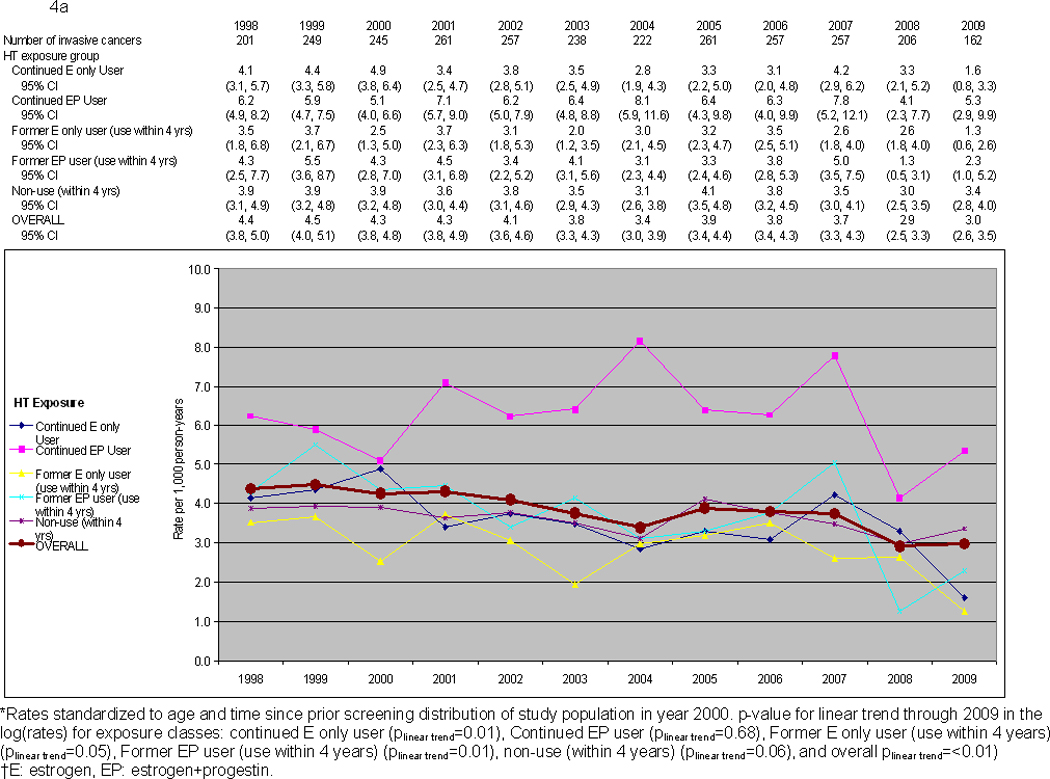
a. Temporal trends in invasive breast cancer rates by HT exposure
b. Temporal trends in DCIS rates by HT exposure
Discussion
This is the first study conducted to date that reports on patterns of mammography use for HT users by linking HT pharmacy dispensing and cancer rates within the same cohort of women over time. Consistent with other US reports, we observed clinically significant declines in HT use between 2002–2006 with the largest among women aged 50–69 years. The change in HT use translated into important changes in mammography screening patterns. Before 2002, former HT users had lower screening rates than current users; this is no longer true—former users have the same or even slightly higher screening rates than current users. During the same period of HT and mammography screening changes, we observed no changes in DCIS rates (p=0.66), but did observe a significant −3.5% average annual percent reduction in invasive cancers.
Screening mammography rates have decreased slightly over the past decade in our population, as has been seen in others (17). Prior literature has suggested former HT users have lower mammography screening compared to current users. This held true in our population only during the years before the EP WHI findings were released, after which former users in our study had the same or slightly higher rates than current users; similar findings to another cohort (26). Higher screening rates among women who discontinued use may reflect a healthy user screening predisposition or increased concern over breast cancer risk. Even though we demonstrate important increases in screening among non-HT users over time, the group’s screening compliance rate remains significantly lower than other HT exposure groups, which may help explain why mammography rates are decreasing in the US. Because of the timing of this study, we do not think rates of screening were affected by the 2009 change in mammography screening recommendations of the US Preventive Services Task Force, released in October, 2009 (27); furthermore, women in this population were mailed reminders when they were due or overdue for a screening mammogram.
We compared our observed trends in cancer rates to the underlying western Washington SEER registry rates over the same time period to provide a regional comparison for rates (28, 29). Ageadjusted DCIS rates (per 100,000) did not vary meaningfully with rates ranging between 33.4 (2000) and 37.7 (2004), similar to our population (28, 29). Invasive cancer rates (per 100,000) fluctuated a bit more with rates over 150 between 1998–2002, which decreased into the 130’s between 2003–2008 (28, 29).
An important limitation of these results is the precision of our cancer incidence estimates after stratification by HT status and year due to small sample sizes; particularly for DCIS rates. While the uncertainty around these incidence rates is high because of the small sample sizes in the HT subgroups, breast cancer incidence declines were observed among all HT groups except current EPT users and were limited to invasive cancers. These findings suggest cancer declines are not due to less screening, but are more likely due to EPT cessation reducing the promotion of established tumors. Unlike longer-term WHI EPT findings, we did not observe higher breast cancer rates among former EPT users.(30) Consistent with our findings were the recently reported long-term follow-up from the ET WHI trial with persistent lowered invasive breast cancer rates among former ET users.(31) However, neither WHI trial included in situ cancers; these account for 20% of all breast cancer diagnoses in the US (32).
Our study also has several strengths. We were able to collect accurate, automated hormone therapy data through Group Health Cooperative’s administrative pharmacy database, which has been shown to be 97% complete.(3, 21)These data enabled us to directly link exposure, screening and outcomes within an integrated delivery system where disenrollment is uncommon (20) and prescription drug coverage is not a barrier for most women. Managed care organizations such as Group Heatlh are also strongly represented in the US among insured individuals; as of 2008, 25% of the US population was enrolled in an HMO. (33) The Group Health racial and ethnic composition accurately mirrors western Washington state. Compared with the rest of the country, Group Health members are more likely to be Asian or Pacific Islanders (9% versus 5%), but less likely to be Black (4% versus 13%) or report Hispanic ethnicity (4% versus 16%).(34)
Continued surveillance in the US and other countries should focus on age-specific incidence, histologic subtypes, tumor characteristics (e.g., stage, size and severity), and outcomes following diagnosis (e.g., mortality) and take into account screening methods and frequency. Doing this will help further explain the decreased breast cancer incidence that has been observed in the US and other countries. Importantly, when studies are examining the influence of a changing exposure, HT in this example, it is important to examine and account for varying exposures (HT type and dose), exposure prevalence, and characteristics of individuals exposed.
Summary
Screening compliance within groups defined by HT use increased in the years immediately following WHI. However, because never-users of HT comprised a significantly greater proportion of women in the population and because this group has consistently exhibited much lower screening utilization than HT users, the population, as a whole, did not show increased mammography compliance. Differential screening mammography rates by HT use (current, former and never use) do not explain recent declines in invasive breast cancer incidence. Invasive breast cancer rates declined among all HT user groups, except EPT continued users. These data suggest that discontinuing HT—including EPT-- has an immediate effect on breast cancer rates, lending additional support (4, 5) to the mechanism that cessation leads to tumor regression.
Acknowledgements
Grant Support
The data collection was supported by a grant from the National Cancer Institute (CA63731) as part of the Breast Cancer Surveillance Consortium. Investigators time was covered by grant funding from the National Cancer Institute [U01CA63731, U01CA63740, U01CA86076, U01CA86082]. The collection of cancer incidence data used in this study was supported by the Cancer Surveillance System of the Fred Hutchinson Cancer Research Center, which is funded by Contract No. N01-CN-67009 and N01-PC-35142 from the Surveillance, Epidemiology and End Results (SEER) Program of the National Cancer Institute with additional support from the Fred Hutchinson Cancer Research Center and the State of Washington. A list of the BCSC investigators and procedures for requesting BCSC data for research purposes are available at: http://breastscreening.cancer.gov/.
Footnotes
The authors had full responsibility in the design of the study, the collection of the data, the analysis and interpretation of the data, the decision to submit the manuscript for publication, and the writing of the manuscript. The authors have no conflicts of interest.
References
- 1.Rossouw JE, Anderson GL, Prentice RL, LaCroix AZ, Kooperberg C, Stefanick ML, et al. Risks and benefits of estrogen plus progestin in healthy postmenopausal women: principal results From the Women's Health Initiative randomized controlled trial. JAMA. 2002;288:321–333. doi: 10.1001/jama.288.3.321. [DOI] [PubMed] [Google Scholar]
- 2.Anderson GL, Limacher M, Assaf AR, Bassford T, Beresford SA, Black H, et al. Effects of conjugated equine estrogen in postmenopausal women with hysterectomy: the Women's Health Initiative randomized controlled trial. JAMA. 2004;291:1701–1712. doi: 10.1001/jama.291.14.1701. [DOI] [PubMed] [Google Scholar]
- 3.Buist DS, Newton KM, Miglioretti DL, Beverly K, Connelly MT, Andrade S, et al. Hormone therapy prescribing patterns in the United States. Obstet Gynecol. 2004;104:1042–1050. doi: 10.1097/01.AOG.0000143826.38439.af. [DOI] [PubMed] [Google Scholar]
- 4.Kerlikowske K, Miglioretti DL, Buist DS, Walker R, Carney PA. Declines in invasive breast cancer and use of postmenopausal hormone therapy in a screening mammography population. J Natl Cancer Inst. 2007;99:1335–1339. doi: 10.1093/jnci/djm111. [DOI] [PubMed] [Google Scholar]
- 5.Ravdin PM, Cronin KA, Howlader N, Berg CD, Chlebowski RT, Feuer EJ, et al. The decrease in breast-cancer incidence in 2003 in the United States. N Engl J Med. 2007;356:1670–1674. doi: 10.1056/NEJMsr070105. [DOI] [PubMed] [Google Scholar]
- 6.Kohler BA, Ward E, McCarthy BJ, Schymura MJ, Ries LA, Eheman C, et al. Annual report to the nation on the status of cancer, 1975–2007, featuring tumors of the brain and other nervous system. J Natl Cancer Inst. 2011;103:714–736. doi: 10.1093/jnci/djr077. [DOI] [PMC free article] [PubMed] [Google Scholar]
- 7.Farhat GN, Walker R, Buist DS, Onega T, Kerlikowske K. Changes in invasive breast cancer and ductal carcinoma in situ rates in relation to the decline in hormone therapy use. J Clin Oncol. 2010;28:5140–5146. doi: 10.1200/JCO.2010.29.5121. [DOI] [PMC free article] [PubMed] [Google Scholar]
- 8.Katalinic A, Rawal R. Decline in breast cancer incidence after decrease in utilisation of hormone replacement therapy. Breast Cancer Res Treat. 2008;107:427–430. doi: 10.1007/s10549-007-9566-z. [DOI] [PubMed] [Google Scholar]
- 9.Verkooijen HM, Koot VC, Fioretta G, van der Heiden M, Schipper ME, Rapiti E, et al. Hormone replacement therapy, mammography screening and changing age-specific incidence rates of breast cancer: an ecological study comparing two European populations. Breast Cancer Res Treat. 2008;107:389–395. doi: 10.1007/s10549-007-9554-3. [DOI] [PubMed] [Google Scholar]
- 10.Pollan M, Pastor-Barriuso R, Ardanaz E, Arguelles M, Martos C, Galceran J, et al. Recent changes in breast cancer incidence in Spain, 1980–2004. J Natl Cancer Inst. 2009;101:1584–1591. doi: 10.1093/jnci/djp358. [DOI] [PMC free article] [PubMed] [Google Scholar]
- 11.Kliewer EV, Demers AA, Nugent ZJ. A decline in breast-cancer incidence. N Engl J Med. 2007;357:509–510. author reply 13. [PubMed] [Google Scholar]
- 12.Johnson M. Breast cancer drop linked to fall in use of HRT. 2006 Dec 20; 2006 [cited 2008 February 20]: Available from: http://www.nzherald.co.nz/topic/story.cfm?c_id=294&objectid=10416198.
- 13.Zahl PH, Maehlen J. A decline in breast-cancer incidence. N Engl J Med. 2007;357:510–511. author reply 3. [PubMed] [Google Scholar]
- 14.Vaidya JS. Re: Declines in invasive breast cancer and use of postmenopausal hormone therapy in a screening mammography population. J Natl Cancer Inst. 2008;100:598–599. doi: 10.1093/jnci/djn080. author reply 9. [DOI] [PubMed] [Google Scholar]
- 15.Ponti A, Rosso S, Zanetti R, Ricceri F, Tomatis M, Segnan N. Re: Breast cancer incidence, 1980–2006: combined roles of menopausal hormone therapy, screening mammography, and estrogen receptor status. J Natl Cancer Inst. 2007;99:1817–1818. doi: 10.1093/jnci/djm225. author reply 9. [DOI] [PubMed] [Google Scholar]
- 16.Kerlikowske K, Miglioretti DL, Ballard-Barbash R, Weaver DL, Buist DS, Barlow WE, et al. Prognostic characteristics of breast cancer among postmenopausal hormone users in a screened population. J Clin Oncol. 2003;21:4314–4321. doi: 10.1200/JCO.2003.05.151. [DOI] [PubMed] [Google Scholar]
- 17.Breen N, A Cronin K, Meissner HI, Taplin SH, Tangka FK, Tiro JA, et al. Reported drop in mammography : is this cause for concern? Cancer. 2007;109:2405–2409. doi: 10.1002/cncr.22723. [DOI] [PubMed] [Google Scholar]
- 18.National Cancer Institute. Breast Cancer Surveilance Consortium: Data elements, questionnaires & standard definitions. 2010 Dec 16; 2010 [cited 2011 October 3]; Available from: http://breastscreening.cancer.gov/data/elements.html.
- 19.Taplin SH, Ichikawa L, Buist DS, Seger D, White E. Evaluating organized breast cancer screening implementation: the prevention of late-stage disease? Cancer Epidemiol Biomarkers Prev. 2004;13:225–234. doi: 10.1158/1055-9965.epi-03-0206. [DOI] [PubMed] [Google Scholar]
- 20.Field TS, Cernieux J, Buist D, Geiger A, Lamerato L, Hart G, et al. Retention of enrollees following a cancer diagnosis within health maintenance organizations in the Cancer Research Network. J Natl Cancer Inst. 2004;96:148–152. doi: 10.1093/jnci/djh010. [DOI] [PubMed] [Google Scholar]
- 21.Boudreau DM, Daling JR, Malone KE, Gardner JS, Blough DK, Heckbert SR. A validation study of patient interview data and pharmacy records for antihypertensive, statin, and antidepressant medication use among older women. Am J Epidemiol. 2004;159:308–317. doi: 10.1093/aje/kwh038. [DOI] [PubMed] [Google Scholar]
- 22.National Cancer Institute. Breast Cancer Surveillance Consortium: BCSC Glossary of Terms. 2009 Sep 16; 2009 [cited 2011 January 9]; Available from: http://breastscreening.cancer.gov/data/bcsc_data_definitions.pdf.
- 23.Proposed changes to existing measures for HEDIS 2009: breast cancer screening (BCS) National Committee for Quality Assurance; 2008. [Google Scholar]
- 24.Lane PW, Nelder JA. Analysis of covariance and standardization as instances of prediction. Biometrics. 1982;38:613–621. [PubMed] [Google Scholar]
- 25.Graubard BI, Korn EL. Predictive margins with survey data. Biometrics. 1999;55:652–659. doi: 10.1111/j.0006-341x.1999.00652.x. [DOI] [PubMed] [Google Scholar]
- 26.Onega T, MacKenzie T, Weiss J, Goodrich M, Titus-Ernstoff L. Screening mammography intervals among postmenopausal hormone therapy users and nonusers. Cancer Causes Control. 2010;21:147–152. doi: 10.1007/s10552-009-9444-6. [DOI] [PMC free article] [PubMed] [Google Scholar]
- 27.US Preventive Services Task Force. Screening for Breast Cancer: U.S. Preventive Services Task Force Recommendation Statement. Ann Intern Med. 2009;151:716–726. doi: 10.7326/0003-4819-151-10-200911170-00008. [DOI] [PubMed] [Google Scholar]
- 28.SEER*Stat software. 7.0.5 ed. Bethesda, MD: National Cancer Institute; 2011. Surveillance Research Program. [Google Scholar]
- 29.Surveillance Epidemiology and End Results. SEER*Stat Database: Linked To County Attributes - Total U.S., 1969–2009 Counties. released April 2011, based on the November 2010 submission [cited 2011 October 3] Available from: http://www.seer.cancer.gov/
- 30.Chlebowski RT, Anderson GL, Gass M, Lane DS, Aragaki AK, Kuller LH, et al. Estrogen plus progestin and breast cancer incidence and mortality in postmenopausal women. JAMA. 2010;304:1684–1692. doi: 10.1001/jama.2010.1500. [DOI] [PMC free article] [PubMed] [Google Scholar]
- 31.LaCroix AZ, Chlebowski RT, Manson JE, Aragaki AK, Johnson KC, Martin L, et al. Health outcomes after stopping conjugated equine estrogens among postmenopausal women with prior hysterectomy: a randomized controlled trial. JAMA. 2011;305:1305–1314. doi: 10.1001/jama.2011.382. [DOI] [PMC free article] [PubMed] [Google Scholar]
- 32.Howlader N, Noone AM, Krapcho M, Neyman N, Aminou R, Waldron W, et al. SEER Cancer Statistics Review, 1975–2008, based on November 2010 SEER data submission, posted to the SEER web site, 2011. 2011 2011 [cited 2011 October 3]; Available from: http://seer.cancer.gov/csr/1975_2008/index.html.
- 33.U.S. Census Bureau. Table 154. Persons Enrolled in Health Maintenance Organizations (HMO's) by State. 2011 Sep 20; [cited 2012 January 12]; Available from: http://www.census.gov/compendia/statab/2012/tables/12s0154.xls.
- 34.U.S. Census Bureau. Table 6. Percent of the Projected Population by Race and Hispanic Origin for the United States: 2010 to 2050 (NP2008-T6) 2010 Aug 14; 2008 [cited 2012 January 12]; Available from: http://www.census.gov/population/www/projections/files/nation/summary/np2008-t6.xls.


