

Abstract
4-(Methylnitrosamino)-1-(3-pyridyl)-1-butanone (NNK) is a carcinogenic nitrosamine produced upon curing tobacco. It is present in tobacco smoke and undergoes metabolism to 4-(methylnitrosamino)-1-(3-pyridyl)-1-butanol (NNAL) in the lungs. NNAL undergoes further uridine diphosphate glucuronosyltransferase (UGT)-mediated metabolism to give N- and O-glucuronide metabolites, which together with free (non-conjugated) NNAL are then excreted in the urine. The ability to conduct validated analyses of free and conjugated NNAL in human urine is important in order to assess inter-individual differences in lung cancer risk from exposure to cigarette smoke. The use of stable isotope dilution (SID) methodology in combination with liquid chromatography/multiple reaction monitoring/mass spectrometry (LC/MRM-MS) provides the highest bioanalytical specificity possible for such analyses. We describe a novel derivatization procedure, which results in the formation of a pre-ionized N-propyl-NNAL derivative. The increased LC/MS sensitivity arising from this derivative then makes it possible to analyze free NNAL in only 0.25 mL urine. This substantial reduction in urine volume when compared with other methods that have been developed will help preserve the limited amounts of stored urine samples that are available from on-going longitudinal biomarker studies. The new high sensitivity SID LC/MRM-MS assay was employed to determine free and conjugated NNAL concentrations in urine samples from 60 individual disease-free smokers. Effects of inter-individual differences in urinary creatinine clearance on NNAL concentrations were then assessed and three metabolizer phenotypes were identified in the 60 subjects from the ratio of urinary NNAL glucuronides/free NNAL. Poor metabolizers (PMs, 14 subjects) with a ratio of NNAL glucuronides/free NNAL <2 (mean = 1.3), intermediate metabolizers (IMs, 36 subjects) with a ratio between 2 and 5 (mean = 3.4), and extensive metabolizers (EMs, 10 subjects) with a ratio >5 (mean = 11.1).
Tobacco use is the single largest preventable cause of disease and premature death in the United States, accounting for at least 30% of cancer deaths.[1] The nearly 40% reduction in male lung cancer deaths between 1991 and 2003 has been attributed to smoking declines in the last half century.[2] 4-(Methylnitrosamino)-1-(3-pyridyl)-1-butanone (NNK), a carcinogenic nitrosamine produced upon curing tobacco, is present at relatively high concentrations in tobacco smoke.[3] Therefore, it has been suggested that NNK is an important contributor to the etiology of lung and pancreatic cancer in smokers, oral cancer in smokeless tobacco users, and lung cancer in non-smokers exposed to environmental tobacco smoke.[4] The ketone that is present at C-1 of NNK is rapidly reduced to an alcohol in the lung primarily by aldo-keto reductases (AKRs) of the 1C family,[5] carbonyl reductase 1 (CBR1), and 11β-hydroxysteroid dehydrogenase type 1 (HSD1)[6] to give the carcinogenic NNAL metabolite (Fig. 1). NNK is rapidly converted into NNAL in the lung and then activated by CYP2A6 and CYP2A13[7,8] to hydroxylated reactive metabolites that alkylate DNA[9] with the concomitant formation of keto alcohol and diol metabolites, respectively (Fig. 1). NNAL is also converted into its O-glucuronide by UGT1A9, UGT2B7, and UGT2B17[10,11] and to its N-glucuronide by UGT1A4 and UG2B10 (Fig. 1).[11,12] The O- and N-glucuronide conjugates of NNAL are subsequently excreted in the urine. Urinary NNAL has been widely used as a biomarker of exposure to the carcinogen NNK in tobacco smoke,[4] whereas the amount of conjugated NNAL has been suggested to provide an index of how much detoxification has occurred.[13] Therefore, the absolute amount of free NNAL that is excreted together with the ratio of glucuronide metabolites to free NNAL can be employed as biomarkers to predict an individual’s risk of tobacco smoke-induced lung cancer.[14]
Figure 1.

Metabolism of NNAL and formation of DNA-adducts.
Stable isotope dilution (SID) combined liquid chromatography/multiple reaction monitoring/mass spectrometry (LC/MRM-MS) provides the most sensitive and specific methodology available for the analysis of biomarkers.[15] Under optimal operating conditions, the precursor to product ion is monitored many times per second, resulting in extremely reproducible chromatographic peak shapes. In this way, a heavy isotope labeled standard is used in SID LC/MRM-MS to establish the presence of a particular analyte using both the LC retention time and MS/MS mass selection of the triple quadrupole (TQ) instrument. This level of specificity cannot be attained with any other bioanalytical technique. A number of SID LC/MRM-MS assays have been reported for the analysis of NNAL metabolites in urine[16–20] and plasma.[21] However, the analysis of free urinary NNAL is much more challenging and requires larger volumes of urine – typically 5 mL.[16,20] For longitudinal cancer etiology studies there are often limited volumes of relevant biofluids available and so it is necessary to improve the analytical sensitivity in order to reduce the volume of biofluid required. The concept of using pre-ionized derivatives to improve sensitivity has been exploited for a number of different endogenous substances such as steroids[22–25] and lipids.[26–28] However, there is a paucity of reports on its utility for exogenously derived analytes. We found that the readily prepared pre-ionized (quaternary) N-propyl derivative of NNAL increases the sensitivity of analysis by a factor of almost 20. We have used this derivatization procedure coupled with SID LC/MRM-MS to validate an assay for NNAL and its glucuronide metabolites in the urine of tobacco smokers. This has made it possible to examine the relationship between the urinary concentrations of NNAL and its glucuronide metabolites and creatinine excretion in limited urine volumes. The method was also used to establish criteria for NNAL PM, IM, and EM phenotypes.
EXPERIMENTAL
Clinical study
Single-void urine specimens were obtained from subjects enrolled in an ongoing study of tobacco biomarkers at the University of Pennsylvania School of Medicine. All samples were aliquoted and frozen at −80°C within 1 h of collection. They were then stored at −80°C until analysis. Major exclusion criteria for the study were history of malignancy or chronic lung, cardiac, renal, or liver disease, and current nicotine replacement use. A questionnaire was administered to all subjects that collected basic demographics, detailed tobacco history, and a focused medical history including current medication use. The study was approved by the Institutional Review Board at the University of Pennsylvania, and all subjects gave written informed consent. Sixty urine samples were analyzed for free and conjugated NNAL.
Materials
4-(Methylnitrosamino)-1-(3-pyridyl)-1-butanol (NNAL) and 4-(methyl-[2H3]-nitrosamino)-1-(3-pyridyl)-1-butanol ([2H3]-NNAL) were obtained from Toronto Research Chemicals (Toronto, Canada). HPLC grade acetonitrile, ethyl acetate and ammonium acetate were obtained from Fisher Scientific Co. (Fair Lawn, NJ, USA). Deionized water for the preparation of mobile phases was produced in-house with a Milli-Q system (Millipore, Milford, MA, USA). Sodium phosphate monobasic, sodium phosphate dibasic, methyl iodide, ethyl iodide, n-propyl iodide and formic acid were purchased from Sigma-Aldrich (St. Louis, MO, USA). Disposable glass centrifuge tubes for extraction and derivatization were obtained from Kimble Chase (Vineland, NJ, USA).
Liquid chromatography
Chromatography was performed using a Waters HPLC system (Alliance 2690 Model, Waters Corporation, Milford, USA) equipped with a temperature-controlled autosampler. This was coupled with a TSQ Quantum Ultra triple quadruple mass spectrometer (TQ) (Thermo Electron) equipped with a heated electrospray ionization source (HESI). LC was conducted using a Phenomenex Luna C18 column (5 µm, 100 Å, 100 × 2 mm i.d.) preceded by a guard column of the same packing material. Solvent A was aqueous 10 mM ammonium acetate containing 1% acetonitrile and 0.01% (v/v) formic acid, and solvent B was acetonitrile. The flow rate was 0.2 mL/min. A linear gradient was run as follows: 0 min, 0% B; 5 min, 0% B; 14 min, 100% B; 16 min, 100% B; 18 min, 0% B; and 28 min, 0% B. The samples (100 µL) were maintained at 4°C in the autosampler tray, and 20 µL of sample was injected for analysis. The gradient was started immediately after the sample injection.
Mass spectrometry
The mass spectrometer was tuned to its optimal sensitivity by directly infusing a solution of aqueous 1000 ng/mL of derivatized NNAL into the ion source via a syringe pump with a continuous infusion of 50% acetonitrile containing 10 mM ammonium acetate and 0.01% formic acid (v/v) at a flow rate of 0.2 mL/min. The capillary temperature was 350°C, the spray voltage was 4500 V, and the vaporizer temperature was 350°C. Nitrogen was used for the sheath gas and auxiliary gas set at 35 and 15 (arbitrary units), respectively. Data was acquired in the MRM mode.
Preparation of stock and standard solutions
Solutions of NNAL and [2H3]-NNAL were prepared separately at a concentration of 1000 ng/mL from respective parent stocks of 1 mg/mL in methanol through serial dilution in methanol and kept frozen at −20°C. For spiking into the urine samples, [2H3]-NNAL was prepared at a concentration of 5 ng/mL in water through serial dilution of 1000 ng/mL solution. Similarly the highest calibration standard solution of NNAL at a concentration of 5 ng/mL in water was prepared from the 1000 ng/mL solution by serial dilution. All other calibration standard solutions were prepared from the highest calibration standard solution by sequential dilutions with water. Quality control (QC) solutions were prepared again by serial dilution of highest calibration standard solution of NNAL (5 ng/mL) with water. NNAL QC solutions were prepared in NNAL-free urine at the lower limit of quantitation (LLOQ) of 20 pg/mL urine (0.10 nM); lower quartile quality control (LQC), 40 pg/mL urine (0.19 nM); mid-range quality control (MQC), 200 pg/mL urine (0.96 nM); and the upper quartile quality control (HQC), 800 pg/mL urine (3.83 nM). Pooled urine from a male non-smoker with no known ETS exposure was used to prepare all calibration standards and the QCs. All standards and controls were frozen at −20°C until used. Free and conjugated NNAL in this urine sample was below the limit of detection of the assay.
Sample preparation for analysis by LC/MS
Samples were analyzed for free and total NNAL separately in 0.25 mL urine. Urine samples in 5 mL glass centrifuge tubes were spiked with 50 µL of 5 ng/mL [2H3]-NNAL (1 ng/mL final concentration) internal standard solution followed by addition of 200 µL of sodium phosphate buffer (1 M, pH 6.8). For total NNAL analysis urine samples were treated with 750 units of β-glucuronidase contained in 50 µL of water. Samples were capped and after brief vortex-mixing these were incubated at 37°C for 20 h with gentle shaking. Additional units of β-glucuronidase and/or an increase in incubation times did not lead to a significant increase in the conversion of NNAL-glucuronides to free NNAL. Ethyl acetate (2 mL) was added, and the samples were extracted by vortex-mixing for 5 min. The two phases were separated by centrifugation at high speed for 5 min; the upper ethyl acetate layer was transferred to 15 mL glass centrifuge tubes and dried under a N2 stream. Dried urine extracts were then derivatized by addition of 100 µL acetonitrile/n-propyl iodide 80/20 (v/v). Tubes were vortex-mixed, tightly capped and incubated at 60°C for 12 h. The reaction mixture was then dried under a N2 stream and dissolved in 1% formic acid in water. Ethyl acetate (6 mL) was added, vortex-mixed, the tubes centrifuged, and the upper ethyl acetate layer was discarded. The pH of the aqueous phase was increased to 8 by addition of 0.5 mL of 5% ammonium hydroxide in water and purified using a WCX (Waters) solid-phase extraction (SPE) column, which is a weak mixed-mode cation exchanger suitable for extraction of quaternary amines. Elution of the derivative was performed using 1 mL of 5% formic acid in methanol. Purified extracts were dried in a speed vacuum concentrator and reconstituted in 100 µL of starting mobile phase. Reconstituted samples were transferred to HPLC vials and 20 µL injections were made for analysis. The MRM/MS transitions [M+] 255.1 → 225.1 (M+-NO) and 252.1 [M+] → 222.1 (M+-NO) at a collision energy of 12 eV were used for the N-propyl derivatives of [2H3]-NNAL and NNAL, respectively.
Method sensitivity
Sensitivity of the method was evaluated by spiking four different concentrations – 50, 100, 500 and 1000 pg/mL – in 0.25 mL urine. Evaluation was done by comparing the peak areas of NNAL after extraction and derivatization with NNAL which was extracted but not derivatized.
Data analysis
NNAL concentrations were determined from the ratio of the peak area of NNAL to the [2H3]-NNAL by interpolation from the standard curve. Quantification was performed using X-caliber® software. Calibration curves were plotted using a linear regression. Eight NNAL calibration standards spanning from 20 to 1000 pg/mL were included in every sample set analysis. In every sample set, QC samples were also run at four different levels that were chosen so as to match low, moderate and high levels of NNAL found in smoker urine.
RESULTS AND DISCUSSION
Liquid chromatography
During the initial course of method development and validation, several different LC columns and relevant solvent systems were evaluated for the best chromatographic separations of analyte from background interference. Poor peak shapes were observed on most columns, except those with C18 and C8 stationary phases. However, if the starting mobile phase contained >2% organic modifier, poor peak shapes were also observed. Therefore, the initial mobile phase was chosen as 100% 10 mM aqueous ammonium acetate containing 1% acetonitrile and 0.01% formic acid (v/v). The C18 column was held at ambient temperature during gradient elution. Under these conditions, the C18 stationary phase had not degraded significantly after >500 analyses.
Mass spectrometry
Using HESI in the positive ion mode, N-propyl-NNAL and [2H3]-N-propyl-NNAL exhibited intense M+ at m/z 252 and 255, respectively (Table 1). CID and MS/MS analysis of M+ (m/z 252) from N-propyl-NNAL revealed product ions at m/z 222, 191, 163, 150, 135, and 122 (Fig. 2(A)). The product ion spectrum of [2H3]-propyl-NNAL was quite similar to that obtained from the protium analog because only the M+–NO ion retained the [2H3]-methyl group (Fig. 2(B)). An almost identical series of product ions was observed previously for MH+ of NNAL.[20] However, the proposed fragmentation pathway for MH+ of NNAL would not account for the product ions observed in the pre-ionized N-propyl derivative. It seems likely that product ions derived from both protonated and N-propyl forms of NNAL actually arise through a remote charge fragmentation pathway.[29] The initial fragmentation involves loss of an NO radical to generate a charge remote radical cation (Figs. 2 and 3). This is followed by the loss of the methylamino group and cleavage along the butyl backbone (Fig. 3). Confirmation of the proposed mechanism was obtained by analysis of the methyl and ethyl derivatives of NNAL and [2H3]-NNAL (Table 1). For quantitative LC/MRM-MS analysis of the N-propyl derivatives of urinary NNAL, product ions corresponding to loss of the NO radical at m/z 222 and 225 from the protium and deuterium analogs, respectively, were employed.
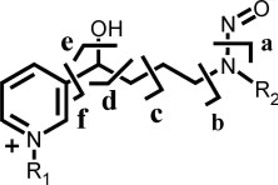
Table 1.
Product ions formed on CID analysis of NNAL and alkylated derivatives
 | ||||||||
|---|---|---|---|---|---|---|---|---|
| R1 | R2 | [M]+ | a | b | c | d | e | f |
| H | CH3 | 210 | 180 | 149 | 121 | 108 | 93 | 80 |
| H | CD3 | 213 | 183 | 149 | 121 | 108 | 93 | 80 |
| CH3 | CH3 | 224 | 194 | 163 | 135 | 122 | 107 | 94 |
| CH3 | CD3 | 227 | 197 | 163 | 135 | 122 | 107 | 94 |
| C2H5 | CH3 | 238 | 208 | 177 | 149 | 136 | 121 | 108 |
| C2H5 | CD3 | 241 | 211 | 177 | 149 | 136 | 121 | 108 |
| C3H7 | CH3 | 252 | 222 | 191 | 163 | 150 | 135 | 122 |
| C3H7 | CD3 | 255 | 225 | 191 | 163 | 150 | 135 | 122 |
Figure 2.

Product ion spectra of (A) N-propyl-NNAL and (B) [2H3]-N-propyl-NNAL.
Figure 3.

Fragmentation pathways of NNAL and N-alkylated derivatives.
Internal standard
The use of a deuterated internal standard is convenient as described previously by Pan et al.[21] However, it is not ideal because of the potential for deuterium exchange and the separation of deuterium and protium analogs that are often observed during LC analysis.[30–32] Deuterium exchange could have been problematic because methanol was used as stock solvent for NNAL and deuterated NNAL and acidic conditions were employed for purifying the derivative from the urine. In spite of this potential problem no exchange was observed when the internal standard was analyzed alone. We consistently found that that after NNAL derivatization, the protium contribution was <0.05%. Furthermore, there was <0.02 min separation between the deuterium and protium forms of the NNAL propionate derivatives, which would minimize any differential suppression of ionization between the analyte and its deuterated internal standard.[33–35]
Assay validation
Standard curves were linear from 20 to 1000 pg/mL urine with typical r2 >0.99 using linear regression. Over this range, validation of five replicate LLOQ, LOQ, MQC and HQC samples on one day (Table 2) and three separate days (Table 3) met the criteria of precision of 15% and accuracy between 85% and 115%. Typical chromatograms for a blank urine sample and the LLOQ samples are shown in Fig. 4. Similar chromatograms were obtained from six other blank urine samples from non-smoking control subjects. A typical standard curve is shown in Fig. 5.
Table 2.
Intra-day variation for analysis of urinary NNAL on day 1 (n = 5) in pg/mL and nM
| QC (n = 5) |
Theoretical (pg/mL) |
Calculated mean (pg/mL) |
Theoretical (nM) |
Calculated mean (nM) |
Precision (%) |
Accuracy (%) |
|---|---|---|---|---|---|---|
| LLOQ | 20 | 19.6 | 0.10 | 0.09 | 10.7 | 97.8 |
| LQC | 40 | 37.6 | 0.19 | 0.18 | 6.4 | 94.0 |
| MQC | 200 | 189.5 | 0.96 | 0.91 | 3.6 | 94.8 |
| HQC | 800 | 804.4 | 3.83 | 3.85 | 3.0 | 100.5 |
Table 3.
Inter-day variation (n = 3) for analysis of urinary NNAL (n = 5) in pg/mL and nM
| QC (n = 5) |
Theoretical (pg/mL) |
Calculated mean (pg/mL) |
Theoretical (nM) |
Calculated mean (nM) |
Precision (%) |
Accuracy (%) |
|---|---|---|---|---|---|---|
| LLOQ | 20 | 20.6 | 0.10 | 0.10 | 10.8 | 103.0 |
| LQC | 40 | 38.1 | 0.19 | 0.18 | 11.3 | 95.3 |
| MQC | 200 | 197.3 | 0.96 | 0.94 | 6.1 | 98.7 |
| HQC | 800 | 797.7 | 3.83 | 3.81 | 3.9 | 99.7 |
Figure 4.

LC/MRM-MS analysis of (A) blank urine and (B) LLOQ (20 pg/mL urine; 0.10 nM).
Figure 5.

Standard curve for NNAL in urine from a non-smoker not exposed to second-hand smoke.
Stability analysis
The stability tests were designed to match the expected conditions clinical samples may experience. The QC samples were stored at −80°C for 22 h and then taken out and kept at room temperature for 2 h. This was repeated for three cycles of freezing and thawing. No degradation was observed for all four levels of QC samples and data were essentially identical with those shown in Table 2. Therefore, repeated freezing and thawing did not affect the stability of NNAL. Extracted calibration standards and QC samples were also allowed to stand in the carousel at 4°C for 48 h prior to injection. No effect on quantitation of the calibration standards or QC samples was observed (data not shown). This confirmed that N-propyl-NNAL was stable in the autosampler. We did not specifically address the issue of stability of urinary NNAL and its glucuronides on long-term storage. However, a recent study analyzed urine samples stored at −20 and −70°C at scheduled time intervals (28 days) over a period of 4 years.[36] No significant deterioration in the urinary NNAL or glucuronide metabolites was observed.
Method sensitivity
The increase in sensitivity obtained by N-propyl derivatization was evaluated by comparing the peak areas of derivatized and underivatized samples of four different spiked concentrations – 50, 100, 500, and 1000 pg/mL – in 0.25 mL urine. The underivatized NNAL was eluted under the same LC conditions as the derivatized NNAL. The underivatized NNAL could not be detected reliably at the concentration of 50 pg/mL of urine. However derivatization of NNAL to its N-propyl derivative enhanced the signal 20-fold. Typical chromatograms for the analysis of N-propyl-NNAL in the urine of a smoker before and after treatment with β-glucuronidase are shown in Fig. 6.
Figure 6.

LC/MRM-MS analysis of NNAL in urine from smoking subject: (A) before β-glucuronidase treatment (124 pg/mL urine, 0.59 nM) and (B) after β-glucuronidase treatment (322 pg/mL urine, 1.54 nM).
Method application
The performance of the method was checked by analyzing urinary NNAL concentrations of disease-free tobacco smokers (n = 60). Samples that were above the standard curve range were diluted five times with control urine and re-analyzed. Free NNAL concentrations ranged from 20 to 635.8 pg/mL (0.1 to 3.0 nM) with a mean of 151.6 pg/mL, SEM ± 17.9 pg/mL (0.7 ± 0.1 nM), conjugated NNAL concentrations ranged from 0.1 to 14.6 nM with a mean of 2.63 ± 0.39 nM, and total concentrations ranged from 0.2 nM to 16.0 nM with a mean of 3.4 ± 0.5 nM (Fig. 7(A)). Urinary creatinine concentrations for the 60 subjects were determined by LC/MS using a modification of a previously published procedure[37] and NNAL values were then corrected for urine flow. A similar trend was observed when NNAL values were expressed as pmol/mg creatinine (Fig. 7(B)) when compared with concentrations expressed as nM (Fig. 7(A)). There were some striking inter-individual differences in the ratio of NNAL-glucuronides/free NNAL using either concentration or values normalized for creatinine clearance. Further analysis revealed that there were three metabolizer phenotypes, PMs (14 subjects) with a ratio of NNAL glucuronides/free NNAL <2 (mean = 1.3), IMs (36 subjects) with a ratio between 2 and 5 (mean = 3.4), and EMs (10 subjects) with a ratio >5 (mean = 11.1) (Fig. 8).
Figure 7.

Comparison of free, conjugated and total urinary NNAL for 60 smokers: (A)NNAL (nM) and (B) NNAL pmol/mg creatinine. Horizontal lines show the means.
Figure 8.

Metabolizer phenotypes for 60 disease-free smokers. PM = poor metabolizer (ratio <2). IM = intermediate metabolizer (ratio between 2 and 5). EM = extensive metabolizer (ratio >5). Horizontal lines show the means.
CONCLUSIONS
A rapid analytical method based on liquid chromatography coupled with mass spectrometry has been developed and validated for the sensitive detection and quantification of NNAL. The method demonstrated sufficient sensitivity to detect low ranges of NNAL found in smokers’ urine and made it possible to work with less sample volume. A key advantage of our method is that the N-propyl derivatization of urine extracts with n-propyl iodide enhanced the sensitivity of detection and quantification of NNAL in smokers’ urine. N-Propyl derivatization also facilitated efficient clean-up of urine samples through the use of mixed-mode weak cation-exchange SPE columns. Using this new method we have identified three different metabolizer phenotypes from a cohort of 60 disease-free tobacco smokers. It will be interesting to determine whether these phenotypes reflect the nicotine metabolizer phenotype,[38] NNAL-mediated DNA-adduct formation,[9] and susceptibility to lung cancer risk.[14] This new method also broadens the scope of N-propyl derivatization to sensitive quantification of other nitrosamines in tobacco smoke such as N-nitrosoanatabine, N-nitrosoanabasine, and N-nitrosonornicotine.[20,39]
Acknowledgements
We acknowledge the support of NIH grants UO1ES16004 and P30ES0130508.
REFERENCES
- 1.Cancer Facts and Figures 2009. Atlanta, GA: Amerian Cancer Society; 2009. [Google Scholar]
- 2.Cokkinides V, Bandi P, McMahon C, Jemal A, Glynn T, Ward E. CA Cancer J. Clin. 2009;59:352. doi: 10.3322/caac.20037. [DOI] [PubMed] [Google Scholar]
- 3.Hecht SS. Chem. Res. Toxicol. 2008;21:160. doi: 10.1021/tx7002068. [DOI] [PMC free article] [PubMed] [Google Scholar]
- 4.Carmella SG, Han S, Fristad A, Yang Y, Hecht SS. Cancer Epidemiol. Biomarkers Prevent. 2003;12:1257. [PubMed] [Google Scholar]
- 5.Penning TM, Drury JE. Arch. Biochem. Biophys. 2007;464:241. doi: 10.1016/j.abb.2007.04.024. [DOI] [PMC free article] [PubMed] [Google Scholar]
- 6.Breyer-Pfaff U, Martin HJ, Ernst M, Maser E. Drug Metab. Dispos. 2004;32:915. [PubMed] [Google Scholar]
- 7.Su T, Bao Z, Zhang QY, Smith TJ, Hong JY, Ding X. Cancer Res. 2000;60:5074. [PubMed] [Google Scholar]
- 8.Rossini A, de Almeida ST, Albano RM, Pinto LF. Pharmacogenomics. 2008;9:1737. doi: 10.2217/14622416.9.11.1737. [DOI] [PubMed] [Google Scholar]
- 9.Upadhyaya P, Lindgren BR, Hecht SS. Drug Metab Dispos. 2009;37:1147. doi: 10.1124/dmd.109.027078. [DOI] [PMC free article] [PubMed] [Google Scholar]
- 10.Ren Q, Murphy SE, Zheng Z, Lazarus P. Drug Metab. Dispos. 2000;28:1352. [PubMed] [Google Scholar]
- 11.Gallagher CJ, Muscat JE, Hicks AN, Zheng Y, Dyer AM, Chase GA, Richie J, Lazarus P. Cancer Epidemiol. Biomarkers Prevent. 2007;16:823. doi: 10.1158/1055-9965.EPI-06-0823. [DOI] [PubMed] [Google Scholar]
- 12.Wiener D, Fang JL, Dossett N, Lazarus P. Cancer Res. 2004;64:1190. doi: 10.1158/0008-5472.can-03-3219. [DOI] [PubMed] [Google Scholar]
- 13.Lazarus P, Zheng Y, Aaron RE, Muscat JE, Wiener D. Pharmacogenet. Genomics. 2005;15:769. doi: 10.1097/01.fpc.0000175596.52443.ef. [DOI] [PubMed] [Google Scholar]
- 14.Derby KS, Cuthrell K, Caberto C, Carmella S, Murphy SE, Hecht SS, Le ML. Int. J. Cancer. 2009;125:2418. doi: 10.1002/ijc.24585. [DOI] [PMC free article] [PubMed] [Google Scholar]
- 15.Ciccimaro E, Blair IA. Bioanalysis. 2010;2:311. doi: 10.4155/bio.09.185. [DOI] [PMC free article] [PubMed] [Google Scholar]
- 16.Byrd GD, Ogden MW. J. Mass Spectrom. 2003;38:98. doi: 10.1002/jms.406. [DOI] [PubMed] [Google Scholar]
- 17.Xia Y, McGuffey JE, Bhattacharyya S, Sellergren B, Yilmaz E, Wang L, Bernert JT. Anal. Chem. 2005;77:7639. doi: 10.1021/ac058027u. [DOI] [PubMed] [Google Scholar]
- 18.Jacob P, III, Havel C, Lee DH, Yu L, Eisner MD, Benowitz NL. Anal. Chem. 2008;80:8115. doi: 10.1021/ac8009005. [DOI] [PMC free article] [PubMed] [Google Scholar]
- 19.Lee HL, Wang C, Lin S, Hsieh DP. Talanta. 2007;73:76. doi: 10.1016/j.talanta.2007.03.001. [DOI] [PubMed] [Google Scholar]
- 20.Kavvadias D, Scherer G, Urban M, Cheung F, Errington G, Shepperd J, McEwan M. J. Chromatogr. B. 2009;877:1185. doi: 10.1016/j.jchromb.2009.03.009. [DOI] [PubMed] [Google Scholar]
- 21.Pan J, Song Q, Shi H, King M, Junga H, Zhou S, Naidong W. Rapid Commun. Mass Spectrom. 2004;18:2549. doi: 10.1002/rcm.1656. [DOI] [PubMed] [Google Scholar]
- 22.Griffiths WJ, Liu S, Alvelius G, Sjovall J. Rapid Commun. Mass Spectrom. 2003;17:924. doi: 10.1002/rcm.1002. [DOI] [PubMed] [Google Scholar]
- 23.Yang WC, Regnier FE, Sliva D, Adamec J. J. Chromatogr. B. 2008;870:233. doi: 10.1016/j.jchromb.2008.06.026. [DOI] [PMC free article] [PubMed] [Google Scholar]
- 24.Blair IA. Steroids. 2010;75:297. doi: 10.1016/j.steroids.2010.01.012. [DOI] [PMC free article] [PubMed] [Google Scholar]
- 25.Johnson DW. Rapid Commun. Mass Spectrom. 2005;19:193. doi: 10.1002/rcm.1771. [DOI] [PubMed] [Google Scholar]
- 26.Lee SH, Pettinella C, Blair IA. Curr.Drug Metab. 2006;7:929. doi: 10.2174/138920006779010584. [DOI] [PubMed] [Google Scholar]
- 27.Pettinella C, Lee SH, Cipollone F, Blair IA. J. Chromatogr. B. 2007;850:168. doi: 10.1016/j.jchromb.2006.11.023. [DOI] [PubMed] [Google Scholar]
- 28.Johnson DW, Trinh MU. Rapid Commun. Mass Spectrom. 2003;17:171. doi: 10.1002/rcm.889. [DOI] [PubMed] [Google Scholar]
- 29.Cheng C, Gross ML. Mass Spectrom. Rev. 2000;19:398. doi: 10.1002/1098-2787(2000)19:6<398::AID-MAS3>3.0.CO;2-B. [DOI] [PubMed] [Google Scholar]
- 30.Zhang R, Sioma CS, Thompson RA, Xiong L, Regnier FE. Anal. Chem. 2002;74:3662. doi: 10.1021/ac025614w. [DOI] [PubMed] [Google Scholar]
- 31.Remane D, Wissenbach DK, Meyer MR, Maurer HH. Rapid Commun. Mass Spectrom. 2010;24:859. doi: 10.1002/rcm.4459. [DOI] [PubMed] [Google Scholar]
- 32.Mesaros C, Lee SH, Blair IA. Rapid Commun. Mass Spectrom. 2010 doi: 10.1002/rcm.4760. in press. [DOI] [PMC free article] [PubMed] [Google Scholar]
- 33.King R, Bonfiglio R, Fernandez-Metzler C, Miller-Stein C, Olah T. J. Am. Soc. Mass Spectrom. 2000;11:942. doi: 10.1016/S1044-0305(00)00163-X. [DOI] [PubMed] [Google Scholar]
- 34.Bonfiglio R, King RC, Olah TV, Merkle K. Rapid Commun. Mass Spectrom. 1999;13:1175. doi: 10.1002/(SICI)1097-0231(19990630)13:12<1175::AID-RCM639>3.0.CO;2-0. [DOI] [PubMed] [Google Scholar]
- 35.Matuszewski BK. J. Chromatogr. B. 2006;830:293. doi: 10.1016/j.jchromb.2005.11.009. [DOI] [PubMed] [Google Scholar]
- 36.Xia Y, Bernert JT. J. Anal. Toxicol. 2010;34:411. doi: 10.1093/jat/34.7.411. [DOI] [PubMed] [Google Scholar]
- 37.Teichert F, Verschoyle RD, Greaves P, Thorpe JF, Mellon JK, Steward WP, Farmer PB, Gescher AJ, Singh R. Rapid Commun. Mass Spectrom. 2009;23:258. doi: 10.1002/rcm.3873. [DOI] [PubMed] [Google Scholar]
- 38.Schnoll RA, Patterson F, Wileyto EP, Tyndale RF, Benowitz N, Lerman C. Pharmacol. Biochem. Behav. 2009;92:6. doi: 10.1016/j.pbb.2008.10.016. [DOI] [PMC free article] [PubMed] [Google Scholar]
- 39.Kavvadias D, Scherer G, Cheung F, Errington G, Shepperd J, McEwan M. Biomarkers. 2009;14:547. doi: 10.3109/13547500903242883. [DOI] [PubMed] [Google Scholar]