Abstract
We describe a mouse model in which p27Kip1 transgene expression is spatially restricted to the central nervous system neuroepithelium and temporally controlled with doxycycline. Transgene-specific transcripts are detectable within 6 h of doxycycline administration, and maximum nonlethal expression is approached within 12 h. After 18–26 h of transgene expression, the G1 phase of the cell cycle is estimated to increase from 9 to 13 h in the neocortical neuroepithelium, the maximum G1 phase length attainable in this proliferative population in normal mice. Thus our data establish a direct link between p27Kip1 and control of G1 phase length in the mammalian central nervous system and unveil intrinsic mechanisms that constrain the G1 phase length to a putative physiological maximum despite ongoing p27Kip1 transgene expression.
Neocortical projection neurons arise from a pseudostratified ventricular epithelium (PVE) that forms the margins of the embryonic lateral ventricles (1–4). By the time young neurons exit the PVE, they are already specified with respect to class and the architectonic region of the neocortex for which they are destined (5–10). In mouse, the pace of neuron origin and the events of specification, scheduled coordinately over a series of 11 cell cycles, are determined by the proportion of postmitotic cells that exit from the PVE with each cycle [as part of the mitotically quiescent fraction (Q)] and the duration of the cell cycle (TC). Both Q and TC advance in cycle-specific increments during the 11-cycle sequence (11, 12). The lengthening of TC is due exclusively to the lengthening of the duration of the G1 phase (TG1) (11). However, virtually nothing is known about the mechanisms that govern TG1 and its rate of advance with cycle progression.
The coordinate regulation of TG1 and Q is a property of the intact neuroepithelium, and reproducing this process in dissociated cells or explants is not currently possible. More fundamentally with respect to histogenetic regulation, no experimental system is available to examine the coordinate regulation of TG1 and Q. An examination of the mechanisms that regulate these two parameters will require an in vivo experimental system in which molecular mechanisms critical to the progression of TG1 can be targeted selectively and modulated over a specified number of cell cycles. To this end, we engineered mice in which the expression of a cell cycle regulator transgene, p27Kip1, is spatially restricted to the central nervous system (CNS) neuroepithelium and temporally controlled by doxycycline (dox). We chose p27Kip1 from among a variety of proteins that regulate the vertebrate cell cycle because several lines of evidence specifically implicate p27Kip1 in vertebrate CNS cell proliferation (13–15). Furthermore, there is a scaled increase in cell number in most body structures, including the neocortex in p27Kip1 “knockout” mice (16–18). Finally, our own investigations establish that p27Kip1 mRNA levels in the PVE rise sharply with increases in Q and TG1 in the 11-cell-cycle sequence (19). Spatial control of transgene expression is accomplished in our transgenic mice with the use of a nestin intron II enhancer/promoter: the reverse tetracycline regulatable transactivator protein (rtTA)-IRES-βgeo transgene (PnestinrtTA), which restricts rtTA expression to the proliferative populations of the developing and mature CNS (20, 21). Temporal control is accomplished by using a p27Kip1:rtTA-dependent promoter transgene (tetOp27Kip1), which is regulatable with dox (22, 23).
Materials and Methods
Transgene Construction, Transgenic Mice, and Genotyping.
IRES-βgeo was removed from pPGT.1.8IRES-βgeo (a gift from Austin Smith, University of Edinburgh, Scotland) and inserted into the SmaI–SalI site of pBSII KS(+) (Stratagene) to generate the PnestinrtTA transgene. rtTA was removed from pUHD17–1 (a gift from Hermann Bujard, University of Heidelberg, Heidelberg, Germany) and inserted into a blunt-ended SpeI site pBSII KS(+)/IRES-β-geo. A NotI linker was inserted into the BglII site of plasmid gIITK (a gift from Richard Josephson, National Institutes of Health, Bethesda, MD) to facilitate removal of the rat nestin intron II and thymidine kinase minimal promoter. The NotI fragment was then inserted into a NotI site of pBSII KS(+)/rtTA-IRES-βgeo. To generate the tetOp27Kip1 transgene, PCR was performed to amplify the full-length p27Kip1 gene (the template was a gift from Andrew Koff, Memorial Sloan Kettering Cancer Center, New York), which was flanked by MluI and NheI restriction endonuclease sites. The amplicon was digested with MluI and NheI and cloned into pBi-EGFP (CLONTECH). pBSII KS(+)/rtTA-IRES-βgeo and pBi-EGFP/p27Kip1 plasmids were digested by the endonucleases DraI and PacI (New England BioLabs), respectively, and the resulting fragments were separately injected into FVB/N mouse zygotes. In each case, the injected embryos were implanted in the oviducts of day 1 pseudopregnant foster females. Transgenic mice were identified by Southern blot analysis and PCR with the use of tail genomic DNA. Routine genotyping of transgenic pups and embryos was done by PCR. TA51 (5′-AGAGCTGCTTAATG-AGGTCG-3′) and TA31 (5′-GTCCAGATCGAAATCGTCTAG-3′) primers were used to amplify a 829-bp fragment from the rtTA transgene. EG52 (5′-CTGAAGTTCATCTGCACCAC-3′) and EG31 (5′-GTAGTTGTACTCCAGCTTGTG-3′) primers were used to amplify a 305-bp fragment from the tetOp27Kip1 transgene. PnestinrtTA/−; tetOp27Kip1/− double transgenic (DT) mice were obtained by cross-breeding hemizygous PnestinrtTA/− females with hemizygous tetOp27Kip1/− males. Conception was ascertained from the presence of a vaginal plug. Mice were housed in a facility with a 12-h light-dark schedule.
5-Bromo-4-Chloro-3-indolyl-β-d-Galactopyranoside (X-Gal) Histochemistry to Verify rtTA Expression.
Embryonic day 12 (E12) mice were immersion fixed in 2% paraformaldehyde, 0.2% glutaraldehyde, 0.1 M NaHPO4 (pH 7.3) for 1 h at 4°C. After three washes in 0.01% sodium deoxycholate, 0.02% Nonidet P-40, 2 mM MgCl2, 0.1 M NaHPO4 (pH 7.3), X-gal staining was performed for 12–16 h at 37°C in X-gal buffer [2 mM MgCl2/5 mM K3Fe(CN)6/5 mM K4Fe(CN)6/0.1 mM NaHPO4, pH 7.3/0.01% sodium deoxycholate/0.02% Nonidet P-40) containing 1 mg/ml of X-gal (Fisher Scientific). In additional experiments, brains from E14 PnestinrtTA/− mice were embedded in 5% agarose (type VII; Sigma) and sectioned on a Vibratome (TPI, O'Fallon, MO) at 200-μm thickness in the coronal plane. Sections were immersed in X-gal buffer (8 mg/ml) and washed in PBS at 4°C.
Dox Administration.
Dox hydrochloride (Sigma) was dissolved in PBS at a concentration of 1–10 mg/ml (pH 7.2). The solution (0.1 ml) was administered orally to pregnant mothers twice a day for 1–3 days with a feeding needle (Fisher Scientific).
Western Blot Analysis.
E12 or E13 mouse forebrains were snap-frozen in liquid nitrogen and homogenized in 10 vol of cold lysis buffer (100 mM Tris, pH 8.0/2 mM EDTA/20 mM β-mercaptoethanol/1% SDS/1 mM sodium fluoride/2 μg/ml−1 aprotinin/1 μg/ml−1 leupeptin/1 μg/ml−1 pepstatin/50 μg/ml−1 PMSF). Separated protein was transferred to supported nitrocellulose membrane (Bio-Rad) and incubated with mouse monoclonal p27Kip1 antibody (Santa Cruz Biotechnology) in PBS containing Tween-20 (PBST) with 5% nonfat dry milk at 1:300 overnight at 4°C. Band intensities of p27Kip1 were quantified by iplab spectrum imaging software (Scanalytics, Billerica, MA). In each experiment, the signal intensity was standardized by comparison with the intensity of α-tubulin.
Competitive Reverse Transcription–PCR.
A 173-bp deletion was introduced into the p27Kip1 cDNA by digestion of pBi-EGFP/p27Kip1 with Tsp509I to prepare a p27Kip1 internal standard/competitor cRNA. The truncated cDNA was inserted into the KpnI–XbaI site of pBSII KS(+). The resulting construct was linearized by XbaI digestion, and cRNA was generated with the use of T3 RNA polymerase (Promega). Total RNA from E13 forebrain was purified with an RNeasy kit (Qiagen, Chatsworth, CA), and mRNA was separated from total RNA with an Oligotex mRNA kit (Qiagen). Five serial dilutions of cRNA were made and mixed in 20 ng of mRNA. The first-strand cDNA was reverse-transcribed by random hexanucleotide primers (Life Technologies, Rockville, MD) and Omniscript reverse transcriptase (Qiagen) for 1 h at 37°C. P52 (5′-GTCAAACGTGAGA-GTGTCTA-3′) and MCS-1 (5′-CAGTCTAGAGATATCGTCGAG-3′) primers were used to amplify a 640-bp fragment for the transgenic p27Kip1 and a 467-bp fragment for the deleted p27Kip1 as an internal standard. Band intensities of p27Kip1 and internal standard were analyzed with the use of iplab spectrum, and the ratios of sample to internal standard were measured and plotted against the concentration of the internal standard on a log/log scale. The ratio log 0 obtained from the regression line corresponds to the concentration of mRNA in the sample.
Terminal Deoxynucleotidyl Transferase-Mediated dUTP-Biotin Nick-End Labeling Analysis.
Four-micrometer-thick paraffin sections of the forebrain were processed with an ApopTag kit (Intergen, Purchase, NY) according to the manufacturer's instructions. The sections were stained with cresyl violet.
BrdUrd Immunohistochemistry and Labeling Analysis.
BrdUrd (Sigma) was injected into pregnant mice (50 μg/g body weight, i.p.) Two hours later, dams were anesthetized, and embryos were removed by hysterotomy; the heads were immersed in 70% ethanol and processed for paraffin-wax histology. Four-micrometer-thick coronal sections through the forebrain were processed for BrdUrd immunohistochemistry as described (24). The BrdUrd labeling index (LI) (ratio of the number of BrdUrd-labeled cells to the total number of cells) was calculated separately for the medial cortical zone (MCZ) and lateral cortical zone (LCZ) within a 1 × 104 μm2 area of the PVE that was defined with the use of a microscope ocular grid (12, 24). In other experiments, the 1 × 104 μm2 area was subdivided into 10 “bins.” Each bin area was measured to be 10 × 100 μm2, and the BrdUrd LI was calculated separately for each bin. LI was calculated in each experiment in a series of 7–8 brains obtained from 2–3 litters.
Results
Targeting Dox-Inducible Transgene Expression to the CNS Neuroepithelium.
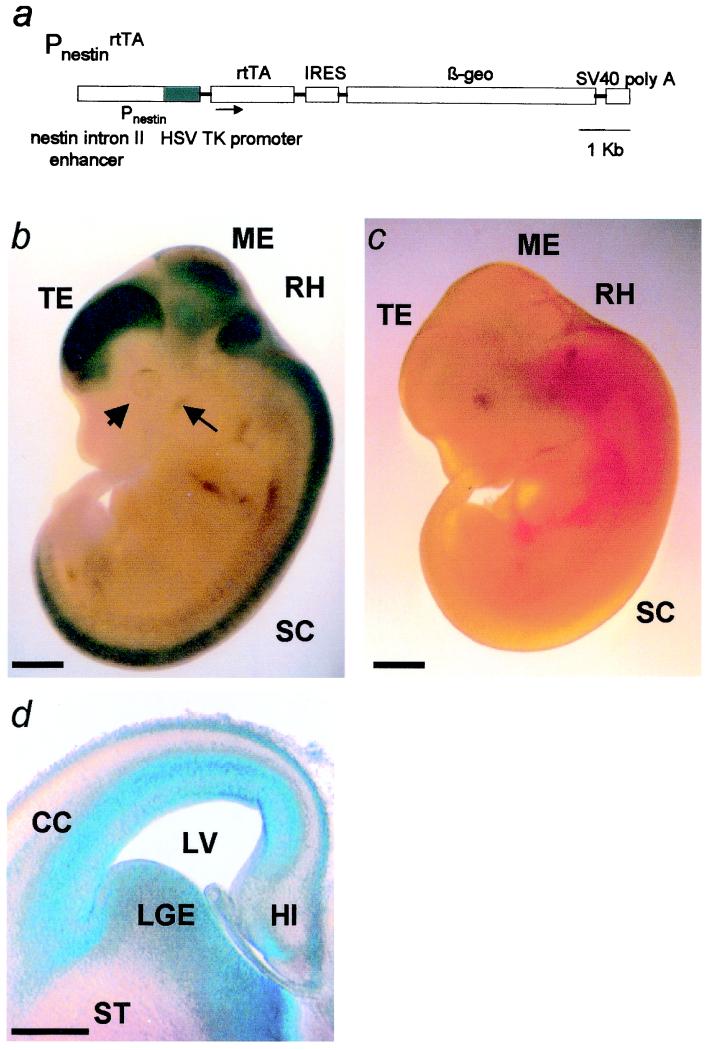
rtTA expression was verified in PnestinrtTA/− E12 mice by examining the pattern of expression of the IRES-linked βgeo reporter gene with the use of X-gal histochemistry. X-gal staining was uniform and intense in the telencephalon, mesencephalon, rhombencephalon, spinal cord, retina, and trigeminal ganglion (Fig. 1b) but was not detectable in skeletal muscle or the viscera. X-gal staining in histological sections was localized to the neuroepithelium (Fig. 1d). X-gal staining was not observed in nontransgenic embryos (Fig. 1c).
Figure 1.
Targeting regulated transgene expression to the neuroepithelium. (a) Targeting vector used to generate PnestinrtTA/− mice. (b) Whole-mount X-gal staining is restricted to the CNS in an E12 PnestinrtTA/− mouse. TE, telencephalon; ME, mesencephalon; RH, rhombencephalon; SC, spinal cord; arrowhead, retinal primordium; and arrow, trigeminal ganglion. (c) No labeling was seen in a WT littermate. (d) The neuroepithelia of the cerebral cortex (CC), lateral ganglionic eminence (LGE), and hippocampus (HI) in a histological section. LV, lateral ventricle, ST, striatum. (Scale bars: a and b = 1 mm; c = 500 μm.)
Dox Dosage and Administration for Optimal in Vivo Transgene Expression.
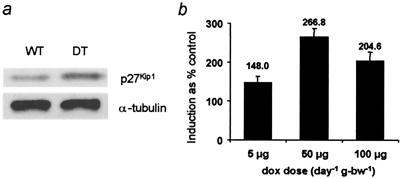
tetOp27Kip1/− mice were generated and crossed with PnestinrtTA/− mice to obtain DT embryos. Pregnant dams were administered dox by oral gavage for 2 days [10 μg/day−1 per g body weight (bw)−1], beginning on E11. Total p27Kip1 protein was assayed by Western blot analysis with the use of lysates from E13 forebrains. A 2-fold increase in p27Kip1 protein was detected in the forebrains of DT embryos compared with wild-type (WT) embryos exposed to the same dosage of dox (Fig. 2). In contrast, when DT embryos were exposed to PBS, the total p27Kip1 protein level was not increased compared with WT controls.
Figure 2.
Dose-dependent overexpression of p27Kip1 protein. (a) Western blot analysis of total p27Kip1 protein levels in the forebrains of dox-exposed WT and DT E13 embryos. α-Tubulin levels were determined and used to verify equal loading of samples. (b) Dox dose-dependent induction of p27Kip1 protein. Bars indicate percentage signal intensity. Protein levels in the WT embryos exposed to dox were considered to be 100%.
We determined the dosage of dox required for maximal transgene induction in the forebrains of DT embryos. When dox was increased to 50 μg/day−1 per g bw−1, the level of total p27Kip1 protein increased 2.5-fold compared with that seen at 5 μg/day−1 per g bw−1 (Fig. 2b). A dosage of 100 μg/day−1 per g bw−1 resulted in only a 2-fold increase in the level of total p27Kip1 (Fig. 2b), and often a selective resorption of DT embryos. The embryonic lethality is likely due to strong transgene activation and not to toxicity associated with the relatively high dox dose used. In support of this hypothesis, resorption affected only the DT embryos, even though the 100 μg/day−1 per g bw−1 dox-exposed litters also contained non-DT embryos (i.e., PnestinrtTA/−, tetOp27Kip1/−, and WT), and resorption was not encountered in DT embryos within a dosage range of 5–50 μg/day−1 per g bw−1. We did not establish the mechanism by which strong transgene activation caused the resorption of embryos and, in particular, did not determine whether lethality was due to an unrecognized primary effect or a less direct secondary effect of p27Kip1 overexpression.
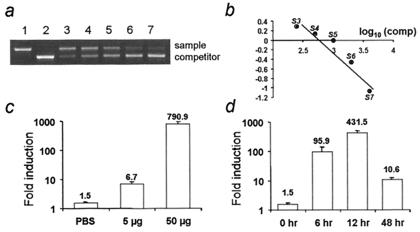
The p27Kip1 antibody does not distinguish between endogenous and transgene-derived proteins. Therefore, we performed competitive reverse transcription–PCR with transgene-specific primers to quantify dox-induced transgene-derived transcripts in the embryonic forebrain (Fig. 3 a and b). After 24 h of dox administration (5 μg/day−1 per g bw−1) beginning on E12, there was a 5-fold increase in transgene-derived transcript expression in DT embryos exposed to dox compared with DT embryos exposed to PBS (Fig. 3c). The low level of transgene-derived transcript detected in PBS-exposed DT embryos provides an estimate of the level of “leakage” of the inducible system (Fig. 3c). When the dox dose was increased to 50 μg/day−1 per g bw−1, transgene expression rose more than 500-fold over the level observed in DT embryos exposed to PBS (Fig. 3c). Therefore, transgene induction is dose-dependent within the dosage range used. We have not compared the level of transgene expression with that of the native gene for p27Kip1.
Figure 3.
Competitive reverse transcription–PCR of transgene-derived p27Kip1 mRNA in the forebrains of dox-exposed E12 and E13 DT embryos. (a) Lane 1, competitor cRNA alone; lane 2, E12 forebrain mRNA (sample) alone; lanes 3–7, sample mRNA containing 2-fold serial increments of competitor cRNA. (b) The logarithm of the ratios of sample to competitor (vertical axis) was plotted against the logarithm of the amounts of competitor (horizontal axis). A ratio of 0 represents the concentration of transgene-specific p27Kip1 mRNA in the sample. (c) Dose-dependent increase in transgene-specific mRNA after 24 h of dox exposure, beginning on E12. (d) Regulatablity of transgene-specific transcript induction after a 25 μg/g bw−1 dose of dox on E12. Each bar represents mean values from two independent experiments.
We next examined the regulatability of transgene induction in response to a single administration of dox at 25 μg/day−1 per g bw−1. A 60-fold increase in transgene-specific transcripts compared with basal levels was detected in the DT embryonic forebrain at 6 h (Fig. 3d). The expression level reached 300-fold by 12 h, but then returned to a level 7-fold higher than the basal level by 48 h (Fig. 3d). Thus, transgene expression is rapidly induced by dox and shut down reliably when dox is withdrawn.
p27Kip1 Overexpression and Cell Cycle Progression in the Neocortical PVE.
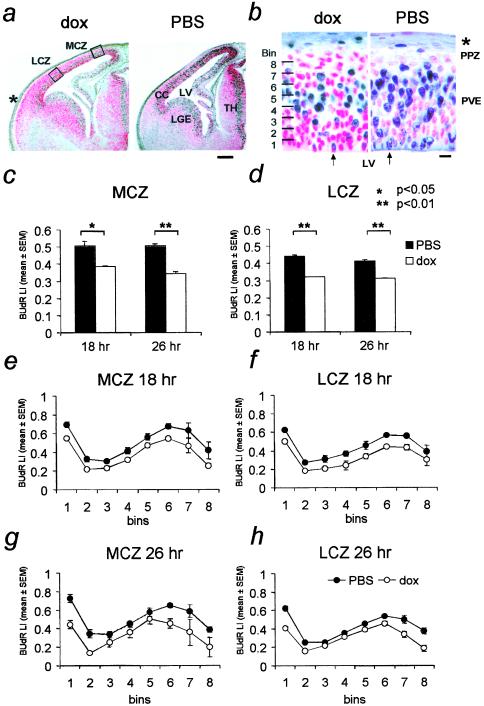
We exposed control and DT embryos to BrdUrd for 2 h after 16 and 24 h of dox exposure in utero. BrdUrd LI was analyzed in the PVE of the MCZ and the LCZ (Fig. 4 a and b). The progenitors in the PVE of the LCZ are encountering cell cycle number 8 of the 11-cell-cycle neurogenetic sequence on E13, whereas those in the PVE of the MCZ are encountering cell cycle number 6 (12). Thus LCZ is developmentally “in advance” of the MCZ with respect to the neurogenetic schedule.
Figure 4.
Analysis of BrdUrd LI in the neocortical PVE of E13 embryos. (a) BrdUrd in E13 forebrains. BrdUrd-labeled nuclei are black and non-BrdUrd-labeled nuclei are red. BrdUrd LI was analyzed at the MCZ and the LCZ. (b) High-power view of the MCZ shown in a, to illustrate the reduction in BrdUrd labeling in dox-exposed forebrain. Arrows show BrdUrd-labeled mitotic Fig. 2 h BrdUrd LI in the MCZ (c) and the LCZ (d) after 18 h or 26 h of dox exposure. The reduction in BrdUrd LI occurred throughout the PVE, in each of the 10 bins at 18 h (e and f) and 26 h (g and h). *, P < 0.05; **, P < 0.01. LV, lateral ventricle; LGE, lateral ganglionic eminence; TH, thalamus; CC, cerebral cortex; PPZ, primordial plexiform zone; PVE, pseudostratified ventricular epithelium. * in a and b indicates skull and skin. (Scale bar: a = 200 μm; b = 10 μm.)
Virtually all of the mitotic figures were BrdUrd-labeled in the LCZ and MCZ in DT embryos exposed to dox or PBS for 18 and 26 h, indicating that the combined lengths of the G2 and M phases of the cell cycle were unchanged by exposure to dox and that they were not longer than 2 h.
The 2-h BrdUrd LI in DT embryos exposed to dox for 18 h was reduced by 24.0% in the MCZ and 27.3% in the LCZ (Fig. 4 c and d). In the DT embryos exposed to dox for 26 h, the 2-h BrdUrd LI in the MCZ decreased by 32% (Fig. 4c). The reduction in the BrdUrd LI in the LCZ at 26 h was 26.8%, virtually the same as the reduction at 18 h (Fig. 4d). When the LIs at 18 and 26 h were analyzed in the MCZ and LCZ at 10-μm intervals, the reduction in LI occurred uniformly throughout the PVE (Fig. 4 e–h).
Over the full 26 h, the total number of cells in the PVE within the 1 × 104 μm2 sector and the height of the PVE remained essentially constant and indistinguishable between dox-exposed and PBS-exposed embryos (MCZ: dox, 179.1 ± 6.2 cells, PBS, 163.0 ± 0.1, P = 0.079; LCZ: dox, 177.6 ± 2.8, PBS, 171.5 ± 6.5, P = 0.177). Thus, by this criterion overexpression of p27Kip1 over the 26-h interval had no effect on the rate of cell exit from the proliferative cycle and from the ventricular zone.
p27Kip1 Overexpression Does Not Cause Apoptosis in the Neocortical PVE and Postmitotic Marginal Zone.
We also examined the PVE and postmitotic marginal zone of DT embryos exposed to dox for increased apoptosis. The analysis was performed separately for the MCZ and the LCZ. There was no statistically significant difference in the number of apoptotic cells between DT embryos and WT littermates exposed to dox (∼4 × 10⁻⁵ cells per μm2). These findings indicate that p27Kip1 overexpression did not cause apoptosis in the PVE or in the postmitotic region of the neocortex.
Discussion
We describe a transgenic mouse model in which the CNS neuroepithelium is targeted selectively to modulate cell cycle progression over a specified number of cycles. Our principal conclusion is that p27Kip1 overexpression over an interval of less than two cell cycles in the neocortical neuroepithelium is associated with prolongation of TG1 without alteration of Q. The extent of TG1 prolongation depends on the developmental stage of the PVE at the time of transgene expression. Regardless of the developmental stage, TG1 does not appear to exceed a putative physiological maximum.
The reduction in the 2-h BrdUrd LI after transgene induction (Fig. 4) indicates a lengthening of TC and/or an increase in Q, the two parameters whose coordinate regulation determines the pace of neurogenesis and the events of cell class specification. All cells in S, G2, and M phases are labeled by the 2-h exposure to BrdUrd. The unlabeled nuclei either are in the G1 phase or belong to cells of the Q fraction. Therefore, the reduction in the 2-h BrdUrd LI (Fig. 4) indicates (i) an increase in TG1 and/or a decrease in TS relative to TC and/or (2) an increase in Q. We suggest that the reduction is due to an increase in TG1.
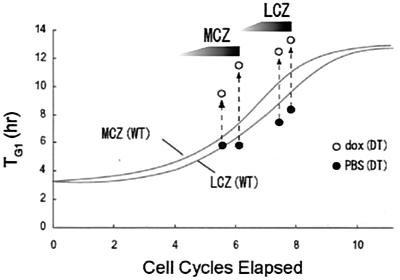
Overexpression of p27Kip1 promotes cell cycle exit in vitro (25–27). The duration of p27Kip1 overexpression in the present 26-h dox exposure experiments is unlikely to be sufficient for an effect upon Q. Substantial augmentation of p27Kip1 expression is attained after ≈12 h of dox exposure (Fig. 3d). As shown in Fig. 5, this level of expression may affect PVE cells for no more than a single cell cycle on E13. The pattern of TIS21 mRNA expression suggests that the “Q choice” is made in the G1 phase of the terminal cycle—the cycle before the final mitosis (28). Thus the effect on Q attributable to p27Kip1 overexpression should not be felt in terms of cell exit from the ventricular zone within the 26-h time frame of the present analyses. This assumption is supported by the observation that there was no reduction in the height of the PVE or the number of cells in the 1 × 104 μm2 sector of the PVE. A significant change in Q should have been reflected in these parameters because Q cells exit the PVE in an interval less than TC − TS (11).
Figure 5.
A schematic illustration of the effects of p27Kip1 transgene expression on TG1 in the neocortical PVE. TG1 (ordinate) in LCZ and MCZ of dox-exposed (○) and PBS-exposed (●) E13 embryos is plotted against elapsed cell cycle numbers of the 11-cell-cycle neocortical neuronogenetic interval (abscissa). The continuous traces (Upper, MCZ; Lower, LCZ) correspond to TG1 progression in WT mice (12). The broken upward arrows represent the apparent augmentation of TG1. The 18-h and 26-h time points correspond to late cell cycle number 6 and early cell cycle number 7, respectively, for the MCZ and to successively later stages of cell cycle number 8 for the LCZ. The graded shading in the wedges represents the relative advance of p27Kip1 overexpression with respect to the state of the cell cycle.
Because all of the mitotic figures are labeled with BrdUrd by 2 h in DT and WT mice, transgene expression does not alter the G2 + M phase length. We did not measure the S-phase duration directly in the present study. However, because the p27Kip1-induced reduction in BrdUrd LI was uniformly scaled through the full width of the ventricular zone (Fig. 4), that is with respect to cells in the S, G2, and M phases, the duration of the S phase is unlikely to have altered with respect to the duration of the G2 and M phases. Moreover, the action of p27Kip1 is at the G1–S phase transition in vertebrate cells, where it regulates the termination of the G1 phase but without an effect on the S phase (25–27). Finally, in WT mice, S-phase duration is virtually constant throughout the entire 11-cell-cycle sequence of the mouse neocortical neuronogenetic interval in vivo (4), even as p27Kip1 expression varies greatly (19). Therefore, we conclude that an increase in TC, caused by transgene expression, occurred because of a selective increase in TG1.
Assuming that the reduction in BrdUrd LI is exclusively due to a lengthening of TG1, the magnitude of the TG1 increase that would be necessary to cause the LI reduction can be calculated. TG1 would have to increase to 9.5 h in the 18-h dox administration experiment and to 11.5 h in the 26-h experiment to account for the observed reductions in the BrdUrd LI in MCZ (Fig. 5). For the LCZ, the prolongation would need to be about 13 h (12.5 and 13.3 h) in both the 18-h and 26-h experiments (Fig. 5). This prolongation corresponds to a 97% in TG1 for the MCZ and to a 59% increase in TG1 for the LCZ at the 26-h interval (4, 12). The estimated maximum TG1, namely 13.3 h, also is the maximum TG1 attained in the course of neocortical neurogenesis in vivo (Fig. 5) (4, 11). It may imply that there are “ceiling effects” on the allowable abundance of p27Kip1 in the cell nucleus, where its interactions with the cyclinE-cdk2 complex act to trigger termination of the G1 phase and an advance to the S phase.
Additional evidence supports such a ceiling effect on intracellular levels of p27Kip1 protein. Although a 300-fold increase in p27Kip1 transgene-specific transcripts occurred in the DT forebrain (Fig. 3), the total p27Kip1 protein levels increased by only 2-fold (Fig. 2). It is possible that regulatory mechanisms at the level of translation (29) or protein stability (30) determine maximum allowable amounts of intracellular p27Kip1 protein.
Whereas a mechanism by which p27Kip1 overexpression might prolong TG1 is not established, we suggest that it reflects an alteration in the stoichiometry of the inhibitory effect of unbound p27Kip1 upon the kinase functions of the cyclinE-cdk2 complex required terminally in the G1 phase to drive cells into the S phase. The abundance of cyclin E is known to be transcriptionally regulated with each cell cycle (31, 32). Overexpression of p27Kip1 might prolong the time needed to synthesize cyclin E in amounts sufficient to exceed the rate-limiting threshold required for the G1/S phase transition.
Acknowledgments
This work was supported by U.S. Public Health Service Grants NS12005 (V.S.C.), NS32657 (P.G.B.), and NS35996 (S.A.R.). T.T. was supported in part by the Pharmacia Upjohn Fund for Growth and Development Research.
Abbreviations
- CNS
central nervous system
- X-gal
5-bromo-4-chloro-3-indolyl-β-d-galactopyranoside
- dox
doxycycline
- E
embryonic day
- WT
wild type
- bw
body weight
- DT
double transgenic
- LI
labeling index
- LCZ
lateral cortical zone
- MCZ
medial cortical zone
- PVE
pseudostratified ventricular epithelium
- rtTA
reverse tetracycline regulatable transactivator protein
- βgeo
lacZ-neomycin fusion gene
Footnotes
This paper was submitted directly (Track II) to the PNAS office.
References
- 1.Boulder C. Anat Rec. 1970;166:257–262. doi: 10.1002/ar.1091660214. [DOI] [PubMed] [Google Scholar]
- 2.His W. Abh Math Phys Cl Kgl Saechs Ges Wiss. 1889;15:313–372. [Google Scholar]
- 3.Sauer F C. J Comp Neurol. 1935;62:377–405. [Google Scholar]
- 4.Takahashi T, Nowakowski R S, Caviness V S., Jr J Neurosci. 1995;15:6046–6057. doi: 10.1523/JNEUROSCI.15-09-06046.1995. [DOI] [PMC free article] [PubMed] [Google Scholar]
- 5.Miyashita-Lin E M, Hevner R, Wassarman K M, Martinez S, Rubenstein J L. Science. 1999;285:906–909. doi: 10.1126/science.285.5429.906. [DOI] [PubMed] [Google Scholar]
- 6.Rakic P. Science. 1988;241:170–176. doi: 10.1126/science.3291116. [DOI] [PubMed] [Google Scholar]
- 7.Porteus M H, Bulfone A, Liu J-K, Puelles L, Lo L-C, Rubenstein J L R. J Neurosci. 1994;14:6370–6383. doi: 10.1523/JNEUROSCI.14-11-06370.1994. [DOI] [PMC free article] [PubMed] [Google Scholar]
- 8.Parnavelas J G, Barfield J A, Franke E, Luskin M B. Cereb Cortex. 1991;1:463–468. doi: 10.1093/cercor/1.6.463. [DOI] [PubMed] [Google Scholar]
- 9.Mione M C, Cavanagh J F R, Harris B, Parnavelas J G. J Neurosci. 1997;17:2018–2029. doi: 10.1523/JNEUROSCI.17-06-02018.1997. [DOI] [PMC free article] [PubMed] [Google Scholar]
- 10.Luskin M B, Parnavelas J G, Barfield J A. J Neurosci. 1993;13:1730–1750. doi: 10.1523/JNEUROSCI.13-04-01730.1993. [DOI] [PMC free article] [PubMed] [Google Scholar]
- 11.Takahashi T, Nowakowski R S, Caviness V S., Jr J Neurosci. 1996;16:6183–6196. doi: 10.1523/JNEUROSCI.16-19-06183.1996. [DOI] [PMC free article] [PubMed] [Google Scholar]
- 12.Miyama S, Takahashi T, Nowakowski R S, Caviness V S., Jr Cereb Cortex. 1997;7:678–689. doi: 10.1093/cercor/7.7.678. [DOI] [PubMed] [Google Scholar]
- 13.Durand B, Fero M L, Roberts J M, Raff M C. Curr Biol. 1998;8:431–440. doi: 10.1016/s0960-9822(98)70177-0. [DOI] [PubMed] [Google Scholar]
- 14.Tikoo R, Osterhout D J, Casaccia-Bonnefil P, Seth P, Koff A, Chao M V. J Neurobiol. 1998;36:431–440. [PubMed] [Google Scholar]
- 15.Chang F, Nurse P. Trends Genet. 1993;9:333–335. doi: 10.1016/0168-9525(93)90022-a. [DOI] [PubMed] [Google Scholar]
- 16.Kiyokawa H, Kineman R, Manova-Todorava K, Soares V, Hoffman E, Ono M, Khanam D, Hayday A, Frohman L, Koff A. Cell. 1996;85:721–732. doi: 10.1016/s0092-8674(00)81238-6. [DOI] [PubMed] [Google Scholar]
- 17.Nakayama K, Ishida N, Shirane M, Inomata A, Inoue T, Shishido N, Hori I, Loh D Y. Cell. 1996;85:707–720. doi: 10.1016/s0092-8674(00)81237-4. [DOI] [PubMed] [Google Scholar]
- 18.Fero M, Rivkin M, Tasch M, Porter P, Carow C, Firpo E, Polyak K, Tsai L-H, Broudy V, Perlmutter R, et al. Cell. 1996;85:733–744. doi: 10.1016/s0092-8674(00)81239-8. [DOI] [PubMed] [Google Scholar]
- 19.Delalle I, Takahashi T, Nowakowski R S, Tsai L H, Caviness V S., Jr Cereb Cortex. 1999;9:824–832. doi: 10.1093/cercor/9.8.824. [DOI] [PubMed] [Google Scholar]
- 20.Zimmerman L, Parr B, Lendahl U, Cunningham M, McKay R, Gavin B, Mann J, Vassileva G, McMahon A. Neuron. 1994;12:11–24. doi: 10.1016/0896-6273(94)90148-1. [DOI] [PubMed] [Google Scholar]
- 21.Aoki Y, Huang Z, Thomas S S, Bhide P G, Huang I, Moskowitz M A, Reeves S A. FASEB J. 2000;14:1965–1973. doi: 10.1096/fj.00-0105com. [DOI] [PubMed] [Google Scholar]
- 22.Shockett P E, Schatz D G. Proc Natl Acad Sci USA. 1996;93:5173–5176. doi: 10.1073/pnas.93.11.5173. [DOI] [PMC free article] [PubMed] [Google Scholar]
- 23.Shin M K, Levorse J M, Ingram R S, Tilghman S M. Nature (London) 1999;402:496–501. doi: 10.1038/990040. [DOI] [PubMed] [Google Scholar]
- 24.Takahashi T, Nowakowski R S, Caviness V S., Jr J Neurocytol. 1992;21:185–197. doi: 10.1007/BF01194977. [DOI] [PubMed] [Google Scholar]
- 25.Massagué J, Polyak K. Curr Opin Genet Dev. 1995;5:91–96. doi: 10.1016/s0959-437x(95)90059-4. [DOI] [PubMed] [Google Scholar]
- 26.LaBaer J, Garrett M, Stevenson L, Slingerland J, Sandhu C, Chou H, Harlow E. Genes Dev. 1996;11:847–862. doi: 10.1101/gad.11.7.847. [DOI] [PubMed] [Google Scholar]
- 27.Sherr C J, Roberts J M. Genes Dev. 1999;13:1501–1512. doi: 10.1101/gad.13.12.1501. [DOI] [PubMed] [Google Scholar]
- 28.Iacopetti P, Michelini M, Stuckmann I, Oback B, Aaku-Saraste E, Huttner W B. Proc Natl Acad Sci USA. 1999;96:4639–4644. doi: 10.1073/pnas.96.8.4639. [DOI] [PMC free article] [PubMed] [Google Scholar]
- 29.Hengst L, Reed S L. Science. 1996;271:1861–1864. doi: 10.1126/science.271.5257.1861. [DOI] [PubMed] [Google Scholar]
- 30.Pagano M, Tam S W, Theodoras A M, Beer-Romero P, Del Sal G, Chau V, Yew P R, Draetta G F, Rolfe M. Science. 1995;269:682–685. doi: 10.1126/science.7624798. [DOI] [PubMed] [Google Scholar]
- 31.Sherr C J. Cell. 1994;79:551–555. doi: 10.1016/0092-8674(94)90540-1. [DOI] [PubMed] [Google Scholar]
- 32.Knoblich J A, Sauer K, Jones L, Richardson H, Saint R, Lehner C F. Cell. 1994;77:107–120. doi: 10.1016/0092-8674(94)90239-9. [DOI] [PubMed] [Google Scholar]


