Abstract
Liver regeneration after partial hepatectomy (PHx) is orchestrated by multiple signals from cytokines and growth factors. We investigated whether increased energy demand on the remnant liver after PHx contributes to regenerative signals. Changes in the tissue’s energy state were determined from adenine nucleotide levels. ATP levels in remnant livers decreased markedly and rapidly (to 48% of control by 30 sec post-PHx) and remained significantly lower than those in sham-operated controls for 24–48h. The ATP decrease was not reflected in corresponding increases in ADP and AMP, resulting in a marked decline in total adenine nucleotides (TAN). We found no evidence of mitochondrial damage or uncoupling of oxidative phosphorylation. Multiple lines of evidence indicated that the decline in TAN was not caused by increased energy demand, but by ATP release from the liver. The extent of ATP loss was identical following 30% or 70% PHx, while fasting or hyperglycemia, conditions that greatly alter energy demand for gluconeogenesis, affected the ATP/ADP decline but not the loss of TAN. Presurgical treatment with the α-adrenergic antagonist phentolamine completely prevented loss of TAN, although changes in ATP/ADP were still apparent. Importantly, phentolamine treatment inhibited early signaling events associated with the priming stages of liver regeneration and suppressed the expression of c-fos. Pretreatment with the purinergic receptor antagonist suramin also partly suppressed early regenerative signals and c-fos expression, but without preventing TAN loss. We conclude that the rapid loss of adenine nucleotides after PHx generates early stress signals that contribute to the onset of liver regeneration.
INTRODUCTION
Liver regeneration occurs in response to hepatic injury to recover lost or defective tissue in a tightly controlled process directed by a variety of cytokines and growth factor signals that has only partly been elucidated1–3. After 70% partial hepatectomy (PHx#)4, proliferation of hepatocytes occurs almost synchronously throughout the tissue, while differentiated liver function is maintained to meet the demands of the organism. Liver regeneration after PHx, therefore, offers a unique model of the control of cell proliferation in a differentiated system.
An early stress signal after PHx may derive from the enhanced energy demand per unit liver mass. The remnant tissue maintains liver-specific functions, such as gluconeogenesis and ureagenesis, even while ATP is generated for the synthesis of proteins, nucleic acids and other cell constituents. A 15–30% decline in ATP levels in the regenerating rat liver was observed throughout the first 48 hrs following PHx5–8. Likewise, a 40–50% drop in liver ATP was observed 24 hours after PHx in rabbits9,10.
The remnant tissue relies on mitochondrial oxidative phosphorylation to meet energy demand. Surprisingly, defects indicative of a mitochondrial permeability transition were reported in mitochondria isolated from remnant livers after PHx11. Diehl and coworkers12 found increased expression of uncoupling protein UCP-2 in mouse livers 3–6 hrs after PHx, presumably as a defense against oxidative stress, which was postulated to be a signal to enhance regeneration. A decrease in respiratory coupling could contribute to declining ATP levels and impede the tissue’s capacity to supply energy for biosynthesis or functional maintenance.
Whether the increased energy demand per unit liver weight itself translates into stress signals that contribute to the onset of liver regeneration has not been investigated. Liver regeneration is delayed by intravenous glucose infusion5. These conditions would suppress gluconeogenesis and may provide an alternative ATP supply through glycolysis. Liver regeneration is defective in transgenic mice expressing mitochondrial creatine kinase in hepatocytes, an enzyme that buffers cellular ATP levels, although transfection with cytosolic creatine kinase had no such effect13. A decline in phosphorylation potential, or other parameters related to the cellular energy state may help signal the onset of reparative processes.
In the present study, we investigated the energy state of the remnant liver as reflected in adenine nucleotide levels with an emphasis on the earliest times (seconds to minutes) after PHx, to detect the immediate response of the tissue prior to the onset of adaptive coping mechanisms. This response phase has not been considered in any previous studies. A marked decline in ATP occurred almost immediately (within 15 seconds) after PHx, which was maintained throughout the prereplicative period. However, a closer investigation indicates that increased energy demand is not the major determinant of the ATP decline. Instead, a loss in total adenine nucleotides following PHx occurs in response to upstream stress signals. Importantly, conditions that prevented the loss of adenine nucleotides or that inhibited purinergic receptor activation suppressed regenerative signaling responses and expression of immediate-early gene expression associated with the priming phase. We conclude that the rapid changes in energy state of the liver after PHx contribute to early signaling events associated with the onset of liver regeneration.
EXPERIMENTAL PROCEDURES
Materials
Biochemicals and enzymes were purchased from Sigma (St. Louis, MO) or Roche (Indianapolis, IN). Antibodies were obtained from Cell Signaling Technology (Danvers, MA) and Upstate Biotechnology (Lake Placid, NY). All other reagents were analytical grade.
Animal Protocols
Male Sprague-Dawley rats (300–400g) were subjected to 70% (medial and left lateral lobes) or 30% (left lateral lobe only) PHx4 under isoflurane anesthesia and allowed to recover for various periods. For sham surgeries livers were externalized and gently palpated to mimic the surgical stress of the PHx procedure. For regeneration times of 15 min or less, animals were kept under anesthesia and external tissue layers were covered with gauze (up to 5 min) or loosely sutured (for 15 min). Survival rates for PHx and sham surgeries was 100%. The time of ligation of the liver lobes prior to excision was the zero time point for PHx. Livers were freeze-clamped within 4 sec of excision using aluminum clamps pre-cooled in liquid nitrogen14. Frozen tissue wafers (thickness < 0.5 mm, weight 2–3 g) were stored at −80°C. Parallel PHx and sham livers were processed for all time points, except very early times (< 1 min). Externalization and palpation of the liver for sham surgeries was used as the zero-time for sham surgeries. However, this does not provide a precise zero time point compatible with freeze-clamping within 15–30 sec similar to the PHx procedure. Liver samples from anesthetized animals freeze-clamped within 10 sec of opening the abdomen served as controls for 15–30 sec regenerating livers.
Tissue processing
For metabolite assays, freeze-clamped liver was processed by the method of Williamson et al.14. Liver samples (500–800 mg) were crushed and homogenized in 10 volumes of cold 20% (w/v) HClO4. Supernatants were neutralized with ice-cold KOH, centrifuged at 4°C (20 min, 24,000xg) to remove KClO4, and stored at −80°C for adenine nucleotide analysis. For other metabolite assays, neutralized extracts were treated with 60–80 mesh Florisil (0.1g/ml) and centrifuged (10 min, 7800×g, 4°C) to reduce nonspecific NADH oxidation14.
For protein analysis, freeze-clamped tissue was homogenized in lysis buffer containing 50 mM Hepes (pH 7.4), 150 mM NaCl, 5 mM EGTA, 10% glycerol, 1% Triton X-100, 150 mM NaF, 10 mM Na pyrophosphate, 1 mM Na ortho-vanadate, and Complete protease inhibitor cocktail (Roche Diagnostics, Basel, Switzerland).
Liver mitochondria were isolated by differential centrifugation suspended in 0.25M sucrose, 5mM HEPES, (pH 7.3) and incubated exactly as described previously15. State 3 and State 4 respiration rates were measured with glutamate (+ malate) or succinate (+ Amytal) as substrates.
Assays
Metabolites were assayed spectrophotometrically by enzymatic analysis16. Recoveries were 95–105 %. Blood glucose was measured with a MediSense Precision QID glucometer (Abbott Laboratories Inc., Bedford, MA). Signaling proteins were analyzed by Western blotting after separation by SDS-PAGE on 4–12% Bis-Tris NuPAGE gradient gels (Invitrogen).
Gene expression was measured by QRT-PCR. Total RNA was isolated using TRIzol reagent (Invitrogen, Carlsbad, CA) according to the manufacturer’s instructions. DNA templates were synthesized using SuperScript II reverse transcriptase and oligo(dT) primer (Invitrogen). QRT-PCR assays were done on an ABI Prism 7000 (Applied Biosystems, Foster City, CA) using 2X SYBR Green Master Mix (Applied Biosystems). Primer pairs were: c-fos: forward 5′-AACGGAGAATCCGAAGGGAA-3′; reverse 5′-GATTGGCAATCTCGGTCTGC-3′; glyceraldehyde-3-phosphate dehydrogenase: forward 5′-AGTTCAACGGCACAGTCAAG-3′; reverse 5′-GTGGTGAAGACGCCAGTAGA-3′.
Statistical Analysis
Significance of differences between PHx and sham was determined by two-tailed Student’s t test assuming equal sample variance.
RESULTS
Adenine nucleotide changes in the regenerating liver
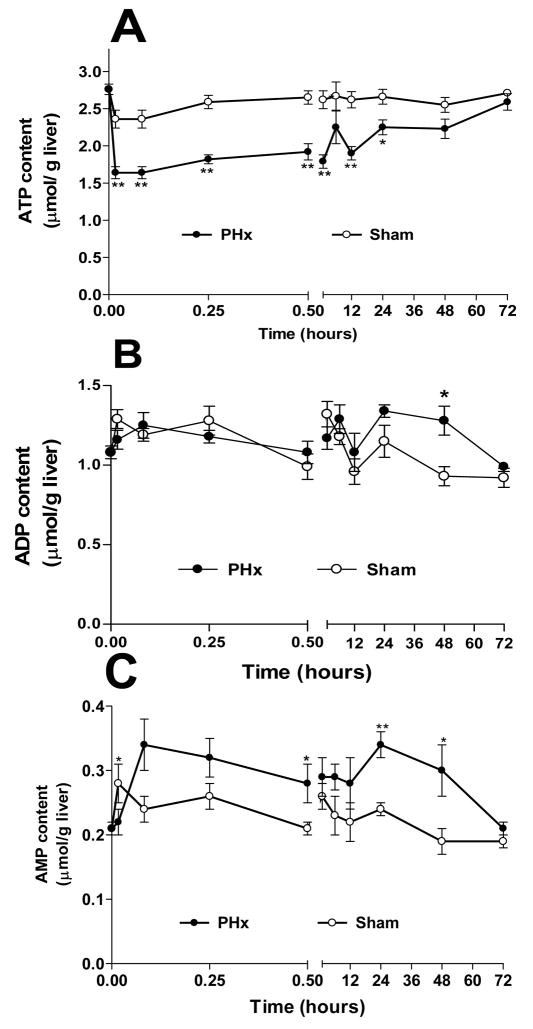
PHx brought about an instantaneous and marked decline in ATP levels in the remnant tissue. Analysis of the initial kinetics of changes in adenine nucleotide levels in freeze-clamped remnant livers revealed a 25% drop in ATP as early as 15 sec following PHx from the control level of 2.76 ± 0.07 μmol/gww (Fig. 1A, Supplementary Table S1§). ATP levels reached a low of 1.44 ± 0.12 μmol/gww by 30 sec, with partial recovery by 2 minutes to a new steady state of 1.8–2.0 μmol/gww. ATP remained low throughout the replicative phase and full recovery to control values was not seen until 72 hours after PHx.
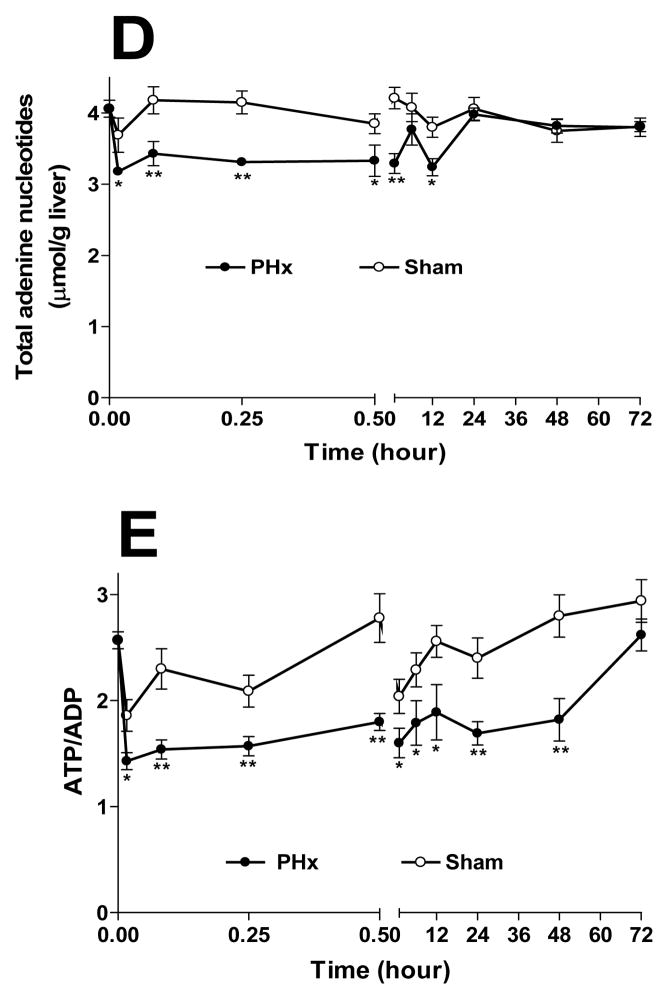
Fig 1. Adenine nucleotide changes in remnant livers following 70% PHx or Sham surgery.
Livers from PHx (-●-) or Sham (-○-) operated rats were freeze-clamped at designated post-operative times and processed for adenine nucleotide analysis. (A) ATP; (B) ADP; (C) AMP; (D) Total adenine nucleotides, TAN; (E) ATP/ADP. For estimates of statistical significance, PHx and Sham livers from 4–13 animals were compared for each time point (see supplemental Table S1); ** p<0.01, * p<0.05.
The decline in ATP was not associated with a corresponding increase in ADP and AMP. ADP levels generally did not change significantly following PHx (Fig. 1B). AMP rose by 70% over control levels to 0.35 ± 0.03 μmol/g ww by 15 sec and remained elevated for at least 48 hours (Fig. 1C). Consequently, the total adenine nucleotide (TAN) content in remnant livers fell in parallel with ATP (Fig. 1D). By 30 seconds TAN levels were at a minimum (27% below control) and did not recover to sham-operated levels until 3 hours after surgery (Table S1). We did not detect an accumulation of adenosine, inosine, or IMP (data not shown). As a result of these changes, the ATP/ADP ratio in the remnant liver, an indicator of the energy status of the liver, dropped immediately to 1.22 ± 0.09 from a control ratio of 2.57 ± 0.08 and remained low through 48h, recovering to control levels by 72h (Fig. 1E, Table S2). Importantly, the adenylate kinase mass action ratio, [ATP][AMP]/[ADP]2, remained unchanged (0.4–0.5) in the livers of all animals, PHx or sham-operated, throughout the 72 hour post- surgical period (Table S2), indicating that adenylate kinase near-equilibrium is maintained despite substantial changes in adenine nucleotides17.
Sham surgery affected adenine nucleotide levels only modestly and briefly (Fig. 1, Table S1). ATP content dropped slightly (9%) 1 min after sham surgery, while ADP and AMP rose by 25% and 33%, respectively, with no change in total adenine nucleotide levels. Meaningful earlier time points for sham surgery could not be obtained (see Methods). However, the absence of major differences in adenine nucleotide levels between the untreated control and 1 minute sham surgery samples demonstrates that the control tissue obtained from untreated animals is an appropriate basis for comparison for the early PHx time points. Adenine nucleotides of sham-operated livers had returned to control levels by two minutes after surgery and remained unchanged throughout the post-operative period.
Adenine nucleotide changes are not due to mitochondrial defects
Mitochondrial oxidative phosphorylation is the predominant ATP producing process in hepatocytes. Few data are available on mitochondrial function during the first 12 hours of regeneration. In order to assess whether persistent defects in mitochondrial function could contribute to the sustained changes in adenine nucleotide levels after PHx, we characterized the capacity for oxidative phosphorylation in mitochondria isolated from PHx and sham-operated rats 3, 6, and 12 h after surgery. No significant differences were observed between these preparations in State 3 and State 4 respiration rates, respiratory control ratio, P/O ratio, and membrane potential (ΔΨ), using either succinate or glutamate/malate as substrates ( Table S3). The data did not provide evidence of mitochondrial defects associated with a permeability transition or uncoupling of oxidative phosphorylation. We did not detect uncoupling protein expression in rat liver after PHx (not shown), as had been reported for mice12. Thus, these data demonstrate that the observed decline in cellular ATP levels is not due to a defect in mitochondrial respiratory capacity or coupling that is preserved during the mitochondrial isolation procedure.
An important indicator of the balance of energy supply and demand in vivo is the redox potential of the NADH-NAD+ couple in the cytoplasm and mitochondria14. The decline in ATP/ADP in the remnant liver would result in increased electron transport and a more oxidized state of mitochondrial and cytoplasmic NAD, unless compensated by changes in substrate supply¶. The redox state of the NADHfree−NAD+free couple in the cytosolic and mitochondrial compartments is reflected in the lactate/pyruvate (L/P) and β-hydroxybutyrate/acetoacetate (BHB/AcAc) ratios, respectively14.
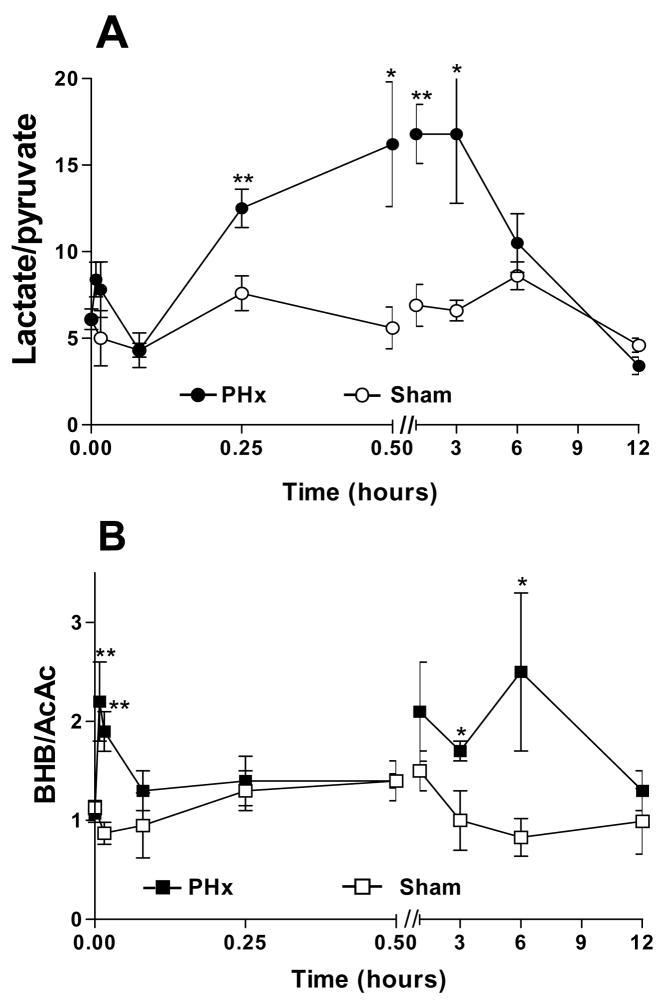
L/P ratios in regenerating livers rose 2–3 fold over those in sham animals by 15 min following PHx, reaching a plateau between 30 min and 3 hours before returning to sham levels by 6 hours (Fig. 2A). This increase arose from a >50 % drop in pyruvate (0.21 ± 0.03 to 0.096 ± 0.016 μmol/gww in control and 15 min after PHx, respectively), while lactate remained unchanged (1.3 ± 0.3 and 1.1 ± 0.1 μmol/gww in control and 15 min after PHx, respectively, Table S4). Thus, the change in the L/P ratio did not reflect a decreased capacity of the remnant liver to process lactate released from peripheral tissues, but is due to an increased cytosolic NADHfree/NAD+free. In sham-operated animals, the L/P ratio remained unchanged throughout 72 hrs.
Fig 2. Lactate/pyruvate ratios (L/P) and β-hydroxybutyrate/acetoacetate (BHB/AcAc) ratios in remnant livers following 70% PHx or Sham surgery.
Metabolite levels were analyzed in neutralized extracts from remnant livers of PHx and Sham operated rats. A) L/P ratios for PHx (-●-) and Sham (-○-); B) BHB/AcAc ratios for PHx (-■-) and Sham (-□-). For estimates of statistical significance, PHx and Sham livers from 3–7 animals were compared for each time point (see supplemental Table S4); ** p<0.01, * p<0.05.
The redox state of mitochondrial NADHfree−NAD+free, reflected in the BHB/AcAc ratio, rose transiently, with peaks at 30 sec and 6 hours, returning to sham levels by 12 h (Fig 2B). These changes were due almost entirely to increased BHB (Table S4). Since BHB is a terminal metabolite in a dead-end pathway (i.e., BHB is formed only from acetoacetate and is not further metabolized in liver), these changes in BHB/AcAc ratio likely reflect an increased mitochondrial NADHfree/NAD+free ratio. Thus, BHB/AcAc changes over the 24 h period following PHx showed no evidence of a more oxidized state of NAD in mitochondria, despite a significant and sustained decline in ATP/ADP. These findings suggest that any increased energy demand in the remnant liver is met effectively by mitochondrial substrate supply and oxidative phosphorylation.
Adenine nucleotide changes following 30% partial hepatectomy
Further experiments were designed to assess adenine nucleotides changes after PHx under conditions where the demand for energy was varied. Excision of a smaller (30%) fragment of the liver (PHx30) gives a much reduced proliferative response18 and a proportionally reduced metabolic demand on the remnant liver. Remarkably, changes in ATP content and total adenine nucleotide levels during the first 15 minutes after PHx30 were almost indistinguishable from those occurring after PHx70 (Table S5). Within 30 sec of PHx30 ATP dropped 40% from a control of 2.76 ± 0.07 μmol/gww, with a further decline at 1 min. By 5 min, the ATP contents following PHx30 and PHx70 were similar. In parallel with the drop in ATP after PHx30 an equally rapid decline in ATP/ADP occurred (Table S5). Indeed, over a 12 hour period, ATP/ADP changes following PHx30 and PHx70 were largely indistinguishable (Table S5). However, recovery of ATP/ADP to control levels occurred within 24 hours after PHx30, whereas 72 hours were required for recovery after PHx70 (compare Tables S1 and S5). Thus, although ATP content and ATP/ADP in the remnant tissue recovered more rapidly after PHx30 than after PHx70, the adenine nucleotide changes during the early post-operative period were not related to the mass of the remnant tissue.
Effects of circulating glucose on adenine nucleotide changes following PHx
A major contributor to the metabolic demand on the liver is the maintenance of blood glucose, which affects liver carbohydrate metabolism both directly (through the glucose transporter and glucokinase) and indirectly (through pancreatic and adrenergic hormones released in response to changes in circulating glucose). Hence, we imposed variations in circulating glucose levels as a means of varying the energy demand on the liver.
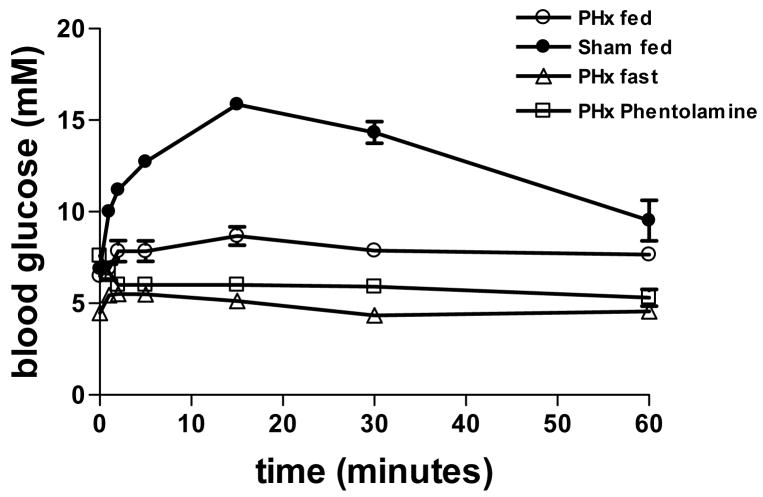
Blood glucose concentrations were measured during 1 h following PHx and sham surgery in fed rats (Fig. 3). Sham-operated animals showed a marked increase in blood glucose (6.4 ± 0.1 mM to >12 mM) within 5 minutes of liver palpation, presumably a glycogenolytic response to the isoflurane anesthesia and surgical stress mediated by α-adrenergic stimulation. After PHx, blood glucose also rose, but the increase was diminished by 2/3 compared to sham, peaking at 8.7 ± 0.5 mM 5 min after surgery. A similar blood glucose increase after PHx with simultaneous depletion of liver glycogen was reported by Paloheimo et al.19.
Fig 3. Blood glucose levels after 70% PHx and Sham surgery.
Fed PHx rats (-○-); 24 h fasted PHx (-△-) rats; fed Sham-operated rats (-●-); phentolamine treated (10 mg/kg, 30 min prior to surgery) PHx rats (-□-). Error bars indicate SEM for 3–5 animals for each condition. Where not shown, standard errors were less than the symbol size.
Thus, PHx did not generate an instantaneous demand for gluconeogenesis as reflected in blood glucose levels. Nevertheless, since blood glucose increased with a slower time course than the decline in tissue ATP, we investigated the impact of treatments that imposed a sustained hyperglycemia prior to PHx. Conversely, the hyperglycemic response to isoflurane anesthesia and surgical stress was avoided by 24 h fasting prior to surgery (which largely depletes liver glycogen), or by treatment with the α-adrenergic antagonist phentolamine, which inhibits the activation of glycogenolysis.
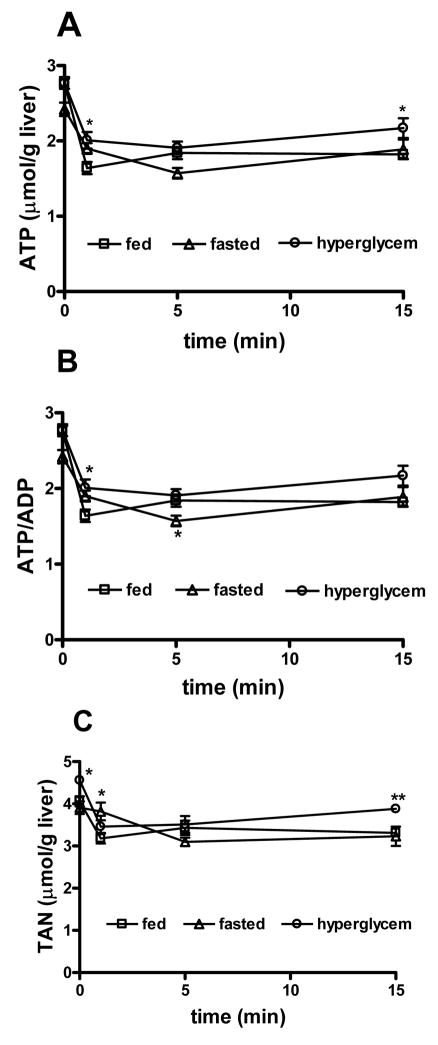
Hyperglycemia was achieved by extrusion and palpation of the liver, similar to the procedure used for sham surgery, eliciting a glucose surge within 5 min that is sustained for over 1 hour (Fig. 3). PHx was performed after maximal elevation of blood glucose had occurred and remnant livers were removed and freeze-clamped 1, 5 or 15 minutes later. Prior to PHx ATP content was unchanged from euglycemic rats but TAN were slightly elevated (Fig. 4C, Table S6). Following PHx, ATP and TAN had decreased by 1 minute and remained such for the subsequent 15 minutes, similar to the pattern observed in euglycemic animals, although the ATP change in hyperglycemic rats was slightly tempered (Fig. 4A, C). By contrast, hyperglycemia markedly suppressed the early change in ATP/ADP that was evident in euglycemic animals after PHx (Fig. 4B). When hyperglycemia was obtained by i.p. injection of glucose (385 mg/kg body weight), changes in ATP and TAN were very similar to those obtained by prior palpation of the liver (not shown). These experiments indicate that elevated blood glucose levels do not prevent the PHx-induced decline in total adenine nucleotides, but suppress the rapid changes in ATP/ADP in the remnant liver.
Conditions that prevent PHx-induced glycogenolysis: Hepatic glycogen stores are severely depleted in rats fasted for 24 hours and PHx did not induce an appreciable change in blood glucose from pre-surgical levels in these animals (Fig. 3). TAN levels were not significantly affected by 24 h fasting, but ATP was decreased by 12% and the ATP/ADP ratio was significantly lower compared to fed animals (Fig. 4A, B). PHx induced changes in ATP/ADP ratio in the remnant livers of fasted rats were similar to those observed after PHx in fed rats. A marked decline in TAN was also observed in fasted animals, but was slower in onset, reaching the characteristic lower steady state level only by 5 min after PHx (Fig. 4C).
Fig 4. Effect of circulating blood glucose on adenine nucleotide changes after PHx.
(A) ATP content, (B) ATP/ADP, (C) total adenine nucleotide content, 0–15 min following 70% PHx, under euglycemic, hypoglycemic and hyperglycemic conditions. Data obtained from 3–5 rats per treatment for each time point. ** p<0.01, * p<0.05, comparing PHx and Sham-operated animals.
More distinct effects were evident in fed animals pretreated for 30 min with the α-adrenergic antagonist phentolamine (10 mg/kg). Phentolamine pretreatment completely suppressed the rise in blood glucose in partially hepatectomized animals and blood glucose was maintained at 6.3 mM or below for at least 1 hour following surgery (Fig 3).
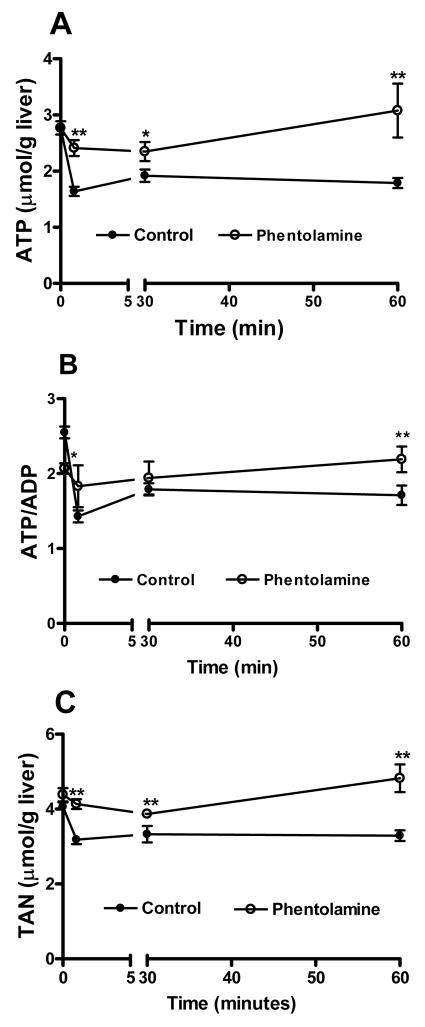
Unexpectedly, phentolamine treatment had a marked effect on the changes in adenine nucleotides following PHx. The ATP content at 1 and 30 min after PHx was only slightly depressed in livers of phentolamine-treated rats and returned to the pre-surgical level by 60 min (Fig. 5A, Table S7). The pronounced drop in total liver adenine nucleotide content after PHx was completely prevented by phentolamine treatment (Fig. 5C). Indeed, by 60 minutes total adenine nucleotides exceeded pre-surgical levels (4.82 ± 0.37 μmol/gww). However, a post–surgical decrease in ATP/ADP ratio still occurred, due to substantial increases in ADP (Fig. 5B, Table S7). Thus, although phentolamine treatment prevented the PHx-induced surge in blood glucose and the changes in ATP/ADP were compatible with increased energy demand, the α-adrenergic blockade also interfered with the PHx-associated decline in TAN. These findings demonstrate unequivocally that the loss of TAN immediately following PHx is distinct from the increased energy demand on the remnant liver.
Fig 5. Effect of phentolamine treatment on adenine nucleotide changes after PHx.
(A) ATP content, (B) ATP/ADP ratio, (C) total adenine nucleotide content, 0–15 min following 70% PHx in phentolamine treated rats (10 mg/kg, 30 min prior to surgery). Data represent 3–5 rats per treatment for each time point. ** p<0.01, * p<0.05, comparing phentolamine-treated and control animals.
Role of ATP release in early signaling responses initiating regeneration
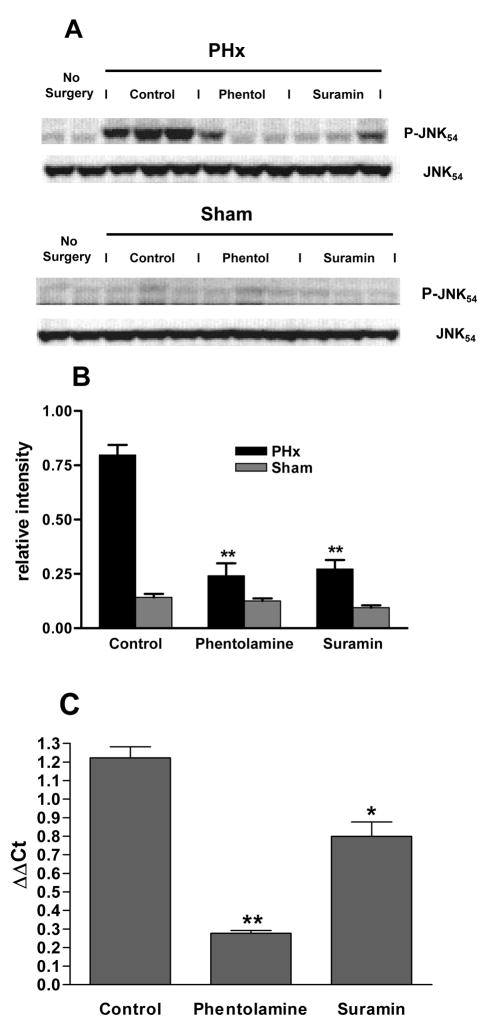
If phentolamine treatment prevents the PHx-induced ATP loss it can serve as a tool to explore the role of ATP release in the early signaling events associated with onset of liver regeneration. Previous studies20 had demonstrated that treatment with α1-adrenergic antagonists inhibits cell cycle progression and DNA replication in vivo. The experiment of Fig. 6 shows that the α-adrenergic antagonist phentolamine also inhibits characteristic early signaling responses associated with the priming phase of liver regeneration. Jun N-terminal kinase (JNK) phosphorylation, which occurs within 15–30 min of PHx, is a critical step in priming of the liver for regeneration and is one of the early cell signaling events contributing to the activation of immediate-early gene expression. Phosphorylation of JNK was almost completely inhibited by pretreatment of the animal with phentolamine (Fig. 6A, B). In addition, phosphorylation of c-Jun protein at S63, a critical serine residue that is a target for JNK, was inhibited by phentolamine (data not shown). Expression of the immediate-early gene c-fos, which normally peaks within 15–30 min after PHx, was also suppressed by phentolamine (Fig. 6C). We further tested whether ATP release contributes to these early signaling events by activation of purinergic receptors. Pretreatment of the animals with the purinergic antagonist suramin (100 mg/kg body wt) did not prevent the PHx-induced loss of ATP (ATP 2.02 ± 0.06 μmol/gww, TAN 3.62 ± 0.20 μmol/gww 1 min after PHx in suramin-treated animals (n=3), not significantly different from untreated PHx animals), but inhibited JNK phosphorylation (Fig. 6A, B) and partly suppressed the c-fos expression at 30 min after PHx (Fig. 6C).
Fig 6. Effect of phentolamine and suramin treatment on JNK phosphorylation and c-fos expression in remnant livers after PHx.
(A) Western blots of phospho-JNK(p54) and JNK(p54) protein levels in liver extracts from untreated animals that did not undergo surgery (lanes 1–2) and control (lanes 3–5), phentolamine-treated (lanes 6–8), or suramin-treated (lanes 9–11) animals subjected to PHx (upper blots) or Sham (lower blots) surgery. Inhibitors were injected ip 30 min prior to surgery and tissues were harvested 30 min after surgery. Control animals received a corresponding volume of saline. (B) Effect of phentolamine or suramin treatment on JNK phosphorylation following PHx or Sham surgery. Densities obtained from Western blots shown in (A) for phospho-JNK were normalized to total JNK protein in each sample,. ** p<0.01. (C) Effect of phentolamine or suramin treatment on c-fos relative to GAPDH mRNA by quantitative RT-PCR, expressed as ΔΔCt on a 2log scale comparing samples from PHx and Sham surgeries. Samples were obtained 30 min after PHx or Sham surgery using 3 animals for each condition; ** p<0.01, * p<0.05.
DISCUSSION
One of the most striking findings revealed here is how rapidly metabolic parameters change in the remnant liver following PHx. The ATP content of the remnant liver declined by 25% within 15 sec after PHx and by 30 sec had dropped to 50% below control levels (Fig. 1). Following a partial recovery, steady state ATP levels remained 20–30% below sham-operated animals through most of the regenerative period. Increases in ADP and AMP did not account for the drop in ATP, and total adenine nucleotides declined in parallel. A decrease in the ATP/ADP ratio is a predicted response to increased energy demand, but the rapid onset of this change is unexpected and suggests a sensing mechanism that immediately transmits information on the loss of functional liver mass to the remnant tissue. Other possible explanations for a drop in ATP/ADP, such as partial uncoupling, limited substrate supply, or inhibition of mitochondrial electron transport are not compatible with our data (Fig 2, Tables S3 and S4). Respiratory capacity and coupling of oxidative phosphorylation by isolated mitochondria were not affected for at least 12 hrs after PHx and there was no evidence of a shift towards a more oxidized state of mitochondrial or cytosolic NAD in the remnant liver. An early, transient increase in the BHB/AcAc ratio and a later, more sustained increase in the L/P ratio may indicate activation of the supply of metabolic substrates. Liver regeneration is known to mobilize fatty acids for oxidation19, but probably not yet at these early time points. Alternatively, TCA cycle activity may be stimulated to match the increased energy demand, e.g. by intracellular Ca2+ changes elicited by α1-adrenergic or purinergic signals 21,22.
Glucose supply and ureagenesis are major metabolic functions that must be maintained during regeneration. In previous studies blood glucose19 and urea levels23 were not markedly decreased after PHx, indicating that the liver meets the increased demand, despite a 70% decrease in liver mass. Our data support these findings. In both fed and fasted animals the remnant liver appears able to supply metabolic energy to sustain major homeostatic functions. Importantly, the decrease in ATP levels after PHx was not primarily due to increased energy demand, but reflected a net loss of adenine nucleotides. The mechanisms responsible for this loss are not entirely clear. Degradation of adenine nucleotides can occur either through dephosphorylation of AMP by 5′-nucleotidase, which generates adenosine, or through AMP deaminase to form IMP, with subsequent degradation to inosine. However, the increase in AMP that could drive these reactions, although detectable, was relatively modest. We failed to detect a significant increase in AMP degradation products in liver extracts, suggesting that any such compounds were washed out or degraded further. Inhibition of nucleotide synthesis is unlikely to account for the rapid drop in TAN over such a short period. Alternatively, the ATP loss could have occurred without prior dephosphorylation. Shear stress is known to release ATP from isolated hepatocytes and the increased blood flow through the remnant liver after PHx may have a similar effect24. Recent studies demonstrated that ATP can be released from cells through a mechanism involving gap junction-related connexin hemichannels25,26 or non-junctional pannexin hemichannels27. Hepatocytes express connexin-26, which forms anion permeable hemichannels28, as well as pannexin-1 (unpublished data). Regulators of hemichannel opening include both extracellular stress factors and intracellular signals (membrane potential, phosphorylation and redox state)29.
Importantly, the decrease in TAN is functionally distinct from the response to energy demand. Increased glycemia before PHx markedly slowed the changes in ATP/ADP without significantly altering TAN loss. By contrast, fasting or, more dramatically, pretreatment with the α-adrenergic antagonist phentolamine suppressed the loss of adenine nucleotides, but not the changes in ATP/ADP. These effects indicate that the decrease in liver TAN is controlled by signaling processes at least in part mediated through α-adrenergic receptors. Interestingly, protein kinase C and Ca2+-signals regulate gap junctional channel opening30,31, but whether this applies to connexin or pannexin hemichannels in the basolateral membrane remains unclear. It has long been recognized that an early signal must be involved in detecting the loss of functional liver tissue to initiate regeneration, but few studies have considered the time frame of seconds over which the onset of ATP depletion occurs. Such an early upstream signal may involve the mechanical stress associated with increased hemodynamic pressure after PHx. Phentolamine-induced vasodilation within the hepatic vascular bed likely attenuates the immediate hemodynamic changes incumbent upon the remnant tissue, thereby ameliorating the mechanical stress experienced after PHx. However, phentolamine treatment would also suppress the activation of a1-adrenergic receptors on hepatocytes and prevent associated intracellular signaling events that may contribute to the metabolic responses observed in Fig. 4.
A rapid release of ATP (and possibly other cell constituents) following PHx could function as a paracrine signal that is recognized by purinergic receptors on neighboring cells. Stimulation of P2Y2 receptors in hepatocytes activates JNK, promoting induction of immediate-early genes and enhancing cell cycle progression and hepatocyte proliferation in vitro and in vivo32. JNK is a central player in the onset of liver regeneration and is activated during the early priming phase after PHx33,34, promoting the G0–G1 transition in hepatocytes35. Our data demonstrate that treatment with the purinergic antagonist suramin did not prevent PHx-induced ATP loss, but inhibited JNK activation and c-fos expression. Additionally, non-parenchymal cells may be activated by purinergic signals36. Kupffer cells are a potential source of cytokines that mediate priming after PHx, but the signals that activate cytokine release have not been identified. Purinergic stimulation may contribute to these responses.
Apart from a possible role of ATP (or its degradation products) as paracrine stress signals, the loss of adenine nucleotides would also change the intracellular milieu. Remarkably, TAN loss occurred within 30 seconds of PHx, but adenine nucleotide levels did not recover to sham levels until 24–48 hrs, suggesting that the sensing mechanisms maintaining adenine nucleotide homeostasis were offset. One role for such an offset may be to signal the demand for metabolic energy. The major candidate for mediating such intracellular effects is the energy stress sensor AMP-activated protein kinase (AMPK). Although AMP levels in the liver were affected only modestly after PHx, the drop in ATP by itself causes a substantial decline in the ATP/AMP ratio (Table S2). Intracellular AMP concentrations are within the range where AMPK activity could be affected by changes in ATP37. Preliminary experiments suggest that the onset of liver regeneration is accompanied by a rapid activation of AMPK. However, the subsequent temporal profile of AMPK activity is complex, indicating that other factors contribute to maintaining low ATP levels through the replicative phase of regeneration38.
In summary, our data reveal that major changes in the functional state of the remnant liver occur within seconds of PHx, a time frame that until now was almost entirely unexplored. The characteristics of the adenine nucleotide changes observed in this early response phase indicate that energy demand only partially accounts for these effects and suggest that a loss of ATP occurs through a transient opening of non-specific channels in hepatocyte plasma membranes. Inhibition of ATP release by the α-adrenergic antagonist phentolamine or inhibition of purinergic receptor activation by suramin prevented the activation of cell signaling pathways associated with the priming phase and suppressed the expression of the immediate-early gene c-fos. These findings strongly suggest that the release of ATP through this mechanism generates autocrine or paracrine stress signals to the remnant liver that contribute to the priming phase during the onset of regeneration.
Acknowledgments
We thank Christel Cordelier for technical support in aspects of this work. Supported by Grants R01 AA008714, R01 AA15311 and R24 AA014986. SC received training grant support from NIAAA (T32 AA007463) and NIEHS (T32 ES07282).
Footnotes
Abbreviations: AcAc, acetoacetate; BHB, β-hydroxybutyrate; gww, gram wet weight; JNK, Jun N-terminal Kinase; L/P, lactate pyruvate ratio; PHx, partial hepatectomy; PHx30, 30% partial hepatectomy; PHx70, 70% partial hepatectomy; TAN, total adenine nucleotides.
Detailed data on metabolite measurements and mitochondrial respiratory characteristics are provided as supplementary data (tables and figures referred to with the prefix S).
The concentration of inorganic phosphate in the cell would also affect the impact of changes in ATP/ADP ratio. However, in our experiments inorganic phosphate levels in liver extracts were increased or remained unchanged after PHx (data not shown).
References
- 1.Michalopoulos GK, DeFrances MC. Liver regeneration. Science. 1997;276:60–66. doi: 10.1126/science.276.5309.60. [DOI] [PubMed] [Google Scholar]
- 2.Taub R. Liver regeneration: from myth to mechanism. Nat Rev Mol Cell Biol. 2004;5:836–847. doi: 10.1038/nrm1489. [DOI] [PubMed] [Google Scholar]
- 3.Fausto N, Campbell JS, Riehle KJ. Liver regeneration. Hepatology. 2006;43:S45–53. doi: 10.1002/hep.20969. [DOI] [PubMed] [Google Scholar]
- 4.Higgins G, Anderson R. Experimental pathology of the liver: 1. Restoration of the liver of the white rat following partial surgical removal. Arch Pathol. 1931;12:186–202. [Google Scholar]
- 5.Ngala Kenda JF, de Hemptinne B, Lambotte L. Role of metabolic overload in the initiation of DNA synthesis following partial hepatectomy in the rat. Eur Surg Res. 1984;16:294–302. doi: 10.1159/000128422. [DOI] [PubMed] [Google Scholar]
- 6.Niwano Y, Konaka S, Uchida M, Sugimoto T. Activation of mitochondrial functions by malotilate in relation to accelerated liver regeneration in partially hepatectomized rats. Jpn J Pharmacol. 1986;42:525–529. doi: 10.1254/jjp.42.525. [DOI] [PubMed] [Google Scholar]
- 7.Corbin IR, Buist R, Volotovskyy V, Peeling J, Zhang M, Minuk GY. Regenerative activity and liver function following partial hepatectomy in the rat using (31)P-MR spectroscopy. Hepatology. 2002;36:345–353. doi: 10.1053/jhep.2002.34742. [DOI] [PubMed] [Google Scholar]
- 8.Lai HS, Chen WJ. Alterations of remnant liver carnitine palmitoyltransferase I activity and serum carnitine concentration after partial hepatectomy in rats. J Surg Res. 1995;59:754–758. doi: 10.1006/jsre.1995.1235. [DOI] [PubMed] [Google Scholar]
- 9.Kamiyama Y, Ozawa K, Honjo I. Changes in mitochondrial phosphorylative activity and adenylate energy charge of regenerating rabbit liver. J Biochem. 1976;80:875–881. doi: 10.1093/oxfordjournals.jbchem.a131350. [DOI] [PubMed] [Google Scholar]
- 10.Inomoto T, Tanaka A, Mori S, Jin MB, Sato B, Yanabu N, Tokuka A, et al. Changes in the distribution of the control of the mitochondrial oxidative phosphorylation in regenerating rabbit liver. Biochim Biophys Acta. 1994;1188:311–317. doi: 10.1016/0005-2728(94)90050-7. [DOI] [PubMed] [Google Scholar]
- 11.Greco M, Moro L, Pellecchia G, Di Pede S, Guerrieri F. Release of matrix proteins from mitochondria to cytosol during the prereplicative phase of liver regeneration. FEBS Lett. 1998;427:179–182. doi: 10.1016/s0014-5793(98)00419-0. [DOI] [PubMed] [Google Scholar]
- 12.Lee FY, Li Y, Zhu H, Yang S, Lin HZ, Trush M, Diehl AM. Tumor necrosis factor increases mitochondrial oxidant production and induces expression of uncoupling protein-2 in the regenerating mice [correction of rat] liver. Hepatology. 1999;29:677–687. doi: 10.1002/hep.510290320. [DOI] [PubMed] [Google Scholar]
- 13.Askenasy N, Koretsky AP. Differential effects of creatine kinase isoenzymes and substrates on regeneration in livers of transgenic mice. Am J Physiol. 1997;273:C741–746. doi: 10.1152/ajpcell.1997.273.2.C741. [DOI] [PubMed] [Google Scholar]
- 14.Williamson DH, Lund P, Krebs HA. The redox state of free nicotinamide-adenine dinucleotide in the cytoplasm and mitochondria of rat liver. Biochem J. 1967;103:514–527. doi: 10.1042/bj1030514. [DOI] [PMC free article] [PubMed] [Google Scholar]
- 15.Marcinkeviciute A, Mildaziene V, Crumm S, Demin O, Hoek JB, Kholodenko B. Kinetics and control of oxidative phosphorylation in rat liver mitochondria after chronic ethanol feeding. Biochem J. 2000;349:519–526. doi: 10.1042/0264-6021:3490519. [DOI] [PMC free article] [PubMed] [Google Scholar]
- 16.Bergmeyer HU, Bergmeyer J, Grassl M. Methods of Enzymatic Analysis. Weinheim, Germany: Chemie Verlag; 1983. [Google Scholar]
- 17.Veech RL, Lawson JW, Cornell NW, Krebs HA. Cytosolic phosphorylation potential. J Biol Chem. 1979;254:6538–6547. [PubMed] [Google Scholar]
- 18.Bucher NL, Swaffield MN. The Rate of Incorporation of Labeled Thymidine into the Deoxyribonucleic Acid of Regenerating Rat Liver in Relation to the Amount of Liver Excised. Cancer Res. 1964;24:1611–1625. [PubMed] [Google Scholar]
- 19.Paloheimo M, Linkola J, Lempinen M, Folke M. Time-courses of hepatocellular hyperpolarization and cyclic adenosine 3′, 5′-monophosphate accumulation after partial hepatectomy in the rat. Effects of fasting for 48 hours and intravenous injection of glucose. Gastroenterology. 1984;87:639–646. [PubMed] [Google Scholar]
- 20.Cruise JL, Knechtle SJ, Bollinger RR, Kuhn C, Michalopoulos G. Alpha 1-adrenergic effects and liver regeneration. Hepatology. 1987;7:1189–1194. doi: 10.1002/hep.1840070604. [DOI] [PubMed] [Google Scholar]
- 21.McCormack JG, Halestrap AP, Denton RM. Role of calcium ions in regulation of mammalian intramitochondrial metabolism. Physiol Rev. 1990;70:391–425. doi: 10.1152/physrev.1990.70.2.391. [DOI] [PubMed] [Google Scholar]
- 22.Hajnoczky G, Robb-Gaspers LD, Seitz MB, Thomas AP. Decoding of cytosolic calcium oscillations in the mitochondria. Cell. 1995;82:415–424. doi: 10.1016/0092-8674(95)90430-1. [DOI] [PubMed] [Google Scholar]
- 23.Goodman MW, Zieve L. Carbamoyl-phosphate synthetase I activity and ureagenesis in regenerating liver of the normal rat. Am J Physiol. 1985;248:G501–506. doi: 10.1152/ajpgi.1985.248.5.G501. [DOI] [PubMed] [Google Scholar]
- 24.Schlosser SF, Burgstahler AD, Nathanson MH. Isolated rat hepatocytes can signal to other hepatocytes and bile duct cells by release of nucleotides. Proc Natl Acad Sci U S A. 1996;93:9948–9953. doi: 10.1073/pnas.93.18.9948. [DOI] [PMC free article] [PubMed] [Google Scholar]
- 25.Gomes P, Srinivas SP, Van Driessche W, Vereecke J, Himpens B. ATP release through connexin hemichannels in corneal endothelial cells. Invest Ophthalmol Vis Sci. 2005;46:1208–1218. doi: 10.1167/iovs.04-1181. [DOI] [PubMed] [Google Scholar]
- 26.Zhao HB, Yu N, Fleming CR. Gap junctional hemichannel-mediated ATP release and hearing controls in the inner ear. Proc Natl Acad Sci U S A. 2005;102:18724–18729. doi: 10.1073/pnas.0506481102. [DOI] [PMC free article] [PubMed] [Google Scholar]
- 27.Dahl G, Locovei S. Pannexin: to gap or not to gap, is that a question? IUBMB Life. 2006;58:409–419. doi: 10.1080/15216540600794526. [DOI] [PubMed] [Google Scholar]
- 28.Zhao HB. Connexin26 is responsible for anionic molecule permeability in the cochlea for intercellular signalling and metabolic communications. Eur J Neurosci. 2005;21:1859–1868. doi: 10.1111/j.1460-9568.2005.04031.x. [DOI] [PMC free article] [PubMed] [Google Scholar]
- 29.Evans WH, De Vuyst E, Leybaert L. The gap junction cellular internet: connexin hemichannels enter the signalling limelight. Biochem J. 2006;397:1–14. doi: 10.1042/BJ20060175. [DOI] [PMC free article] [PubMed] [Google Scholar]
- 30.Peracchia C. Chemical gating of gap junction channels; roles of calcium, pH and calmodulin. Biochim Biophys Acta. 2004;1662:61–80. doi: 10.1016/j.bbamem.2003.10.020. [DOI] [PubMed] [Google Scholar]
- 31.Warn-Cramer BJ, Lau AF. Regulation of gap junctions by tyrosine protein kinases. Biochim Biophys Acta. 2004;1662:81–95. doi: 10.1016/j.bbamem.2003.10.018. [DOI] [PMC free article] [PubMed] [Google Scholar]
- 32.Thevananther S, Sun H, Li D, Arjunan V, Awad SS, Wyllie S, Zimmerman TL, et al. Extracellular ATP activates c-jun N-terminal kinase signaling and cell cycle progression in hepatocytes. Hepatology. 2004;39:393–402. doi: 10.1002/hep.20075. [DOI] [PubMed] [Google Scholar]
- 33.Diehl AM, Yin M, Fleckenstein J, Yang SQ, Lin HZ, Brenner DA, Westwick J, et al. Tumor necrosis factor-alpha induces c-jun during the regenerative response to liver injury. Am J Physiol. 1994;267:G552–561. doi: 10.1152/ajpgi.1994.267.4.G552. [DOI] [PubMed] [Google Scholar]
- 34.Westwick JK, Weitzel C, Leffert HL, Brenner DA. Activation of Jun kinase is an early event in hepatic regeneration. J Clin Invest. 1995;95:803–810. doi: 10.1172/JCI117730. [DOI] [PMC free article] [PubMed] [Google Scholar]
- 35.Schwabe RF, Bradham CA, Uehara T, Hatano E, Bennett BL, Schoonhoven R, Brenner DA. c-Jun-N-terminal kinase drives cyclin D1 expression and proliferation during liver regeneration. Hepatology. 2003;37:824–832. doi: 10.1053/jhep.2003.50135. [DOI] [PubMed] [Google Scholar]
- 36.Feranchak AP, Fitz JG. Adenosine triphosphate release and purinergic regulation of cholangiocyte transport. Semin Liver Dis. 2002;22:251–262. doi: 10.1055/s-2002-34503. [DOI] [PubMed] [Google Scholar]
- 37.Hardie DG, Salt IP, Hawley SA, Davies SP. AMP-activated protein kinase: an ultrasensitive system for monitoring cellular energy charge. Biochem J. 1999;338(Pt 3):717–722. [PMC free article] [PubMed] [Google Scholar]
- 38.Crumm S. Ph D Thesis. Philadelphia, Pa: Thomas Jefferson University; 2003. Energy metabolism in the regenerating liver following partial hepatectomy: Rapid changes in adenine nucleotides and AMP-activated protein kinase signaling. [Google Scholar]


