Abstract
Objective
The proximal isovelocity surface area (PISA) method is useful in the quantitation of aortic regurgitation (AR). We hypothesized that actual measurement of PISA provided with real-time 3-dimensional (3D) color Doppler yields more accurate regurgitant volumes than those estimated by 2-dimensional (2D) color Doppler PISA.
Methods
We developed a pulsatile flow model for AR with an imaging chamber in which interchangeable regurgitant orifices with defined shapes and areas were incorporated. An ultrasonic flow meter was used to calculate the reference regurgitant volumes. A total of 29 different flow conditions for 5 orifices with different shapes were tested at a rate of 72 beats/min. 2D PISA was calculated as 2π r2, and 3D PISA was measured from 8 equidistant radial planes of the 3D PISA. Regurgitant volume was derived as PISA × aliasing velocity × time velocity integral of AR/peak AR velocity.
Results
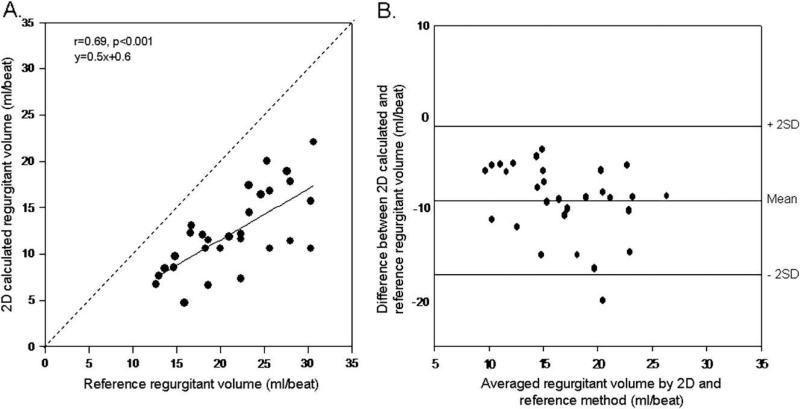
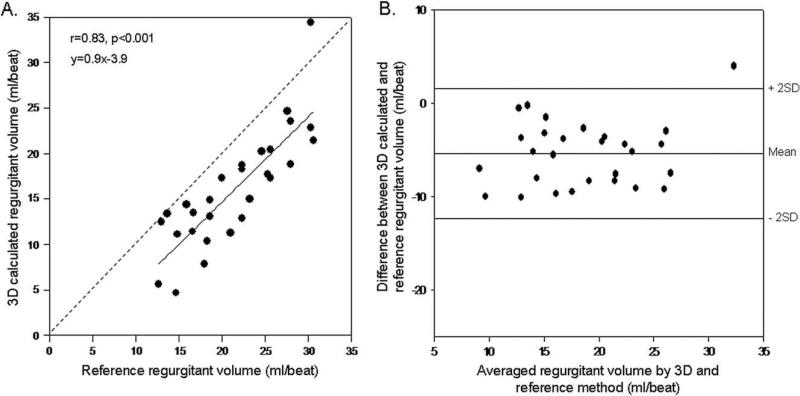
Regurgitant volumes by flow meter ranged between 12.6 and 30.6 mL/beat (mean 21.4 ± 5.5 mL/beat). Regurgitant volumes estimated by 2D PISA correlated well with volumes measured by flow meter (r = 0.69); however, a significant underestimation was observed (y = 0.5x + 0.6). Correlation with flow meter volumes was stronger for 3D PISA-derived regurgitant volumes (r = 0.83); significantly less underestimation of regurgitant volumes was seen, with a regression line close to identity (y = 0.9x + 3.9).
Conclusion
Direct measurement of PISA is feasible, without geometric assumptions, using real-time 3D color Doppler. Calculation of aortic regurgitant volumes with 3D color Doppler using this methodology is more accurate than conventional 2D method with hemispheric PISA assumption.
Keywords: Aortic regurgitation, Proximal isovelocity surface area, Real-time 3-dimensional color Doppler
Several advances in Doppler echocardiography have enhanced the accuracy of noninvasive quantification of aortic regurgitation (AR). However, each technique has its own limitations. The proximal isovelocity surface area (PISA) method is based on a fluid dynamic concept and uses hemispheric assumptions of flow convergence region for the calculation of flow rate and regurgitant volumes.1-3 However, isovelocity surface area can be variable depending on the instrument settings and the shape of the regurgitant orifice.4,5 Accurate isovelocity surface area estimation is essential to the PISA method; however, 2-dimensional (2D) echocardiography is inherently limited because of the geometric assumptions of PISA shape required to calculate regurgitant volume.
Three-dimensional (3D) echocardiography is an imaging technique that can provide the actual geometry of the flow convergence. Direct measurement of PISA with real-time 3D color Doppler echocardiography does not require the use of geometric assumptions and may avoid errors in estimating regurgitant volume. The purpose of this study was to assess the feasibility and accuracy of direct measurement of PISA by using real-time 3D echocardiography in an in vitro model of AR. PISA-derived aortic regurgitant volumes obtained by 2D and 3D methods were compared with actual volumes measured by an ultrasonic flow meter.
MATERIALS AND METHODS
Flow Model
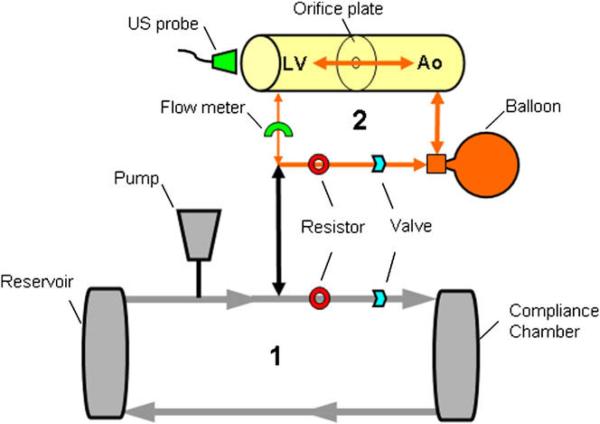
We developed a flow model to simulate the hemodynamic conditions of AR. The model consisted of 2 connected flow loops (Figure 1). The main circulatory loop was driven by a pump (Thoratec HeartMate IP LVAS, Pleasanton, CA) that applies active systolic ejection and passive diastolic filling. Flow was driven through an adjustable resistor into an air-filled compliance chamber, to an unpressurized fluid reservoir (representing the venous system), and then back to the pump.
Figure 1.
Schematic representation of the experimental setup of the pulsatile flow model for AR. In the primary circulatory loop (1), flow was driven through an adjustable resistor into an airfilled compliance chamber, to a fluid reservoir, and then back to the pump. The secondary flow loop (2) contained an imaging chamber serving as a model of the left ventricle and aorta. Flow volume into the imaging chamber was controlled by modification of resistance within the primary circulatory loop. The compliance of the balloon and passive “diastolic” filling property of the pump generated the regurgitant flow across the imaging chamber orifice within the secondary loop. LV, Left ventricle; Ao, aorta.
A second flow loop contained an imaging chamber with inlet and outlet chambers serving as models of the left ventricle and aorta. The inlet chamber contained a silicone membrane imaging window oriented axial to the long axis of flow. Different regurgitant orifices with defined shapes and areas were mounted within the 2-chamber imaging cylinder. The volume of pulsatile flow directed into the imaging chamber was controlled primarily by modification of resistance within the main circulatory loop. Increasing resistance within the main circulatory loop forced a greater proportion of the pulsatile flow into the imaging loop and acted as the first adjustment to tailor the ’regurgitant” flow. In addition, both the outlet chamber of the imaging loop and an additional bypass line were connected to a rubber balloon. The compliance of the balloon and the passive diastolic filling property of the pump generated the regurgitant flow. The bypass line within the imaging loop was required to augment regurgitant flow and to avoid a model of aortic stenosis/regurgitation, which was created when the balloon was simply attached to the dead-end outflow chamber. An adjustable flow resistor was also used on the smaller imaging loop to fine-tune the regurgitant flow volumes directed into the balloon and out toward the imaging chamber and regurgitant flow orifice. An ultrasound flow probe was placed at the inflow/outflow tube of the inlet chamber and connected to a flow meter to record the reference regurgitant volumes. Tap water mixed with 20% glycerine was used as fluid media with the addition of cornstarch to create ultrasound reflections.
Orifice Areas and Hemodynamic Setting for Aortic Regurgitation
AR in the imaging chamber was created using 2 circular orifices (0.19 and 0.38 cm2), 2 triangular orifices (0.25 and 0.4 cm2) to simulate central noncoaptation of 3 aortic cusps, and 1 arc-shaped orifice (0.4 cm2) to simulate a regurgitant bicuspid valve. Regurgitant orifices were grouped as circular and noncircular orifices (triangles and arc). For each orifice, 5 or 6 hemodynamic conditions were tested. Different hemodynamic states were created by adjusting the resistance on the outlet tube of the pump going into the compliance chamber, thus changing the volume going into the imaging chamber. The pump rate was set at 72 beats/min.
Two-dimensional Doppler Echocardiography
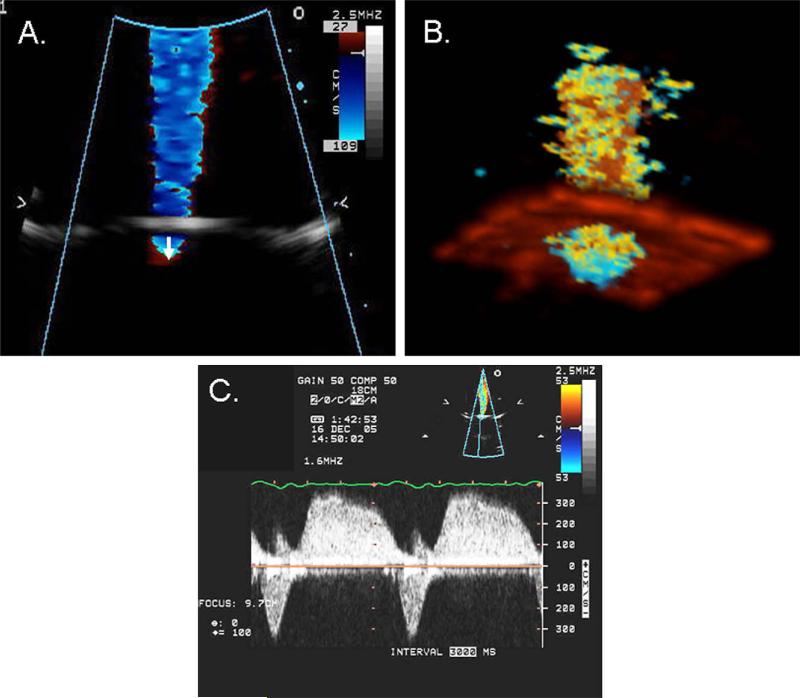
AR-like color jets and continuous Doppler waveforms were obtained for each regurgitant orifice shape (Figure 2). A Philips Sonos 7500 ultrasound system (Philips Medical Systems, Andover, MA) with an S3 multifrequency transducer was used to acquire color flow Doppler and continuous-wave Doppler images for each flow condition. Because the imaging window and the transducer position were parallel to the flow, the ultrasound beam and regurgitant flow were well aligned. The Nyquist limit was set between 52 and 68 cm/sec, and the aliasing velocity was set between 21 and 41 cm/sec to define the optimal hemispheric shape of PISA. Zoom images were used to measure the radius (r), the distance between the first aliasing contour of the flow convergence region, and the regurgitant orifice along the centerline of the isovelocity surface (Figure 2A). Studies were stored digitally for offline quantitative analysis.
Figure 2.
2D (A) and 3D (B) color flow imaging of the jet and flow convergence and continuous-wave Doppler recording of AR flow (C). 2D flow convergence radius was measured from the midpoint of the regurgitant orifice to the first aliasing contour of the flow convergence region (arrow). Note the aortic stenosis-like systolic flow velocity reaching a peak velocity of 3.5 m/s and AR-like diastolic flow (C).
Aortic regurgitant flow rate was calculated as regurgitant flow rate = 2π × r2 × Va, where r was the radius of the PISA and Va was the corresponding aliasing velocity.6 Effective regurgitant orifice area (EROA) was derived by dividing regurgitant flow rate by the maximal velocity of aortic regurgitant jet recorded with continuous-wave Doppler. Aortic regurgitant volume was then calculated as regurgitant volume = EROA × time velocity integral of the aortic regurgitant jet.
Real-Time 3D Color Doppler Echocardiography
3D color Doppler images were acquired using a Sonos 7500 Live 3D ultrasound system with a 2 to 4-MHz XMatrix transducer (Philips Medical Systems, Andover, MA). Image quality was optimized by adjusting the Nyquist limit, depth, gain, and harmonic settings. The Nyquist limit was set between 52 and 68 cm/sec, and aliasing velocity was set between 21 and 32 cm/sec. An electrocardiogram-like signal generated by the pump was used to trigger 3D image acquisition. Data were acquired in 7 cycles using high-density color volume mode, resulting in a narrow pyramidal sector (30 × 30 degrees) that contains both morphologic and color Doppler flow information (Figure 2B).
3D Data Analysis
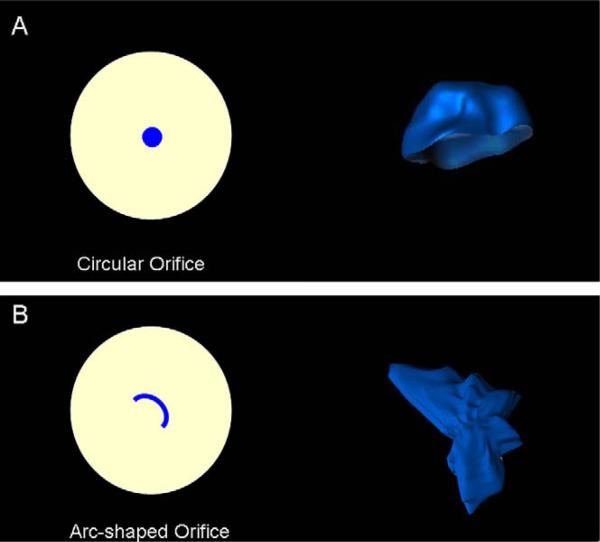
3D images were imported into TomTec software database (4D Echo-View, TomTec, Munich, Germany) and analyzed offline. Analyses were performed by an investigator who was blinded to both flow meter and 2D Doppler data. Contours of the hemispheric surfaces were traced manually in 8 planes, and the total surface area in 3D was computed by the software (Figure 3). The duration of measurement of PISA by this method was 6 to 7 minutes. 3D EROA was calculated as 3D PISA × Va/maximal velocity of aortic regurgitant jet. Like the 2D method, regurgitant volume was calculated as EROA × time velocity integral of the aortic regurgitant jet.
Figure 3.
Circular and arc-shaped regurgitant orifices and corresponding reconstruction of PISA using real-time 3D color Doppler imaging. Note the hemisphere-like shape of the flow convergence zone created by circular regurgitant orifice (A) and highly asymmetric shape of PISA created by the arc-shaped orifice (B).
Interobserver Variability
To evaluate the interobserver variability on regurgitant volumes obtained by real-time 3D and 2D echocardiography, 5 randomly selected flow conditions were analyzed by 2 independent observers, each blinded to both actual flow data and the other observer's measurements.
Statistical Analysis
Variables are presented as mean ± standard deviation. The relation between 2D and 3D color Doppler-derived EROA versus actual orifice area and calculated regurgitant volumes versus the ultrasonic flow meter measured volumes was assessed by simple linear regression analysis. Bland-Altman analysis was performed to demonstrate the agreements between methods. Regurgitant volumes determined for circular and noncircular orifices were analyzed separately. Linear regression analysis was used to test the correlations between 2D and 3D methods versus the reference method for these subgroups. Statistical significance was set at P < .05.
RESULTS
The in vitro model created a mean systolic pressure of 123 ± 41 mm Hg in the inlet chamber and 67 ± 9 mm Hg in the outlet chamber. Aortic regurgitant volumes per beat obtained by flow meter were in the mild to moderate AR range between 10.6 and 30.6 mL/beat (average, 21.4 ± 5.5 mL/beat). Peak flow rates of AR ranged from 1.9 to 4.5 L/min with a mean value of 3.6 ± 0.68 L/min.
Relation between Effective Regurgitant Orifice Areas Derived from 2D and 3D PISA versus Actual Orifice Area
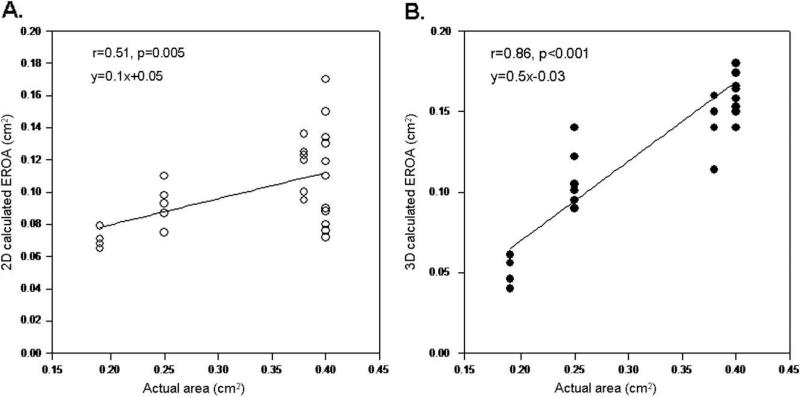
EROA obtained with the 2D PISA method ranged between 0.06 and 0.17 cm2, with a mean value of 0.10 ± 0.02 cm2. A significant correlation was seen between 2D-calculated EROA and actual orifice area when all shapes were analyzed (r = 0.51, P = .005). EROA derived from 3D PISA ranged between 0.04 and 0.22 cm2 (mean 0.13 ± 0.04 cm2) and demonstrated a stronger relation with the actual area (r = 0.85, P < .001) (Figure 4). For the 2D PISA method, correlation was strong for circular orifices (r = 0.89, P < .001); however, there was no significant correlation between actual area and 2D-calculated EROA for noncircular (triangles and arc) orifices. For the 3D PISA method, correlations between EROA and the actual area were similar for both circular and noncircular orifices (r = 0.9, P < .001 and r = 0.79, P < .001, respectively).
Figure 4.
Linear regression analysis between the actual area of regurgitant orifices for all shapes and EROA calculated by 2D (A) and 3D (B) PISA methods.
Comparison of Regurgitant Volumes Obtained by 2D and 3D PISA versus Flow Meter for All Shapes
Calculated aortic regurgitant volumes with the hemispheric isovelocity surface assumptions using 2D color Doppler correlated well with those obtained by the ultrasonic flow meter, but with significant underestimation (Figure 5). Regurgitant volumes derived from direct measurement of PISA with the use of the 3D color Doppler method demonstrated a stronger relation with the corresponding data determined by the reference method (Figure 6). Underestimation of the volumes was less with the 3D method when compared with the 2D method (differences for 2D and 3D, –9.1 ± 4.0 mL/beat and –5.4 ± 3.4 mL/beat, respectively, P < .001).
Figure 5.
(A) Linear regression analysis between 2D-calculated regurgitant volume and reference regurgitant volume measured by flow meter. (B) Agreement between 2D-calculated and reference regurgitant volumes according to the method of Bland and Altman.
Figure 6.
(A) Linear regression analysis between 3D-calculated regurgitant volume and reference regurgitant volume measured by flow meter. (B) Agreement between 3D-calculated and reference regurgitant volumes according to the method of Bland and Altman.
Agreements between Regurgitant Volumes Calculated in Orifices with Different Shapes
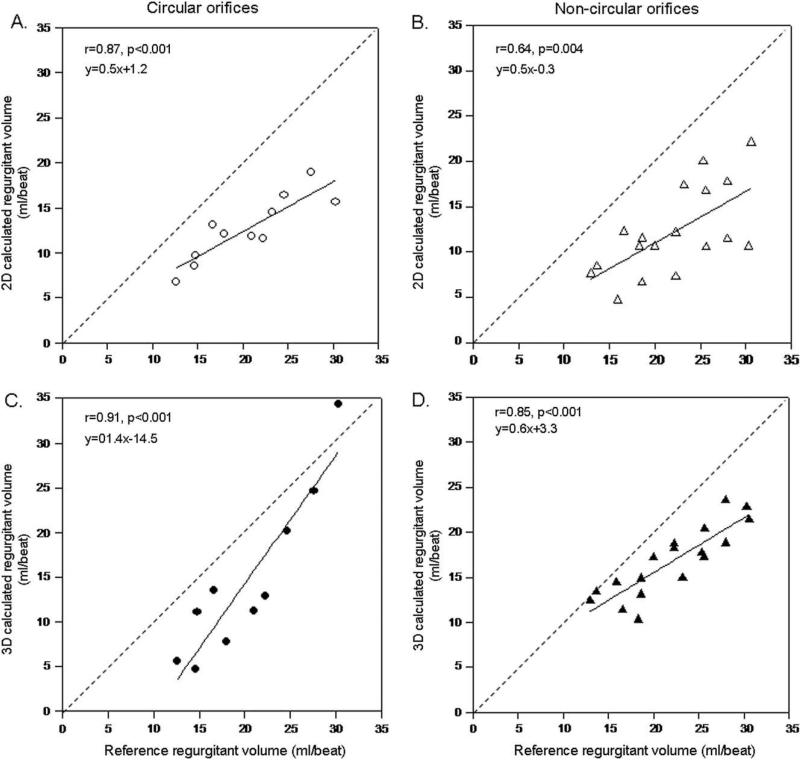
Agreements between 2D color Doppler-calculated regurgitant volumes and flow meter-measured volumes were stronger for circular shapes than for noncircular shapes (r = 0.87, P < .001 vs r = 0.64, P = .004). Direct measurement of PISA with 3D color Doppler yielded an improvement in correlations for both orifices, the improvement compared with 2D being more pronounced in noncircular orifices (r = 0.91, P < .001 for circular orifices and r = 0.86, P < .001 for noncircular orifices) (Figure 7). The difference between calculated and measured volumes was significantly higher with the 2D method than the 3D method for noncircular orifices (–9.8 ± 4.4 mL/beat vs –5.2 ± 2.8 mL/beat, P < .001), whereas it was similar for symmetric orifices (–7.8 ± 3.0 mL/beat vs –5.6 ± 4.5 mL/beat, P = .2).
Figure 7.
Linear regression analysis between actual and calculated regurgitant volumes by 2D PISA method for circular (A) and non-circular (B) regurgitant orifices and by 3D PISA method for circular (C) and noncircular (D) orifices.
Interobserver Variability
There was a good correlation between the regurgitant volumes obtained by the 3D color Doppler method by 2 independent observers (r = 0.78, mean difference = 2.0 ± 5.5 mL/beat). For 2D color Doppler, the correlation between observers was r = 0.85 with a mean difference between observations in regurgitant volume of 2.0 ± 2.8 mL.
DISCUSSION
The present study demonstrated that direct measurement of PISA with real-time 3D echocardiography is feasible for AR without relying on hemispheric assumptions. This method provided more accurate estimates of aortic regurgitant volumes when compared with the 2D color Doppler method. The most pronounced improvement with the 3D method was observed for noncircular regurgitant orifices.
Quantification of Aortic Regurgitation Severity with PISA
The flow convergence method has been used for quantification of valvular regurgitation, more often for mitral regurgitation but also for AR.3,7-10 Shiota et al11 demonstrated that the PISA method predicted reference aortic regurgitant orifice area and regurgitant volume reasonably well in an animal study. It was also shown that with appropriate flow convergence region, the PISA method can be used to measure EROA in patients with AR.12 Those validation studies were dependent on hemispheric assumption of the shape of isovelocity surface, so that 1 dimension (radius of PISA) represented all dimensions of the flow convergence. However, the geometry of the isovelocity surface depends on many factors, orifice geometry and selected aliasing velocity being the most important.4,5
Direct Measurement of PISA by Real-time 3D Echocardiography
3D imaging has the advantage of avoiding any geometric assumptions and determining the actual shape of the isovelocity surface. Therefore, direct measurement of the PISA should reduce the errors in calculating regurgitant volumes caused by the 2D method. In our study, both EROA and aortic regurgitant volume calculated by real-time 3D color Doppler showed better correlation and agreement with the reference method than those calculated by the 2D method. We used new software for the direct measurement of PISA based on a method of direct tracing of the surface contours in multiple radial planes to compute a 3D surface area. The same method used in our laboratory for the quantification of in vitro mitral regurgitation demonstrated that regurgitant volume derived from 3D PISA was more accurate than the conventional 2D PISA method.13 Shiota et al14 reported direct measurement of flow convergence surface area in AR for 3D reconstructed images. However, in addition to the complexity of reconstruction technique, the isovelocity surface was cut in parallel sections and the area was calculated by multiplying the length of slices by corresponding thickness. Similar to our results, the results of Shiota et al showed that the 3D method provided more accurate quantification of the severity of AR than the 2D methods. Real-time 3D measurement of flow convergence radius has been reported for mitral regurgitation, although the study methodology used a hemispheric assumption for the surface area calculation.15
For both 2D and 3D methods, the Doppler-derived EROA was significantly smaller than the actual ROA. In our pulsatile model, we hypothesize that this difference is largely due to the boundary effects of pulsatile flow through a rigid restrictive orifice. This observation was in agreement with fluid dynamic theory.16 Mascherbauer et al17 also reported that with plate regurgitant orifices, vena contracta obtained by a reference method (laser) corresponded to 65% of the actual orifice diameter because of flow contraction. The improved correlation to Doppler-derived regurgitant volume in our study supports this explanation because flow volume was compared with an independent in vitro standard.
In the present study, regurgitant volumes calculated by 2D and 3D were similar for circular regurgitant orifices; however, the 3D method demonstrated significant improvement in correlation with the reference method for noncircular orifices. We observed highly asymmetric, nonhemispheric flow convergence geometry when the arc shape was incorporated in the model, which mimicked regurgitant orifice in the presence of a bicuspid aortic valve (Figure 3B). The ability to determine any flow convergence geometry by the 3D method allows a better estimation of aortic regurgitant volume for the noncircular regurgitant orifices.
Although the 3D method yielded more accurate regurgitant volumes than the 2D method, both methods underestimated the actual volume. This was mainly because of the flattened shape of flow convergence, which was observed particularly for noncircular orifices. Application of a wide range of aliasing velocities did not overcome the problem. In fact, in a steady flow model with similar flow rates observed in the present study, Shiota et al18 reported similar degrees of underestimation of regurgitant volumes by using 3D reconstruction of the flow convergence.
Study Limitations
Doppler angulation, especially at the lateral borders of the 3D flow convergence, leads to some degree of true isovelocity surface area underestimation. Our methodology did not apply angle correction, which may have further improved the 3D PISA method correlation to EROA and regurgitant volume.
To simulate physiologic aortic regurgitant flow, balloons with different sizes and compliance properties were tested, and the one that provided the optimal AR-like color jet and continuous Doppler waveforms was selected. Also, when larger regurgitant orifices were used, the rate of pressure gradient decay was not consistent with acute or chronic physiologic AR. Although the maximal regurgitant volume obtained was modest (31 mL/beat), the Doppler tools for quantification of AR are most often used clinically for the assessment of moderate AR. Nevertheless, the results of our study cannot be generalized to the assessment of severe AR.
In this model we tested symmetric and asymmetric regurgitant orifices; however, all orifices were planar by design so that we could model relatively simple flat-bottomed 3D PISA shapes. The pathologic flows of clinical AR may be nonplanar with more complex PISA geometry. In addition, the regurgitant orifices of differing size and shape that we used in this study may not be representative of all the pathologic conditions that result in AR. As in all models, the novel measurement concept must be validated under controlled and relatively simple conditions and then, if justified, applied in more complex models and clinically.
CONCLUSIONS
Direct measurement of PISA without geometric assumptions by real-time 3D color Doppler echocardiography provided more accurate regurgitant volumes than 2D color Doppler methods. This method is relatively easy to perform, less time-consuming than the previously reported 3D reconstructed analysis, and worthy of clinical application and evaluation.
Footnotes
Presented as an abstract at the annual scientific sessions of American Society of Echocardiography, June 3, 2006, Baltimore, Maryland.
There is no conflict of interest to declare.
REFERENCES
- 1.Schwammenthal E, Chen C, Giesler M, Sagie A, Guerrero JL, Vazquez de Prada JA, et al. New method for accurate calculation of regurgitant flow rate based on analysis of Doppler color flow maps of the proximal flow field. Validation in a canine model of mitral regurgitation with initial application in patients. J Am Coll Cardiol. 1996;27:161–72. doi: 10.1016/0735-1097(95)00428-9. [DOI] [PubMed] [Google Scholar]
- 2.Schwammenthal E, Chen C, Benning F, Block M, Breithardt G, Levine RA. Dynamics of mitral regurgitant flow and orifice area. Physiologic application of the proximal flow convergence method: clinical data and experimental testing. Circulation. 1994;90:307–22. doi: 10.1161/01.cir.90.1.307. [DOI] [PubMed] [Google Scholar]
- 3.Pu M, Prior DL, Fan X, Asher CR, Vasquez C, Griffin BP, et al. Calculation of mitral regurgitant orifice area with use of a simplified proximal convergence method: initial clinical application. J Am Soc Echocardiogr. 2001;14:180–5. doi: 10.1067/mje.2001.110139. [DOI] [PubMed] [Google Scholar]
- 4.Utsunomiya T, Ogawa T, Doshi R, Patel D, Quan M, Henry WL, et al. Doppler color flow “proximal isovelocity surface area” method for estimating volume flow rate: effects of orifice shape and machine factors. J Am Coll Cardiol. 1991;17:1103–11. doi: 10.1016/0735-1097(91)90839-2. [DOI] [PubMed] [Google Scholar]
- 5.Simpson IA, Shiota T, Gharib M, Sahn DJ. Current status of flow convergence for clinical applications: is it a leaning tower of “PISA”? J Am Coll Cardiol. 1996;27:504–9. doi: 10.1016/0735-1097(95)00486-6. [DOI] [PubMed] [Google Scholar]
- 6.Zoghbi WA, Enriquez-Sarano M, Foster E, Grayburn PA, Kraft CD, Levine RA, et al. Recommendations for evaluation of the severity of native valvular regurgitation with two-dimensional and Doppler echocardiography. J Am Soc Echocardiogr. 2003;16:777–802. doi: 10.1016/S0894-7317(03)00335-3. [DOI] [PubMed] [Google Scholar]
- 7.Chen C, Koschyk D, Brockhoff C, Heik S, Hamm C, Bleifeld W, et al. Noninvasive estimation of regurgitant flow rate and volume in patients with mitral regurgitation by Doppler color mapping of accelerating flow field. J Am Coll Cardiol. 1993;21:374–83. doi: 10.1016/0735-1097(93)90678-t. [DOI] [PubMed] [Google Scholar]
- 8.Rivera JM, Vandervoort PM, Thoreau DH, Levine RA, Weyman AE, Thomas JD. Quantification of mitral regurgitation with the proximal flow convergence method: a clinical study. Am Heart J. 1992;124:1289–96. doi: 10.1016/0002-8703(92)90414-q. [DOI] [PubMed] [Google Scholar]
- 9.Enriquez-Sarano M, Miller FA, Jr, Hayes SN, Bailey KR, Tajik AJ, Seward JB. Effective mitral regurgitant orifice area: clinical use and pitfalls of the proximal isovelocity surface area method. J Am Coll Cardiol. 1995;25:703–9. doi: 10.1016/0735-1097(94)00434-R. [DOI] [PubMed] [Google Scholar]
- 10.Xie GY, Berk MR, Hixson CS, Smith AC, DeMaria AN, Smith MD. Quantification of mitral regurgitant volume by the color Doppler proximal isovelocity surface area method: a clinical study. J Am Soc Echocardiogr. 1995;8:48–54. doi: 10.1016/s0894-7317(05)80357-8. [DOI] [PubMed] [Google Scholar]
- 11.Shiota T, Jones M, Yamada I, Heinrich RS, Ishii M, Sinclair B, et al. Effective regurgitant orifice area by the color Doppler flow convergence method for evaluating the severity of chronic aortic regurgitation. An animal study. Circulation. 1996;93:594–602. doi: 10.1161/01.cir.93.3.594. [DOI] [PubMed] [Google Scholar]
- 12.Tribouilloy CM, Enriquez-Sarano M, Fett SL, Bailey KR, Seward JB, Tajik AJ. Application of the proximal flow convergence method to calculate the effective regurgitant orifice area in aortic regurgitation. J Am Coll Cardiol. 1998;32:1032–9. doi: 10.1016/s0735-1097(98)00356-8. [DOI] [PubMed] [Google Scholar]
- 13.Little SH, Igo SR, Pirat B, McCulloch M, Hartley CJ, Nose Y, et al. In vitro validation of real-time three-dimensional color Doppler echocardiography for direct measurement of proximal isovelocity surface area in mitral regurgitation. Am J Cardiol. 2007;99:1440–7. doi: 10.1016/j.amjcard.2006.12.079. [DOI] [PMC free article] [PubMed] [Google Scholar]
- 14.Shiota T, Jones M, Delabays A, Li X, Yamada I, Ishii M, et al. Direct measurement of three-dimensionally reconstructed flow convergence surface area and regurgitant flow in aortic regurgitation: in vitro and chronic animal model studies. Circulation. 1997;96:3687–95. doi: 10.1161/01.cir.96.10.3687. [DOI] [PubMed] [Google Scholar]
- 15.Sitges M, Jones M, Shiota T, Qin JX, Tsujino H, Bauer F, et al. Real-time three-dimensional color Doppler evaluation of the flow convergence zone for quantification of mitral regurgitation: validation experimental animal study and initial clinical experience. J Am Soc Echocardiogr. 2003;16:38–45. doi: 10.1067/mje.2003.37. [DOI] [PubMed] [Google Scholar]
- 16.Yoganathan AP, Cape EG, Sung HW, Williams FP, Jimoh A. Review of hydrodynamic principles for the cardiologist: applications to the study of blood flow and jets by imaging techniques. J Am Coll Cardiol. 1988;12:1344–53. doi: 10.1016/0735-1097(88)92620-4. [DOI] [PubMed] [Google Scholar]
- 17.Mascherbauer J, Rosenhek R, Bittner B, Binder J, Simon P, Maurer G, et al. Doppler echocardiographic assessment of valvular regurgitation severity by measurement of the vena contracta: an in vitro validation study. J Am Soc Echocardiogr. 2005;18:999–1006. doi: 10.1016/j.echo.2005.03.021. [DOI] [PubMed] [Google Scholar]
- 18.Shiota T, Sinclair B, Ishii M, Zhou X, Ge S, Teien DE, et al. Three-dimensional reconstruction of color Doppler flow convergence regions and regurgitant jets: an in vitro quantitative study. J Am Coll Cardiol. 1996;27:1511–8. doi: 10.1016/0735-1097(96)00009-5. [DOI] [PubMed] [Google Scholar]


