

Abstract
Myosin motor protein exists in two alternative conformations, pre-recovery state M* and post-recovery state M**, upon ATP binding. The details of the M*-to-M** transition, known as the recovery stroke to reflect its role as the functional opposite of the force-generating power stroke, remain elusive. The defining feature of the post-recovery state is a kink in the relay helix, a key part of the protein involved in force generation. In this paper we determine the interactions that are responsible for the appearance of the kink. We design a series of computational models that contain three other segments, relay loop, converter domain and Src homology 1 domain helix (SH1), with which relay helix interacts, and determine their structure in accurate replica exchange molecular dynamics simulations in explicit solvent. By conducting an exhaustive combinatorial search among different models we find that: 1) the converter domain must be attached to the relay helix during the transition, so it does not interfere with other parts of the protein, 2) the structure of the relay helix is controlled by SH1 helix. The kink is strongly coupled to the position of SH1 helix. It arises as a result of direct interactions between SH1 and the relay helix and leads to a rotation of the C-terminal part of the relay helix which is subsequently transmitted to the converter domain.
Keywords: myosin, motor protein, recovery stroke, molecular simulations, replica exchange
Introduction
Myosin II is a motor protein involved in the contractile function of muscles. According to the kinetic studies of Lymn and Taylor1, the functional cycle of myosin contains several steps consisting of conformational transitions and binding events to adenosine triphosphate (ATP) and actin filaments. Key among these steps is the force generating power stroke that occurs in actin-bound myosin following the hydrolysis of ATP. The functional opposite of this step, the recovery stroke, is designed to return the myosin to its productive state ready to exercise force and occurs in ATP-bound form but detached from actin. The initial and final conformations of the recovery step are termed correspondingly pre-recovery, M*, and post-recovery, M**, states. The microscopic details of the transition between these two states, which is reversible 2,3 and can be controlled by temperature and pressure2, are poorly understood at present4–12.
Crystallographic studies13 of the catalytic domain of myosin, myosin head, which for simplicity will be referred to as myosin here, show three areas where the structure of M* and M** conformations diverge. As illustrated in Figure 1, these are 1) the ATP binding site, 2) the converter domain and 3) the relay helix. At the ATP binding site, a loop termed switch II is found in the closed state in M** conformation, where residue G457 makes a hydrogen bond with the gamma phosphate of ATP, and in the open state in M* conformation, where the hydrogen bond is absent. The converter domain, which is chemically coupled to the neck domain responsible for the transduction of force, undergoes a large rotation around the relay helix during the recovery step. The relay helix is initially straight in pre-recovery conformation M* but develops a kink or a bend in the post-recovery state M**. In addition, a small Src homology 1 (SH1) domain helix is shifted upon the M* -to- M** transition by approximately 4Å toward the converter domain along the relay helix.
Fig. 1.

Cartoon explaining two alternative states of ATP-bound myosin head: pre-recovery stroke state M* and post-recovery state M**. The recovery stroke consists of two steps: 1) Closure of switch II loop in M* state and 2) The resulting cascade of conformational changes that leads to the bending of the relay helix and rotation of the converter domain in M** state. The two events occur in physically distinct locations, highlighted by squares, separated by 40Å one from another.
Computational studies by our group14 and by others15,16 suggest that the closure of switch II occurs early on in the reaction, triggering the deformation of the relay helix and the rotation of the converter domain. The two events occur in physically distinct locations, separated one from another by close to 40Å. The coupling between them was suggested to consist of a series of small-scale conformational changes that lead to SH1 helix pushing on the converter domain17,18 and causing it to rotate. The bending of the relay helix occurs as a result of the rotation18. The rotation and the closure of the switch II in this18 and similar models15 are fully correlated, with the implication that one cannot be realized without the other. This mechanistic view is questioned in statistical models of the coupling14,16,19,20, where the open/close state of the switch favors statistically M*/M** conformation of the relay helix but does not define it in a deterministic manner. As a result, the switch and the converter/relay helix assembly communicate with one another via the shift of population mechanism, rather than by mechanistic pathways.
The statistical interpretation assumes that states M* and M** represent two alternative conformations that become populated according to the state of switch II. It is imperative to fully characterize the folding into these two states in order to understand the mechanism of the recovery stroke. As Figure 1 shows, the relay helix, converter domain and SH1 helix form a localized cluster of structural motifs, for which the remainder of the protein are either a) far removed or b) differing little between M* and M** conformations. It thus is very likely that the conformational preferences of the cluster are determined by the internal interactions that occur within its boundaries. In this paper, we determine systematically these interactions by considering a series of computational models that contain different components of the cluster. The models are constructed as flexible in those parts of the cluster where M* and M** differ while keeping the parts that are identical constrained. The conformational preferences of our models are probed in accurate replica exchange simulations in explicit solvent.
The present work pursues two goals: 1) to find the minimal model that exhibits M*-M** transition seen experimentally and 2) to characterize the role of different parts involved in that model. Our simulations reveal that the isolated myosin fragment containing the relay helix has a marginal intrinsic preference to remain in a helical state. Appending it with the relay loop enhances the helicity significantly, consistent with M* state, but does not help to create a kink or a bend seen in M** state. Although the converter domain must be attached to the relay helix during the recovery stroke to prevent unproductive interactions with SH1, it does not contribute to the creation of the kink either. It is seen that the interactions with SH1 are critical for that purpose. Position of SH1 is strongly correlated with the conformation of the relay helix and the rotation angle of the converter domain. Assuming that the communication between the active site and the force-generating region is passed through SH1, as many mutational studies suggest21, our simulations are consistent with the following novel model of the recovery stroke. The first step is the closure of switch II. It triggers a displacement in SH1, which subsequently causes a shift in the relay helix from predominantly M*-like to predominantly M**-like conformations. Finally, the relay helix rotates the converter domain attached to it, completing the transition.
Results
Minimal model for M*-to-M** transition
We apply the combinatorial approach introduced in the “Methods and Models” section to identify the minimal model that exhibits M*-to-M** transition. To find the components of that model we first aligned M* and M** conformations along the N-terminal part of the helix (which is identical in both states) as shown in Figure 2(a). It is seen that the relay helix develops a kink in M** structure around residue F487 resulting in a rotation of the C-terminal part of the helix. We then identified all interaction partners of the C-terminal motif, which as Figure 2(a) shows, include a) the relay loop connecting the relay helix with the actin-binding region of the protein, b) the converter domain which rotates in M** state relative to M* state and c) the SH1 helix which is shifted in M** by approximately 4Å toward the converter domain. All other parts of the protein are either identical in M* and M** states or do not come into direct contact with the C-terminal part of the relay helix. Based on this analysis we construct a computational model, shown in Figure 2(b) along with accompanying notations, that contains the following components: 1) relay helix (RH), 2) relay loop (RL), 3) converter domain (CD) and 4) SH1 helix. The role of various interactions that occur within this model in defining the conformational states of the relay helix is discussed in subsequent sections.
Fig. 2.
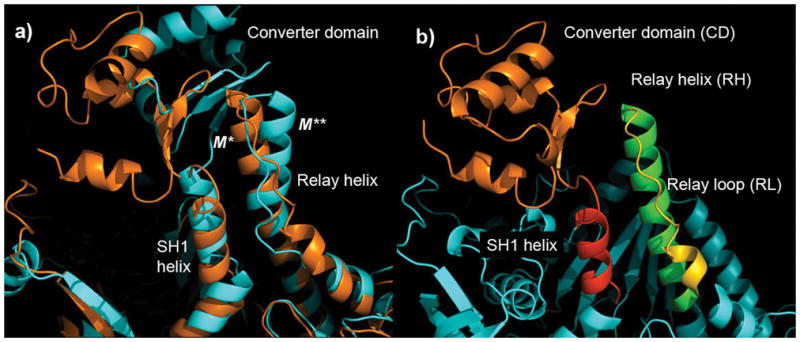
Myosin fragment containing converter domain, relay helix and loop and SH1 helix in a) M* and M** states aligned along the N-terminal part of the relay helix and b) M* conformation with different parts colored appropriately. It is assumed that the structural elements highlighted in b) form a motif within which folding of the relay helix into two alternative conformations, M* and M**, is encoded. Interactions responsible for that folding are determined by the combinatorial search described in the text. All pictures presented in this work were generated using PyMol41
Relay helix fragment has insignificant intrinsic preference for α-helical states
First, we examined whether the fragment that corresponds to the relay helix, RH, has a tendency to fold into states M* and M**. The two structures differ in many aspects including the secondary structure where the post-recovery conformation has no α-helix around position 486. A complete analysis of the secondary structure was conducted on the sampled conformations according to the protocol of Kabsch and Sander22. Apart from random coil, two more secondary structure types, α-helix and 310 helix, emerged as most populated. Their distribution along the sequence, displayed in Figure 3(a), shows that the elongated 310 helix is limited to residues 493–495, where its population is less than 20%. Two regions are clearly seen in the population distribution of α-helix. First it is the residues 475–486 of the N-terminal part with a high population of >50%. This segment includes both constrained, 475–482, as well as unconstrained residues, 483–486, indicating that the structure of the N-terminal part of the helix is propagated further along the sequence. The second region is composed of residues 487–494 and has a low population of less than 30% that decreases gradually toward the C-terminal end. The decrease is quite dramatic between residues 486 and 487 where the population drops from 55% to 30%. We note that this is exactly where a kink in the post-recovery conformation M** is seen.
Fig. 3.

Residue-specific structural characterization: a) Secondary structure observed in our simulations for the isolated relay helix. Two most populated non-random structures, α-helix and 310 helix, are shown. The arrow indicates the boundary of the constrained region. b) Hydrogen-bond pattern observed for the same model in equilibrium and short simulations started from M** structure. Probability of forming a hydrogen bond between oxygen atom of residue i and nitrogen atom of residue i+4 or i+5 is shown. The α-helical pattern is broken in short simulations with the appearance of characteristic i,i+5 bonds at the site of the kink. No such bonds are seen in equilibrium sampling.
To learn more about the distribution of the structure along the fragment a clustering analysis over consecutive 5-residue segments was performed as described previously23. The analysis revealed that all of the examined segments fold predominantly into α-helical states. Their population is reduced progressively from 100% in the N-terminal region to 25% in the C-terminal region. The resulting folding picture is one where the N-terminal helix is dissolved gradually toward the C-terminal end without creating alternative conformations. An α-helix that spans the entire peptide, residues 475–494, is populated insignificantly, only 20% of the time.
Based on Cα RMSD<1.7Å, estimated population of the M** helix with a kink is less than 1%, which is neglible. To determine whether some remnants of that structure are observed in our simulations we performed hydrogen bond analysis of the backbone atoms. The population of the signature α-helical bonds between oxygen atom of residue i and nitrogen atom of residue i+4 was estimated based on the mutual distance between these atoms. Distances <4Å were interpreted as indicating a hydrogen bond. Additionally, hydrogen bond probability was estimated for i,i+5 pairs. Figure 3(b) shows these probabilities computed over the entire trajectory, which represents equilibrium sampling, and those computed over the first 1ns of the equilibration period, which corresponds to the local sampling around M** state. It is seen that the local αhelical pattern is broken for residue pairs 485–489, 486–490 and 487–491 which each loses a hydrogen bond to a varying degree. Some of these bonds are replaced, 485–490, or coexist, 484–489, with the π-helical i,i+5 hydrogen bonds, which is characteristic of a kink developing around residue 487. The hydrogen bond made by the oxygen of M486 is lost completely in M** state. In equilibrium sampling, the probability of i,i+5 bonds is neglible for the entire peptide, indicating that the kink or bent has population close to zero. We therefore conclude that the isolated RH fragment has an intrinsic preference to fold into the pre-recovery state M* only. The appearance of the post-recovery state M** is due to its interactions with other parts of the protein.
Relay loop enhances helicity in relay helix but does not create a kink
Next we constructed a model that contains relay loop in addition to relay helix, RH/RL. The conformation of the relay loop is different in crystallographic M* and M** conformations up to residue S510, after which a similar α-helix appears in both states. To reflect the fact that the position of Cα in S510 is almost identical in aligned M* and M** conformations, with the mutual distance of less than 2Å, this atom is restrained in our simulations.
Figure 4 shows the secondary structure of the simulated model in comparison with the RH model from the preceding section. The α-helical content is increased more than three times in the C-terminal part of RH. Clustering analysis over residues 475–497 reveals only one structure which is identical to the experimentally determined helix of M* state. The population of that helix in our simulations is >70%.
Fig. 4.

α-helical content observed for the residues in the model that contains relay helix only, red line, and relay helix plus relay loop, black line. The relay loop is seen to enhance helicity in the C-terminal part of the relay helix.
Clustering over the entire length of the peptide reveals 4 most populated states with the RH helix intact, which differ in the packing of the relay loop, as shown in Figure 5. In the state with the highest population, 30%, the relay loop is rotated by 30 degrees around the relay helix axis relative to the experimental structure. A similar rotation is observed in two other structures, populated 13% and 9% respectively, while it is absent in the third structure, populated 10% of the time. Residue F487 is the location where the kink is seen. The side chain of this residue lies at the interface with SH1 helix in M** state and it is exposed to solvent in M* state. In a hypothetical M*-to-M** transition, it must pass under the relay loop from one side of RH to the other. Figure 5 shows that this task can be easily accomplished as the F487 side chain is significantly populated on both sides of the loop.
Fig. 5.

Most populated conformations observed in our simulations, yellow, in comparison with the experimental structure M*, orange. The relay loop is seen to fold up into a number of alternative conformations with populations ranging from 9% to 30%. The side chain of F487 is seen to occur on both sides of the loop.
As in the RH model, no detectable population of the M** helix with a kink is observed. The analysis of the i,i+5 hydrogen bonds, characteristic of that state, revealed a maximum of 3% population (data not shown). However, the states in which these bonds occur were non-helical.
Taken together, the data presented here indicate that the relay loop significantly enhances helicity of the C-terminal part of RH. The experimentally determined conformation in the helical part of the model is now overwhelmingly populated. The relay loop is seen to fold up into a number of alternative conformations, none of which is exactly the same as in the experimental structure. The multiplicity of these states indicates a significant frustration present in this part of the protein. As a consequence, small external perturbations may have a significant impact on the relay loop, making it very sensitive to interactions with other parts of the protein. These external interactions play a role in helping to rotate the relay loop in the most populated state observed in our simulations to make it consistent with the M* state. More importantly, these interactions are fully responsible for the appearance of the functionally important M** state.
Converter domain stabilizes M* state
Next, we studied the effect of the converter domain. To reduce the computational cost, only two fragments that lie at the interface with the relay helix and relay loop were considered (see “Methods” section). Distances among Cα atoms in these fragments were restrained appropriately to maintain the structure of the resulting motif intact. The motif as a whole was free to move in the simulations, except for by more than 9Å away from the relay helix, which would represent dissociation. The resulting model, RH/RL/CD, contains relay helix, relay loop and converter domain.
Secondary structure analysis of this model reveals that the converter domain further stabilizes the relay helix, increasing the population in the C-terminal part to more than 95%. The experimental M* helix is seen more than 90% of the time, based on 1.7Å Cα RMSD cutoff. The folding of the relay loop is similar to that seen in the RH/RL model. A number of alternative conformations are observed, varying in their packing against the relay helix. The most common of these is shown in Figure 6 with the equivalent structure for the most populated RH/RL model. Other than in population, 54% in the present model vs. 30% in the RH/RL model, the two structures differ little. The relay loop is still incorrectly rotated by ~30 degrees relative to the crystallographic M* state. The converter domain attached to the relay loop also exhibits excessive rotation, as seen in Figure 6.
Fig. 6.

Most populated structures observed in our simulations for RH/RL/CD, yellow, and RH/RL, green, models, in comparison with the experimental M* fragment, orange. The relay helix is identical in all three structures. The relay loop and the converter domain adopt a different conformation than in the crystal structure.
Negligible amounts of M** conformations of the relay helix were observed in this model. Clustering revealed configurations with a kink at position 487 and hydrogen-bond pattern identical to the experimental structure but its population is very low, less than 1%. This leads us to conclude that alone, the converter domain does not promote M**-like states of the relay helix.
SH1 helix is necessary but not sufficient to stabilize M** state
Next we tested whether interactions with SH1 helix might be responsible for the appearance of M** conformation. As Figure 2 explains, this fragment is in direct contact with both relay helix and relay loop but its position with respect to the relay helix changes upon M*-to-M** transition. Accordingly, we consider two models, RH/RL/SH1* and RH/RL/SH1**, in which SH1 motif is constrained to its position in M* and M** states.
Simulations of RH/RL/SH1* model reveal similarities with the RH/RL model lacking SH1 segment. The RH segment occupies mostly α-helical states accounting to 60% of the total. This is slightly lower than 70% seen in RH/RL model, indicating that SH1 marginally destabilizes the relay helix. The most pronounced difference between the two models is in the packing of the relay loop. Driven by interactions with SH1, the relay loop now develops orientations similar to that seen in experimental M* structure, as shown in Figure 7(a). The biggest impact of SH1 is on the relay loop while its effect on the relay helix is minimal.
Fig. 7.

Most populated structures observed in our simulations of RH/RL/SH1 models. A) RH/RL/SH1* model shown in yellow, in comparison with the experimental M* fragment, orange. Good agreement between experiment and theory is seen. B) RH/RL/SH1** model in comparison with M** state. The most populated structure is dominated by interactions between charged residues K690, E490, E493 and K498, which is inconsistent with the crystallographic M** state.
Quite a different conclusion is reached in RH/RL/SH1** simulations, where SH1 fragment is shifted upward along the relay helix by 4Å and slightly tilted. Figure 7(b) shows that the most populated structure obtained in these simulations is non-helical in the C-terminal part of the relay helix, stabilized by prominent salt bridges between charged amino acids K690, E490, E493 and K498. Since the latter 3 residues are responsible for holding together the relay helix and converter domain in the experimental M* and M** conformations, their interactions with K690 from SH1 helix are inconsistent with experiment. Comparison of the two panels in Figure 7 shows that the location of SH1 helix has a strong effect on the relay helix. Positioned as in M** conformation, SH1 begins to interfere with the formation of a stable interface between the relay helix and the converter domain. As a consequence, no folding into M** state is seen. This leads us to suggest that the post-recovery conformation M** is not stable without the converter domain. This conclusion is consistent with the recent cross-linking studies 24 showing that the interface between converter domain and the relay helix remains intact during the recovery stroke transition.
Both RH/RL/SH1* and RH/RL/SH1** simulations show that SH1 helix is able to noticeably alter conformations populated by the relay helix. The effect is much stronger in M** structure, where SH1 packs directly against the C-terminal part of the relay helix. Enabling a major conformational shift, SH1 helix is necessary for the appearance of M** conformations in the relay helix fragment. But it is not sufficient, however, as Figure 7(b) illustrates. To prevent the emergence of alternative conformations, it must act in concert with other fragments to stabilize the post-recovery conformation M**.
Both converter domain and SH1 are necessary to popuplate post-recovery state M**
To test whether a combination of converter domain and SH1 helix can produce the needed stabilization effect we constructed a model where all four elements considered so far, RH, RL, CD and SH1, are included. This model, RH/RL/CD/SH1, mimics folding of the relay helix and converter domain attached to it in the presence of SH1 helix at a particular location. As in the preceding section, two simulations corresponding to different positions of SH1 helix, RH/RL/CD/SH1* and RH/RL/CD/SH1**, were conducted.
In the M*-type simulations, the relay helix segment was seen to populate straight α-helical conformations 78% of the time, which is similar to all other models. In another 9%, the segment occupied helical conformations with a small distortion near the C-terminal end. Third most populated cluster consisted of helical conformations with a kink at F487 location as in crystallographic M** state. All three clusters are shown in Figure 8. The first two exhibit a rotation of the converter domain as in experimental pre-recovery state M*. The rotation of the third cluster is similar to M** state, leading us to interpret it as computational post-recovery step conformation (which is slightly different from the crystallographic one). The population of 4% of this conformation is low but statistically significant, providing direct evidence that the M*-to-M** transition was observed in our simulations.
Fig. 8.

Three dominant conformations, according to the structure of their relay helix, observed in RH/RL/CD/SH1* simulations. Corresponding populations are shown above each structure. Two most populated clusters have the converter domain rotated similarly to the crystallographic M* state. In the third cluster, the rotation is similar to M** state. Experimental M* structure is shown in orange. The simulations demonstrate direct M*-to-M** transition.
The reverse transition, M**-to-M*, was seen in our simulations of RH/RL/CD/SH1** model. Clustering according to the relay-helix reveals four most populated families of structures, shown in Figure 9. The most populated structure is an immediate analog of the experimental M** conformation with identical conformations of different motifs and their packing. The next two highest populated structures differ in the conformation of their RH segments but both exhibit a kink at F487. All three clusters have the converter domain oriented similarly to the crystallographic M** structure. The fourth cluster is only 1% populated and it has the converter domain rotated as in M* state. Similarly, the relay helix segment also populates a distorted but α-helical conformation, according to backbone hydrogen bond pattern. We therefore interpret the fourth cluster as a computational equivalent of M* state, with the implication that our simulations were able to produce the M**-to-M* transition.
Fig. 9.

Same as Figure 8 but for RH/RL/CD/SH1** simulations. Four dominant conformations are shown along with their populations. Three most populated clusters have the converter domain rotated similarly to the crystallographic M** state. In the fourth cluster, the rotation is similar to M* state. The simulations demonstrate spontaneous M**-to-M* transition.
The post-recovery conformation M** is seen in varying proportions in both RH/RL/CD/SH1* and RH/RL/CD/SH1** simulations while it is lacking in the models without SH1 helix, which populate mostly M* state. This leads us to conclude that the interactions involving SH1 are critical for the recovery stroke transition M*-to-M**. When positioned as in crystallographic M* conformation, SH1 does not affect the structure of RH/RL assembly to any significant degree, leaving it predominantly in M* state with population greater than 70%. A shift in the position upwards, as in M** state, leads to a shift in the population toward predominantly M** state, populated more than 70%. The effect of SH1 helix is therefore statistical, through modulation of the relative population of the two states.
SH1 acts by direct interactions with the relay helix
In light of the fact that SH1 is required for M** conformation, it is interesting to find out the mechanism by which it acts. Here two scenarios are possible. First, converter domain, linked by covalent bonds with SH1, is locked into M** state permanently by steric repulsion. This model is consistent with the proposal that the piston-like movement of SH1 rotates the converter domain which in turn creates a kink in the relay helix18. The effect of SH1 on relay helix is through the converter domain. Second possibility is that SH1 affects conformations of the relay helix directly through close interactions with it. The relay helix responds to these interactions by changing its conformation and rotating the converter domain in the process. The two scenarios differ in the sequence of events that lead to the rotation of the converter domain. Our simulations discussed so far show that SH1 may affect RH in the absence of converter domain and thus favor the second scenario. To back it up with more direct evidence, we designed a modified RH/RL/CD/SH1** model, RH/RL/CD/SH1m, in which residue G691 linking SH1 helix and the converter domain was deleted. Without the chemical bond holding it in place, the converter domain is free to assume any rotation compatible with the structure of the relay helix. Clustering of the conformations sampled in the simulations of this model revealed that M** is still the most prominent conformation, with the 73% population identical to that observed for RH/RL/CD/SH1** model. The chemical bond therefore has no effect on the structure of the relay helix. Computational and experimental structures, shown in Figure 10, agree very well in all aspects, including the rotation of the converter domain.
Fig. 10.

Most populated structure observed in our simulations of RH/RL/CD/SH1m model, yellow, in comparison with the experimental M** fragment, orange. White lines indicate the dihedral angle Θ used to characterize the rotation of the converter domain.
Position of SH1 determines the rotation of the converter domain
To quantify rotational states available to the converter domain we introduce dihedral angle Θ formed by Cα of residues K477, Q479, T742 and A748, which is sufficiently different in crystallographic M** and M* conformations, −34 and 60 degrees respectively, to serve as an order parameter for these two states. The angle Θ is strongly correlated with the conformation of the relay helix. Figure 11 displays free energy maps defined as a function of Θ and RMSD from the experimental M* state over Cα atoms of the relay helix obtained in the simulations of RH/RL/CD/SH1* and RH/RL/CD/SH1** models. Except for fluctuations, conformations with straight RH, RMSD<0.1nm, are seen to have the rotation angle Θ~50 degrees. Similarly, deformed relay helix, RMSD > 0.15nm, has rotations around −30 degrees. The two-state nature of the conformational space is clearly seen in both simulations, suggesting that both RMSD and the dihedral angle can be used to distinguish between M* and M** states.
Fig. 11.

Free energy map (shown in units of kT, where k is the Boltzmann’s constant) as a function of the dihedral angle Θ and RMSD from the experimental M* structure over Cα atoms of the relay helix fragment obtained in the simulations of a) RH/RL/CD/SH1* model and b) RH/RL/CD/SH1** model. The location of experimental M* and M** states is highlighted. Strong correlation between RMSD and Θ is seen.
The dihedral angle is more informative in that it is directly related to the size of the myosin step along actin filament. Figure 12 displays the distributions of Θ obtained in our simulations of all models containing converter domain. Models RH/RL/CD/SH1 show distributions centered on the values observed in their initial M* and M** structures, demonstrating that the position of SH1 helix controls the rotation of the converter domain. The distribution of RH/RL/CD model lacking SH1 is centered on an average value of 106 degrees. This represents a 40-degree shift upward from the experimental M* value, showing that the rotation angle, and the associated size of the myosin step, are very sensitive to SH1.
Fig. 12.

Distribution function of the dihedral angle between residues K477, Q479, T742 and A748 obtained in this work for different computational models. Solid black lines indicate the angles of the crystallographic M* and M** states. Deletion of the chemical bond in RH/RL/CD/SH1m model imparts additional rotational freedom to the converter domain. The main conformation, however, remains M**-like.
In addition to the main maxima, the distributions in Figure 12 exhibit broad tails that extend in the direction opposite to the value in the initial structure. In RH/RL/CD/SH1** simulations started from M** the initial Θ is −34 but the resulting distribution acquires an additional maximum at Θ=55, which corresponds to M* state. Similar trend is seen in RH/RL/CD/SH1* simulations started from M* structure. The broadening of the distributions is a direct evidence of the reversible M*-to-M** and M**-to-M* transitions occurring in RH/RL/CD/SH1 models, which were established in a preceding section based on clustering analysis.
Finally, chemical unlinking from SH1 increases rotational freedom in the converter domain. This is evident by comparing distributions for RH/RL/CD/SH1** and RH/RL/CD/SH1m models, where the latter shows a much broader tail. The role of the chemical bond therefore is to shift population toward M* state. However, this effect is not large and far less prominent than the impact of SH1 helix.
Conclusions
By conducting an exhaustive combinatorial search we were able to identify a minimal computational model capable of reproducing an equivalent of the recovery stroke transition, M*-to-M**, as seen in experimental studies of myosin motor protein. Among four required components of the model, relay helix, relay loop, Src homology 1 domain (SH1) helix and converter domain, the SH1 helix plays a critical role in the transition. The pre-recovery conformation M* is populated only when this helix is a) absent and b) shifted toward the N-terminal region of the relay helix. A displacement of SH1 upward along the relay helix is seen together with a transition into the M** state. The position of SH1 is thus strongly coupled to the conformation of the relay helix and the rotation of the converter domain attached to it.
The observation of the coupling allows us to hypothesize about the mechanism of the recovery stroke. We note that a correlation between SH1 and the converter domain does not necessarily imply a causative link between them. Here, one can envision three scenarios by which the signal from the active site, where the closing of switch II triggers the recovery stroke14–16, is propagated to the force-generating region. First, the signal travels directly to the relay helix through its amino terminal that interacts with the switch II loop. The relay helix then develops a kink that is translated into a rotation of the converter domain. Lastly, the SH1 helix becomes displaced to accommodate the rotation. Second, it is possible that the information about the switch II closing is transmitted to the converter domain and SH1 simultaneously by some other pathways that do not involve either of these elements. In this case, the displacement of SH1 and the rotation of the converter domain would occur at the same time but would actually be unrelated to one another. And third, the information to the converter domain is passed by the way of SH1. The displacement of SH1 occurs first in this case and is followed by the conformational transition of the relay helix and the rotation of the converter domain.
Communication pathways between the active site and the converter domain play a key role in determining the actual mechanism of the recovery stroke. A large number of mutational studies designed to map out the role of different parts of myosin21,25–28, crystallographic studies29 and primary sequence conservation analyses30 all indicate that the main communication channel passes through SH1, in support of the third scenario described above. The present work reveals the mechanism by which SH1 acts in this hypothetical scenario: we observe that the direct interactions with the C-terminal part of the relay helix composed of residues 487–496 are the main reason why the kink develops. Our simulations on isolated relay helix fragment show that that part of the helix is not strongly structured, with α-helical conformations numbering less than 20% of the total. As a consequence, folding of the C-terminal part is very context-dependent and easily influenced by its environment. This is confirmed in simulations of relay helix and relay loop taken together, where the relay loop attached to the C-terminus is able to increase the helical population to more than 80%. It is reasonable to expect that other parts of the protein interacting with the C-terminal helix have a similar impact. These include the converter domain, which further stabilizes the helix to a greater than 90% population, and the SH1 helix whose effect is more subtle. Packing against SH1 causes the C-terminal part of the relay helix to rotate with respect to the N-terminal part by developing a kink at position F487. This rotation is relayed to the converter domain attached to the C-terminal part resulting in an M*-to-M** transition. It is important to emphasize that the relay helix rotates the converter domain in the proposed mechanism and not vice versa as suggested by Fischer et al18 in their model relying on the piston-like movement of SH1 helix.
Finally, our simulations suggest that the position of SH1 helix modulates the conformation of the relay helix and thereby affects the rotation of the converter domain. What is not clear from our study is how the switch II located more than 40Å away at the ATPase site communicates with SH1. One possibility here is that SH1 is displaced by a mechanical force. Another scenario is that the state of switch II influences the mobility of SH1 helix, thus affecting the total entropy of the protein and shifting the balance between M* and M** in this way. What exactly happens can be studied by using the same combinatorial search strategy as employed in this work but focusing on models that contain both the active site and SH1 helix.
Methods and models
Combinatorial approach to designing a model that captures reversible M*-to-M** transition
To design a minimal model that captures conformational changes in relay helix during the recovery stroke we follow the procedure explained in Figure 13. Assume that one is interested in a multi-domain protein composed of domains A, B, C and D, and that domain A is able to occupy two alternative conformations: State 1 and State 2. Folding into these conformations is driven by the interactions among all residues present in the protein. Some of these interactions, however, may be more important for the folding than others. To facilitate the search for the important ones, let us divide all interactions into a) local contacts, the ones occurring within domain A, and b) global contacts, the ones between domain A and other domains. Depending on the type of the protein concerned, two scenarios for the behavior of domain A are possible. First, State 1 and State 2 are determined by local interactions alone. In that case, fragment corresponding to domain A isolated from the remainder of the protein should exhibit unaided folding into these two states. All other domains are then functionally unimportant. Second, if local interactions are unable to fold the fragment correctly, the critical interactions occur between domain A and some other domain(s) of the protein and have to be located by a combinatorial search. Different combinations of domains have to be considered in a systematic way and their folding examined. We assume here that A is the only domain that can change conformations while all others remain unchanged. The first step in this process is to consider pairs of domains A–B, A–C and A–D, as shown in Figure 13. If none of these exhibit the desired folding then the search has to be extended to triples of domains and continued until the desired properties are observed. If applied properly, this procedure should establish the critical interactions for the domain of interest. It should also determine the minimal combination of domains that exhibits the desired transition.
Fig. 13.

An illustration of how the minimal model that captures two alternative conformational states in a fragment of a protein is built. In a multi-domain protein, the conformations of the domain of interest A are determined by a) intra-domain interactions and b) interactions with other domains. By considering different combinations of domains one can establish the interactions responsible for the concerned transition.
Computational details
All peptides in this work were modeled at the all-atom level using OPLS/AA31 force field and TIP3P model32 of water. Six different models were designed, as summarized in Table 1. Initial coordinates were downloaded from PDB data bank33 structures 1w9k for M* state and 1w9l for M** state and truncated according to the size of each model. All fragments that are not covalently linked were capped with neutralizing ACE and NH2 groups at N- and C-termini, to avoid interference from terminal charged groups. Coordinates of Cα atoms in the N-terminal residues N475-F482 were constrained to their initial positions in all 6 models. Additionally, the side chains of F481-F482 are identical in M* and M** conformations so they were also constrained in the simulations. Other constraints specific to each model are listed in Table 1. Complete input files for each model, including constraints, are available from the author upon request.
Table 1.
Summary of computational models employed in this work.
| Model | Description | Sequence | Constraints |
|---|---|---|---|
| RH | Relay helix | Ace-NEKLQQFFNHHMFKLEQEEYLKE-NH2 | No additional constraints |
| RH/RL | Relay helix and relay loop | Ace-”RH”-KINWTFIDFGLDS-NH2 | Residue S510 is restrained to its initial position |
| RH/RL/CD | Relay helix, relay loop and converter domain | Ace-”RH/RL”-NH2, Ace-GFPNRII-NH2, Ace-EQYRFGITKIFFRA-NH2 | Same as in RH/RL. Additionally, the converter domain is constrained to its initial configuration by distance restraints |
| RH/RL/SH1* RH/RL/SH1** | Relay helix, relay loop stacked against SH1 helix | Ace-”RH/RL”-NH2, Ace-NGVLEGIRITRKG-NH2 | Same as in RH/RL. Additionally, Cα atoms of SH1 are constrained to their initial positions. Two positions corresponding to crystallographic M* and M** are considered. |
| RH/RL/CD/SH1* RH/RL/CD/SH1** | Relay helix, relay loop, SH1 helix and converter domain | Ace-”RH/RL”-Ace-NGVLEGIRITRKGFPNRII-NH2, Ace-EQYRFGITKIFFRA-NH2 | Same as RH/RL. Converter domain constrained to its initial conformation. SH1 helix is constrained to its initial position. |
| RH/RL/CD/SH1m | Same as RH/RL/CD/SH1** but converter domain is not chemically attached to SH1 helix | Ace-”RH/RL”-Ace-NGVLEGIRITRK-NH2, Ace-FPNRII-NH2, Ace-EQYRFGITKIFFRA-NH2 | Same as in RH/RL/CD/SH1** |
All simulations reported in this work were performed using GROMACS34 software set. The chemical bonds in water molecules were held constant by the SETTLE35 algorithm. The bonds involving hydrogen atoms in the protein were constrained according to the LINCS36 algorithm. Crystallographic structures for each model were placed in cubic boxes of 5.2–6.1nm across, depending on the model, containing 4000–8000 water molecules, and equilibrated with the heavy atoms constrained to their initial positions. All models were simulated by the replica-exchange algorithm37 using Nose-Hoover thermostat38 with a 0.5ps time constant to maintain constant temperature. A total of 60 replicas were considered, spaced equidistantly in inverse temperature between end-points of 300 and 550K. All data were analyzed at T=300K. A single cut-off of 1nm was used for the van der Waals interactions, with the neighbor lists updated every 10 time steps. Smooth-particle mesh Ewald (PME) method39 was used to treat electrostatic interactions. The time step was set at 2fs in all simulations. To make sure that we report converged results, all models, where appropriate, were simulated using two starting coordinates M* and M**. Convergence time was determined from time points where the two trajectories begin to show qualitative agreement. This procedure resulted in 10ns of equilibration time for all models. Productive parts of the simulations lasted for 20ns.
All recorded conformations were grouped into clusters according to the algorithm of Daura et al40 using the root mean square deviations among Cα atoms as a measure of structural similarity. A cutoff of 0.2nm was used to distinguish between similar and dissimilar structures. The clustering was performed for the relay helix region, residues 475–497, in all models and over the entire length of the peptide in the RH/RL model.
Supplementary Material
Acknowledgments
We gratefully acknowledge the support of the National Institutes of Health, grant R01GM083600-04. The computational time was allocated at UNC Charlotte Cobra cluster supported by NIH grant 1S10RR026514-01. We would like to thank Yuri Nesmelov and Charles Herring for their comments on the early version of the manuscript.
References
- 1.Lymn RW, Taylor EW. Mechanism of Adenosine Triphosphate Hydrolysis by Actomyosin. Biochemistry. 1971;10(25):4617–4624. doi: 10.1021/bi00801a004. [DOI] [PubMed] [Google Scholar]
- 2.Malnasi-Csizmadia A, Pearson DS, Kovacs M, Woolley RJ, Geeves MA, Bagshaw CR. Kinetic resolution of a conformational transition and the ATP hydrolysis step using relaxation methods with a Dictyostelium myosin II mutant containing a single tryptophan residue. Biochemistry. 2001;40(42):12727–12737. doi: 10.1021/bi010963q. [DOI] [PubMed] [Google Scholar]
- 3.Agafonov RV, Nesmelov YE, Titus MA, Thomas DD. Muscle and nonmuscle myosins probed by a spin label at equivalent sites in the force-generating domain. P Natl Acad Sci USA. 2008;105(36):13397–13402. doi: 10.1073/pnas.0801342105. [DOI] [PMC free article] [PubMed] [Google Scholar]
- 4.Woo HJ. Exploration of the conformational space of myosin recovery stroke via molecular dynamics. Biophysical Chemistry. 2007;125(1):127–137. doi: 10.1016/j.bpc.2006.07.001. [DOI] [PubMed] [Google Scholar]
- 5.Tekpinar M, Zheng WJ. Predicting order of conformational changes during protein conformational transitions using an interpolated elastic network model. Proteins-Structure Function and Bioinformatics. 2010;78(11):2469–2481. doi: 10.1002/prot.22755. [DOI] [PubMed] [Google Scholar]
- 6.Taylor WR, Katsimitsoulia Z. A coarse-grained molecular model for actin-myosin simulation. J Mol Graph. 2010;29(2):266–279. doi: 10.1016/j.jmgm.2010.06.004. [DOI] [PubMed] [Google Scholar]
- 7.Takagi F, Kikuchi M. Structural change and nucleotide dissociation of myosin motor domain: Dual G(o)over-bar model simulation. Biophys J. 2007;93(11):3820–3827. doi: 10.1529/biophysj.106.103796. [DOI] [PMC free article] [PubMed] [Google Scholar]
- 8.Cecchini M, Alexeev Y, Karplus M. Pi Release from Myosin: A Simulation Analysis of Possible Pathways. Structure. 2010;18(4):458–470. doi: 10.1016/j.str.2010.01.014. [DOI] [PMC free article] [PubMed] [Google Scholar]
- 9.Cecchini M, Houdusse A, Karplus M. Allosteric Communication in Myosin V: From Small Conformational Changes to Large Directed Movements. Plos Comput Biol. 2008;4(8) doi: 10.1371/journal.pcbi.1000129. [DOI] [PMC free article] [PubMed] [Google Scholar]
- 10.Ovchinnikov V, Trout BL, Karplus M. Mechanical Coupling in Myosin V: A Simulation Study. Journal of Molecular Biology. 2010;395(4):815–833. doi: 10.1016/j.jmb.2009.10.029. [DOI] [PMC free article] [PubMed] [Google Scholar]
- 11.Zheng W. Multiscale modeling of structural dynamics underlying force generation and product release in actomyosin complex. Proteins: Structure, Function, and Bioinformatics. 2010;78(3):638–660. doi: 10.1002/prot.22594. [DOI] [PubMed] [Google Scholar]
- 12.Tehver R, Thirumalai D. Rigor to Post-Rigor Transition in Myosin V: Link between the Dynamics and the Supporting Architecture. Structure. 2010;18(4):471–481. doi: 10.1016/j.str.2010.01.019. [DOI] [PubMed] [Google Scholar]
- 13.Sweeney HL, Houdusse A. Structural and Functional Insights into the Myosin Motor Mechanism. Annu Rev Biophys. 2010;39:539–557. doi: 10.1146/annurev.biophys.050708.133751. [DOI] [PubMed] [Google Scholar]
- 14.Baumketner A, Nesmelov YE. Early stages of the recovery stroke in Dictyostelium discoideum myosin II studied by molecular dynamics simulations. Protein Science. 2011;20:2013–2022. doi: 10.1002/pro.737. [DOI] [PMC free article] [PubMed] [Google Scholar]
- 15.Fischer S, Windshugel B, Horak D, Holmes KC, Smith JC. Structural mechanism of the recovery stroke in the myosin molecular motor. P Natl Acad Sci USA. 2005;102(19):6873–6878. doi: 10.1073/pnas.0408784102. [DOI] [PMC free article] [PubMed] [Google Scholar]
- 16.Elber R, West A. Atomically detailed simulation of the recovery stroke in myosin by Milestoning. P Natl Acad Sci USA. 2010;107(11):5001–5005. doi: 10.1073/pnas.0909636107. [DOI] [PMC free article] [PubMed] [Google Scholar]
- 17.Mesentean S, Koppole S, Smith JC, Fischer S. The principal motions involved in the coupling mechanism of the recovery stroke of the myosin motor. Journal of Molecular Biology. 2007;367(2):591–602. doi: 10.1016/j.jmb.2006.12.058. [DOI] [PubMed] [Google Scholar]
- 18.Koppole S, Smith JC, Fischer S. The structural coupling between ATPase activation and recovery stroke in the myosin II motor. Structure. 2007;15(7):825–837. doi: 10.1016/j.str.2007.06.008. [DOI] [PubMed] [Google Scholar]
- 19.Yu HB, Ma L, Yang Y, Cui Q. Mechanochemical coupling in the myosin motor domain. I. Insights from equilibrium active-site simulations. Plos Comput Biol. 2007;3(2):199–213. doi: 10.1371/journal.pcbi.0030021. [DOI] [PMC free article] [PubMed] [Google Scholar]
- 20.Harris MJ, Woo HJ. Energetics of subdomain movements and fluorescence probe solvation environment change in ATP-bound myosin. Eur Biophys J Biophy. 2008;38(1):1–12. doi: 10.1007/s00249-008-0347-3. [DOI] [PubMed] [Google Scholar]
- 21.Ruppel KM, Spudich JA. Structure-function analysis of the motor domain of myosin. Annu Rev Cell Dev Bi. 1996;12:543–573. doi: 10.1146/annurev.cellbio.12.1.543. [DOI] [PubMed] [Google Scholar]
- 22.Kabsch W, Sander C. Dictionary of Protein Secondary Structure - Pattern-Recognition of Hydrogen-Bonded and Geometrical Features. Biopolymers. 1983;22(12):2577–2637. doi: 10.1002/bip.360221211. [DOI] [PubMed] [Google Scholar]
- 23.Baumketner A, Shea JE. Folding landscapes of the Alzheimer Aβ12–28 peptide. J Mol Biol. 2006;362:567–579. doi: 10.1016/j.jmb.2006.07.032. [DOI] [PubMed] [Google Scholar]
- 24.Shih WM, Spudich JA. The myosin relay helix to converter interface remains intact throughout the actomyosin ATPase cycle. J Biol Chem. 2001;276(22):19491–19494. doi: 10.1074/jbc.M010887200. [DOI] [PubMed] [Google Scholar]
- 25.Patterson B, Spudich JA. Cold-sensitive mutations of Dictyostelium myosin heavy chain highlight functional domains of the myosin motor. Genetics. 1996;143(2):801–810. doi: 10.1093/genetics/143.2.801. [DOI] [PMC free article] [PubMed] [Google Scholar]
- 26.Ohki T, Mikhailenko SV, Morales MF, Onishi H, Mochizuki N. Transmission of force and displacement within the myosin molecule. Biochemistry. 2004;43(43):13707–13714. doi: 10.1021/bi048954f. [DOI] [PubMed] [Google Scholar]
- 27.Tsiavaliaris G, Fujita-Becker S, Batra R, Levitsky DI, Kull FJ, Geeves MA, Manstein DJ. Mutations in the relay loop region result in dominant-negative inhibition of myosin II function in Dictyostelium. EMBO Rep. 2002;3:1099–1105. doi: 10.1093/embo-reports/kvf214. [DOI] [PMC free article] [PubMed] [Google Scholar]
- 28.Seidman JG. NHLBI Program for Genomic Applications. Vol. 2011 Harvard Medical School; Genomics of Cardiovascular Development, Adaptation, and Remodeling. [Google Scholar]
- 29.Rayment I, Rypniewski WR, Schmidtbase K, Smith R, Tomchick DR, Benning MM, Winkelmann DA, Wesenberg G, Holden HM. 3-Dimensional Structure of Myosin Subfragment-1 - a Molecular Motor. Science. 1993;261(5117):50–58. doi: 10.1126/science.8316857. [DOI] [PubMed] [Google Scholar]
- 30.Weiss A, Schiaffino S, Leinwand LA. Comparative sequence analysis of the complete human sarcomeric myosin heavy chain family: Implications for functional diversity. Journal of Molecular Biology. 1999;290(1):61–75. doi: 10.1006/jmbi.1999.2865. [DOI] [PubMed] [Google Scholar]
- 31.Kaminski GA, Friesner RA, Tirado-Rives J, Jorgensen WL. Evaluation and Reparametrization of the OPLS-AA Force Field for Proteins via Comparison with Accurate Quantum Chemical Calculations on Peptides. J Phys Chem B. 2001;105:6474–6487. [Google Scholar]
- 32.Jorgensen WL, Chandrasekhar J, Madura JD, Impey RW, Klein ML. Comparison of simple potential functions for simulating liquid water. J Chem Phys. 1983;79:926–935. [Google Scholar]
- 33.Bernstein FC, Koetzle TF, Williams GJB, Meyer EF, Brice MD, Rodgers JR, Kennard O, Shimanouchi T, Tasumi M. Protein Data Bank - Computer-Based Archival File for Macromolecular Structures. Journal of Molecular Biology. 1977;112(3):535–542. doi: 10.1016/s0022-2836(77)80200-3. [DOI] [PubMed] [Google Scholar]
- 34.Van der Spoel D, Lindahl E, Hess B, Groenhof G, Mark AE, Berendsen HJC. GROMACS: Fast, flexible, and free. J Comput Chem. 2005;26(16):1701–1718. doi: 10.1002/jcc.20291. [DOI] [PubMed] [Google Scholar]
- 35.Miyamoto S, Kollman PA. SETTLE - An analytical version of the shake and rattle algorithm for rigid water models. J Comput Chem. 1992;13(8):952–962. [Google Scholar]
- 36.Hess B, Bekker H, Berendsen HJC, Fraaije J. LINCS: A linear constraint solver for molecular simulations. J Comput Chem. 1997;18(12):1463–1472. [Google Scholar]
- 37.Sugita Y, Okamoto Y. Replica-exchange molecular dynamics method for protein folding. Chem Phys Lett. 1999;314:141–151. [Google Scholar]
- 38.Nose S. Constant Temperature Molecular-Dynamics Methods. Prog Theor Phys Supp. 1991;(103):1–46. [Google Scholar]
- 39.Essmann U, Perera L, Berkowitz ML, Darden T, Lee H, Pedersen LG. A smooth particle mesh ewald method. Journal of Chemical Physics. 1995;103(19):8577–8593. [Google Scholar]
- 40.Daura X, Gademann K, Jaun B, Seebach D, van Gunsteren WF, Mark AE. Peptide folding: When simulation meets experiment. Angew Chem-Int Edit. 1999;38(1–2):236–240. [Google Scholar]
- 41.Schrodinger, LLC. The PyMOL Molecular Graphics System, Version 1.3r1. 2010. [Google Scholar]
Associated Data
This section collects any data citations, data availability statements, or supplementary materials included in this article.