

Abstract
Our objectives were to determine cartilage contact stress during walking, stair climbing and descending stairs in a well-defined group of normal volunteers and to assess variations in contact stress and area among subjects and across loading scenarios. Ten volunteers without history of hip pain or disease with normal lateral center-edge angle and acetabular index were selected. Computed tomography imaging with contrast was performed on one hip. Bone and cartilage surfaces were segmented from volumetric image data, and subject-specific finite element models were constructed and analyzed using a validated protocol. Acetabular contact stress and area were determined for seven activities. Peak stress ranged from 7.52±2.11 MPa for heel-strike during walking (233% BW) to 8.66±3.01 MPa for heel-strike during descending stairs (261% BW). Average contact area across all activities was 34% of the surface area of the acetabular cartilage. The distribution of contact stress was highly non-uniform, and more variability occurred among subjects for a given activity than among activities for a single subject. The magnitude and area of contact stress were consistent between activities, although inter-activity shifts in contact pattern were found as the direction of loading changed. Relatively small incongruencies between the femoral and acetabular cartilage had a large effect on the contact stresses. These effects tended to persist across all simulated activities. These results demonstrate the diversity and trends in cartilage contact stress in healthy hips during activities of daily living and provide a basis for future comparisons between normal and pathologic hips.
Keywords: Hip, Finite Element, Biomechanics, Cartilage Contact Stresses, Cartilage Pressure
INTRODUCTION
Contact stresses in the human hip play an important role in maintaining joint health and pain-free ambulation. Abnormal contact stresses are thought to be a primary cause of hip osteoarthritis (OA).[1,2] While a number of factors contribute to the progression of OA, bony abnormalities such as dysplasia and femoroacetabular impingement (FAI) seem to accelerate the onset of the disease.[3–7]
Despite the importance of cartilage contact stresses to joint health, disagreement remains regarding the normal magnitudes and distributions of contact stress in the healthy hip. In vitro measurements of contact stress used pressure-sensitive film or piezo-resistive sensors,[8–10] but quantifying contact stress on the entire articulating surface is difficult with these techniques, and only a limited range of stresses can be measured. In vivo studies used instrumented prostheses to measure equivalent joint reaction forces.[11–14] These measurements only approximate the true cartilage stresses since one joint surface has been replaced with an implant. To date, no experimental methods are available to assess hip contact stresses on a subject-specific basis.
Computational methods provide the means to predict hip joint cartilage mechanics for individual subjects. Contact stresses have been predicted using both the discrete element analysis (DEA) technique[15,16] and the finite element (FE) method.[17–19] These studies reported proof-of-concept and results of parametric studies, but simplifying assumptions and a lack of validation limited their ability to provide definitive measurements of the magnitude and distribution of contact stresses in normal hips.
Reports on contact stresses have not incorporated clear exclusion criteria to define the “normal” hip. In the clinic, radiographic measurements are used to define geometric abnormalities or cartilage degradation, while a detailed patient history can rule out pre-existing pathologies. Our objectives were to determine cartilage contact stresses during walking, stair climbing, and descending stairs in a well-defined group of normal volunteers and to assess variations in contact stresses and areas among subjects and across loading scenarios. This was done by constructing and analyzing subject-specific FE models using a validated protocol.[20]
METHODS
Subject Selection and CT Imaging
Volunteers were recruited to match the age, weight, and body mass index (BMI) of patients with acetabular dysplasia commonly treated at our clinic. An institutional review board approved this study, and informed consent was received from 16 volunteers (7 female, 9 male) with no history of hip pain or disease.
One hip from each subject was selected randomly to receive a CT arthrogram. The hip capsule was injected with ~20 ml of a diluted contrast agent (2:1 lidocaine to OMNIPAQUE® 350, GE Healthcare Inc, Princeton, NJ) under fluoroscopic guidance. Multi-detector CT scans of the entire pelvis and both femurs were obtained within 10 mins of injection (120 kVp, 100–400 mAs, 512×512 matrix, 1.0 pitch, 300–400 mm FOV, 1.0 mm slice thickness) using a Siemens SOMATOM Definition CT Scanner. Joint traction was applied during the scan using a hare traction device to ensure that the contrast agent filled the joint space (Fig. 1a).
Figure 1.

FE model creation and simulated loading scenarios. (a) CT section through center of proximal femur with contrast agent between opposing acetabular and femoral cartilage. Segmentation lines follow the contour of the pelvis and femur bone morphology. (b)3D reconstruction of bone (off-white) and cartilage (blue). (c)Lateral view of the model at the acetabulum shows triangular shell and hexahedral elements representing bone and cartilage, respectively (d–j). Orientation of the femur and pelvis during simulated activities captured from an identical view of the yz-plane; displacements were centered in the joint and directed vertically. From left to right: WHS, WHM, WMD, WML, WLS, AHS, and DHS.
The CT images were read by a senior radiologist and an orthopaedic surgeon. The inclusion criteria required the hips to have a lateral center-edge angle between 25 and 40°,[21,22] acetabular index angle (acetabular inclination or Tonnis angle) between 0 and 10°,[23,24] qualitatively normal joint congruity, bone sphericity and cartilage morphology, and no signs of OA. CT images needed to show distribution of contrast sufficient to distinguish acetabular and femoral cartilage (Fig. 1a). Based on these criteria, 6 subjects were excluded. For the remaining 10 (5 female, 5 male), the lateral center-edge angle was 33.5±5.4° and acetabular index was 4.6±3.7°. Age, weight and BMI were 26±4 yrs, 70.0±13.9 kg and 23±3.8, respectively.
Surface Reconstruction, Mesh Generation, and Constitutive Models
Bone and cartilage surfaces were segmented from the CT image data using Amira software (5.3, Visage Imaging, San Diego, CA) and previously validated threshold settings [25–27]. CT images were up-sampled using a Lanczos filter kernel (1536×1536; 0.3 mm thickness) to improve the resolution of the segmentation mask (Fig. 1a). Additional up-sampling did not change FE predictions appreciably. Reconstructed surfaces were decimated to reduce the number of polygons and smoothed with a low pass filter to remove segmentation artifacts.
Surfaces were discretized using hexahedral and triangular shell elements (Fig. 1b,c). Hexahedral meshes were constructed for the cartilage layers using TrueGrid (XYZ Scientific, Livermore, CA). Cortical bone surfaces were discretized using shell elements. Mesh densities were determined from convergence studies.[20] Trabecular bone was not included, as it has little effect on contact stress predictions.[20] Tied and sliding contact algorithms based on the mortar method were used to define cartilage-to-bone and cartilage-to-cartilage interfaces, respectively.[28] Frictionless contact was assumed for the cartilage-to-cartilage interface, since the friction coefficient between cartilage surfaces is low (0.01–0.02).[29]
Cartilage was modeled as a homogeneous, isotropic, nearly incompressible, neo-Hookean hyperelastic material with shear modulus G = 13.6 MPa and bulk modulus K = 1,359 MPa (ν = 0.495).[20] Cortical bone was modeled as a homogeneous, isotropic material with elastic modulus E = 17 GPa and Poisson’s ratio ν = 0.29.[20]
Model Positioning, Boundary Condition,s and Loading
Rigid node sets were created at the sacroiliac and pubis symphysis joints. Motion was applied superiorly to the distal femur to load the femur/acetabulum contact interface. The femur was allowed to translate in the medial-lateral and AP directions as it was displaced superiorly to facilitate seating of the head in the acetabulum. To eliminate rigid body modes, motion along the medial-lateral and AP directions was resisted by four orthogonal linear springs (k = 1 N/m) placed at the distal femur.
Seven loading scenarios simulated activities of daily living (Fig. 1d–j). First, neutral pelvic and femoral positions were established using anatomical landmarks.[12] Next, the femur and pelvis were reoriented based on in vivo kinematic and kinetic hip joint data.[11] Five of the scenarios corresponded to time points during the gait cycle: the peak hip contact force following heel strike (WHS), the midpoint between heel strike and midstance (WHM), midstance (WMD), the midpoint between midstance and the late stance hip contact force peak (WML), and the late stance peak (WLS). Force peaks following heel strike were simulated for ascending (AHS) and descending stairs (DHS). A target hip contact force (HCF) for each activity was scaled to bodyweight (BW) according to Bergmann’s average subject – WHS (233% BW), WHM (215% BW), WMD (203% BW), WML (204% BW), WLS (205% BW), AHS (252% BW), and DHS (261% BW) (Suppl. Fig. 1). PreView was used for pre-processing,[30] NIKE3D (Lawrence Livermore Natl. Lab.; Livermore, CA) was used for all FE analyses, and PostView[31] was used to determine contact area and contact stresses for each subject and loading scenario.
Contact Areas and Stresses
Contact area was calculated on the articulating surface of the acetabular cartilage as an absolute value and as a percentage of the total surface area. Peak and average contact stresses within the contact area on the cartilage were calculated for all subjects and loading scenarios. Average values were mapped to a template mesh representing the acetabular cartilage. The radius and surface area of the mesh were chosen to match the mean values for the group of subjects.
Statistical Analysis
The acetabular cartilage was divided into anterior, superior, and posterior regions.[32] The nonparametric Kruskal-Wallis ANOVA was used to test for significant differences in mean pressure among regions for each activity, and for differences among activities for each region. Post-hoc comparisons were performed using the Dunn test. Significance was set at p≤0.05. Data are presented as mean ± SD unless noted.
RESULTS
Contact Stress Distribution and Contact Area
Contact stresses were highly non-uniform, with more variability in contact stress among subjects for a given activity than among activities for a single subject (Fig. 2). Quantitatively, the standard deviation of peak contact stresses for a single subject (across all activities) was usually <½ that of any activity (across all subjects). For example, the standard deviation for subject #2 (across all activities) was 0.55 MPa, whereas the standard deviation of peak contact stress for the walking heel-strike activity (across all subjects) was 2.11 MPa. Differences in bone and cartilage geometry strongly affected the variation in contact patterns and location of peak contact stresses among subjects. For example, the acetabulum of one subject exhibited a small cavity in the anteriosuperior roof of the acetabulum, causing a discontinuity in the contact stresses on the articular surface (Fig. 3). Despite the variability among subjects, differences in contact among activities roughly followed the change in direction of the resultant joint reaction force. As the loading direction changed from predominantly superior-posterior during ascending stairs to more superior during walking and superior-anterior during descending stairs, the contact locations moved similarly (Suppl. Fig. 2). Similar shifting was seen within stages of walking, although to a lesser extent (Suppl. Video 1).
Figure 2.

Contact stresses on the acetabular cartilage for each subject during walking, ascending stairs, and descending stairs. Left is anterior. Variations in stresses were greater among subjects (columns) than among loading scenarios (rows).
Figure 3.

CT image and model predictions of contact stress for one subject, illustrating effects of bony geometry. The small cavity located in the superior acetabular roof (arrow, top panel) created a depression that is identifiable in the model before (arrow, middle panel) and during loading (arrow, bottom panel). This resulted in an area of relatively low contact stress at the corresponding location of contact.
Although the contact location was different among activities, the average contact areas on the acetabular cartilage were similar during each activity. The total acetabular cartilage surface area averaged 1,936±295 mm2, while the average contact area across all activities was 657±43 mm2 (Fig. 4). No significant difference was found in absolute contact area (p=0.593) or percent contact area (p=0.486) among activities.
Figure 4.

Contact area on the articulating cartilage surface as a function of activity. Percentages represent the portion of the total articulating surface in contact.
Peak and Average Contact Stresses
The location of the peak stress tended to be similar for a particular subject across all activities (Fig. 2). The peak stresses increased slightly as the joint reaction force increased among activities. For instance, peak stress was 7.52±2.11 MPa for WHS (233% BW) and increased to 8.53±2.61 and 8.66±3.01 MPa for AHS (252% BW) and DHS (261% BW), respectively. Peak stresses for the other activities were 7.22±2.32, 7.16±2.62, 7.15±2.54, and 7.11±2.50 MPa for WHM, WMD, WML, and WLS, respectively.
Average contact stresses were ~1 MPa for all activities. Specifically, average contact stresses for WHS, WHM, WMD, WML, WLS, AHS, and DHS were 1.08±0.32, 0.99±0.27, 0.94±0.24, 0.94±0.23, 0.93±0.21, 1.18±0.27 and 1.23±0.32 MPa, respectively.
Regional Differences in Average Contact Stress
Significant differences occurred in the average contact stress among regions for most activities (Fig. 5). For instance, differences were detected between the superior and posterior regions during WHS (p=0.04). When the joint force was oriented more anteriorly during WHM, significant regional differences in contact stress occurred between the anterior and posterior regions (p=0.04) and between the superior and posterior regions (p=0.01). This trend continued through the remaining walking stages, including WLS (p=0.004 and p=0.006 for anterior versus posterior and superior versus posterior, respectively). No significant differences in contact stress were found among the different regions during AHS. However, contact stress in both the anterior and superior regions was significantly greater than those of the posterior region during DHS (p=0.004 and p=0.02, respectively).
Figure 5.

Average contact stress as a function of region and activity. Significant differences (shown with asterisk) occurred between at least two regions for every activity, except AHS.
For a given region, no significant differences in average stresses occurred among any of the walking scenarios, with the exception of the posterior region, which saw a significant increase in stresses between WHS and WLS (p=0.04).
DISCUSSION
Our objective was to quantify the magnitude and distribution of cartilage contact stress in a well-defined group of healthy hips using a validated modeling protocol. The major findings were that cartilage contact stress distribution varied considerably even among healthy subjects, but were consistent trends existed in the magnitude and area of contact stresses. Further, contact patterns changed significantly among loading activities. Despite the fact that subjects were selected using clinically-based criteria for normal, healthy hips, contact stress distribution was non-uniform in all cases, with greater variation among subjects than among loading scenarios (Fig. 2). This suggests that even in a healthy population, contact mechanics are unique to the individual. The variability in contact mechanics may be due to small differences in bone and cartilage morphology (Fig. 3), based on the fact that identical boundary and loading conditions were applied to each model, leaving geometry as the primary variable among subjects.
The non-uniform distribution of contact stress is supported by prior studies examining the effect of geometric assumptions on a computational model, as well as prior in vitro studies. A previous computational study investigated how contact stresses were altered when femoral and acetabular geometry were changed from subject-specific to an ideal sphere.[33] Models with ideal geometry had substantially reduced cartilage contact stresses and more uniform distributions of contact. Furthermore, for spherical models, the magnitude and distribution of contact stresses did not appreciably change among loading scenarios, in contrast to our results. Most computational studies that used subject-specific geometry presented only proof-of-concept results, wherein only a single model was developed.[17,34] One exception is a study that modeled contact pressures using asymptomatic hips of 5 patients with acetabular dysplasia and CT images from one cadaver.[35] Only contact distributions for the cadaver-based model were described in detail, and the distributions were more uniform than those in our study. The differences may be due to the fact that the CT images in the previous study were collected from hip joints that were already in contact. The added congruency due to initial contact, along with considerable smoothing during segmentation, may have resulted in more uniform contact during modeling. Still, the range of peak contact pressures (4.53 to 7.05 MPa) in asymptomatic hips of the previous study reached the lower end of those that we observed. Multiple in vitro experiments reported that cartilage contact stresses are irregular in the normal hip.[8,10,14,20,36–38] In a study of joint congruity, considerable variation was found in the magnitude and joint space width.[39] Likewise, another study found that incongruity strongly affected the distribution of contact and pressure, although no correlation was found between distribution of contact and subchondral bone density.[38] This suggests that, in agreement with our results, surface geometry is the major determinant of cartilage contact stress distribution and magnitude.
While substantial variation in the spatial distribution of contact stress occurred among subjects, peak and average contact stresses and contact areas were similar for each loading scenario. The peak contact stress averaged between 7 and 8 MPa for all activities, despite a 58% bodyweight difference in applied joint contact forces between the highest and lowest loading activities. These data suggest that although different hips distribute load differently, healthy joints distribute load in a way that maintains a fairly homeostatic maximum contact stress. Average contact stresses (~1 MPa) were considerably less than peak values, in agreement with other studies.[14,36] Direct comparison of values for contact stress with prior experimental studies is difficult because of differences in loading modalities and measurement techniques. At midstance (203% BW load, 1.1° flexion, 8.4° abduction, 6.7° internal rotation), we predicted a peak stress of 7.2 ± 2.6 MPa. This is in good agreement with values ranging from 6.7 to 8.8 MPa found in vitro with joints in similar orientations.[10,14,36] In fact, the range of peak contact stresses predicted in our study corroborates many published values.[8,38]
Though the orientation of the femur and pelvis were changed to represent different loading scenarios, contact areas were consistent at 32 to 37% of the articulating surface area. This suggests that despite variations in stress distribution, healthy hips maintain a similar percentage of the cartilage surface in contact during different activities. These inter-activity similarities may be explained by specific acetabular morphologies consistently being in contact with the femoral head. Two previous studies varied the orientation of the femur with respect to the acetabulum and found little effect on the contact stress pattern.[10,36] However, one study did report a general shift in loading as orientation changed, in agreement with our study.[36]
While considerable variation in the distribution of contact stress occurred among subjects, some patterns were evident. There was a shift in the spatial distribution of contact stress in correspondence with changing loading directions. The acetabular regions that experienced the highest load support depended on the particular loading scenario (Fig. 4). For example, the cartilage on the anterior acetabulum supported more load than the superior region during DHS, whereas the superior region supported more load than the anterior region during AHS. These patterns indicate significant shifts in load bearing throughout the joint during different activities.
Our study has several limitations that warrant discussion. First, cartilage was assumed to be isotropic, nearly incompressible, and hyperelastic. While cartilage is known to exhibit biphasic behavior, computational predictions of stress are equivalent for biphasic and incompressible hyperelastic material models during instantaneous loading.[40] Also, our constitutive assumptions are consistent with an experimentally validated protocol.[20] Furthermore, despite the material homogeneity, substantial differences were found in the predicted stress distributions among subjects, implying that the differences are due to the geometric variation in joint geometry. Second, the FE models did not include the labrum. The role of the labrum during load distribution has been debated.[41,42] A recent study found that the labrum supported <3% of the load across the joint in healthy subjects.[43] Since CT image data were segmented semi-automatically, there may be some observer-dependence in the resulting segmentations. The accuracy of the segmentation protocols was evaluated for both bone and cartilage and found to produce errors of <0.5 mm.[25,26] With respect to this amount of error and its effect on contact stresses, local changes in geometry are not likely to occur in a 0.5 mm distance along the articulating surface; errors in segmentation are consistent and vary smoothly on a given surface. Thus, subtle geometric differences suspected to cause individual contact stress magnitudes and distributions generally occur along the curvature of that surface over distances >0.5 mm. Finally, joint angles and contact forces used to drive the models were taken from the literature.[11] Using generic values for specific models may have one of two effects: application of generic angles and forces could cause more uniformity in contact stress among subjects, or it could exacerbate effects of individual geometry as the joints are loaded at what may not be optimal orientations to effectively redistribute contact forces. Nevertheless, boundary conditions were applied to circumvent this effect (i.e. femur was allowed to translate in axial plane to find path of least resistance).
The use of subject-specific geometry in a population of healthy individuals revealed considerable variation in distributions of contact stress and some similarities that can be expected in normal human hips. Our results can be used as a basis for comparing pathologic and healthy hips in the future.
Supplementary Material
Supplementary Material - S Figure 1. Left - Time points and orientation of the simulated activities based upon data from Bergmann et al. [12]. Right - Hip contact force time points simulated during walking: (a) heel strike (WHS), (b) heel-mid (WHM), (c) midstance (WMD), (d) mid-late (WML), and (e) late stance (WLS).
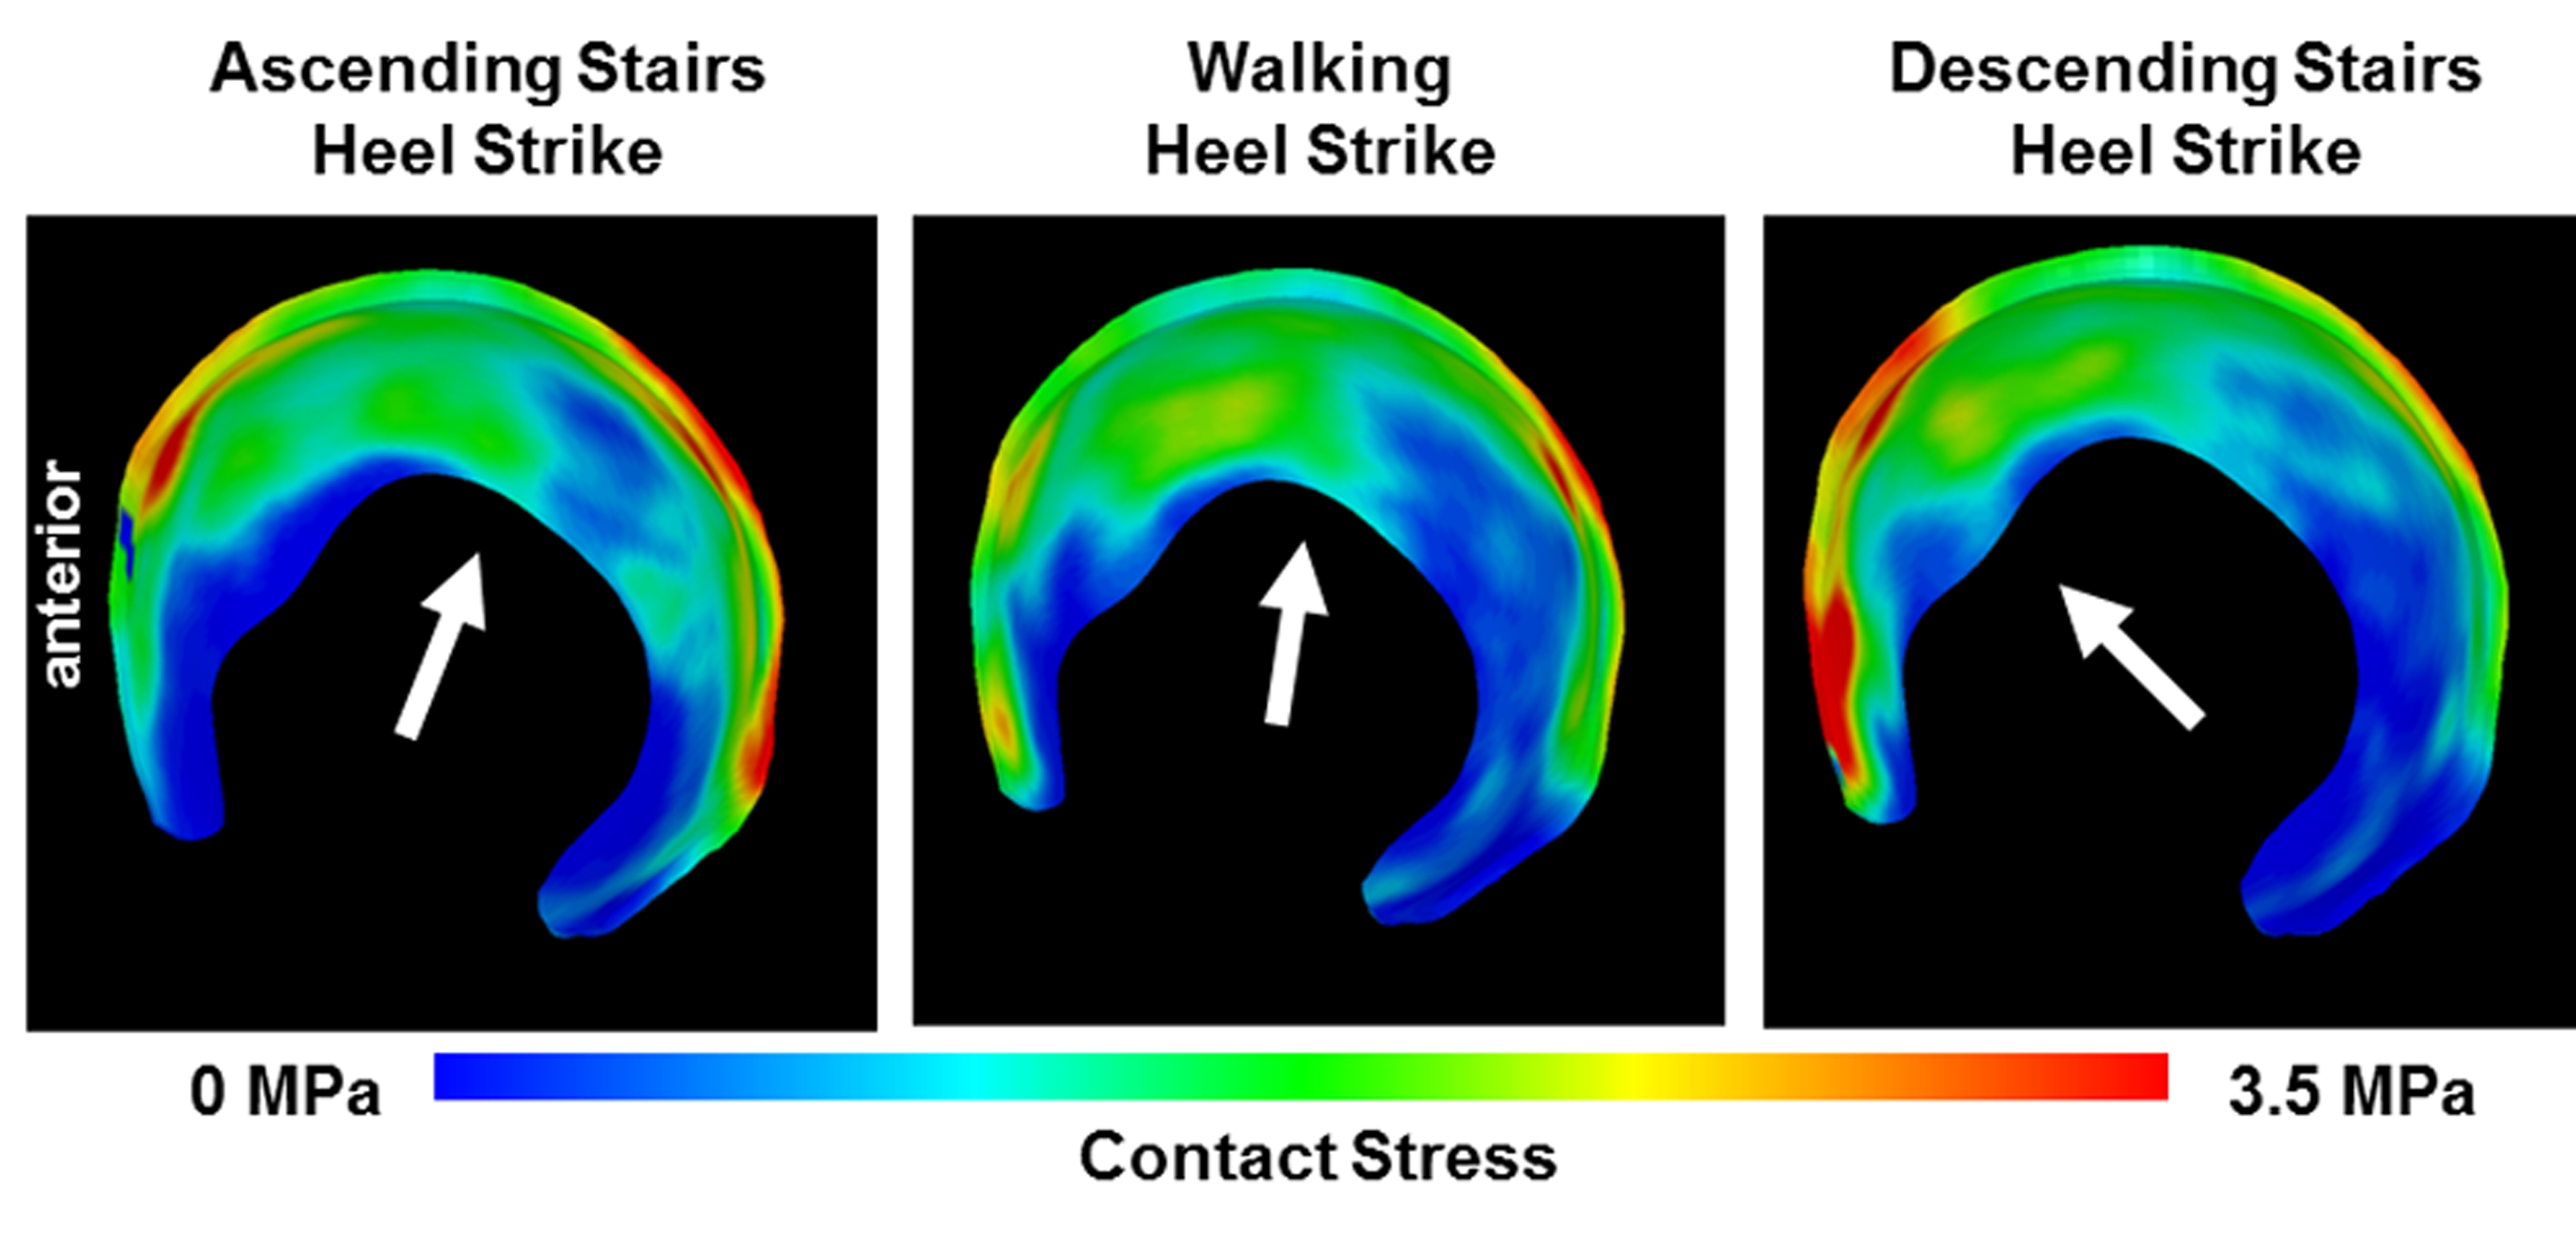
Supplementary Material - S Figure 2. Contact stresses on the acetabular cartilage during heel strike activities, sampled onto a representative mesh and averaged across all subjects. Arrows indicate the approximate direction of the applied joint reaction force. Contact patterns tended to shift in correspondence with the changing direction of applied force.
Supplementary Material - S Figure 3. For consideration as a cover photo.
ACKNOWLEDGMENTS
Financial support from NIH R01AR053344 and R01GM083925 is gratefully acknowledged. The authors thank R. Kent Sanders, MD for interpreting the CT arthrograms.
REFERENCES
- 1.Mavcic B, Pompe B, Antolic V, et al. Mathematical estimation of stress distribution in normal and dysplastic human hips. J Orthop Res. 2002;20:1025–1030. doi: 10.1016/S0736-0266(02)00014-1. [DOI] [PubMed] [Google Scholar]
- 2.Bombelli R. Osteoarthritis of the hip: classification and pathogenesis. Berlin and New York: Springer-Verlag; 1983. [Google Scholar]
- 3.Harris WH. Etiology of osteoarthritis of the hip. Clin Orthop Relat Res. 1986:20–33. [PubMed] [Google Scholar]
- 4.Jessel RH, Zurakowski D, Zilkens C, et al. Radiographic and patient factors associated with pre-radiographic osteoarthritis in hip dysplasia. J Bone Joint Surg Am. 2009;91:1120–1129. doi: 10.2106/JBJS.G.00144. [DOI] [PubMed] [Google Scholar]
- 5.Bardakos NV, Villar RN. Predictors of progression of osteoarthritis in femoroacetabular impingement: a radiological study with a minimum of ten years follow-up. J Bone Joint Surg Br. 2009;91:162–169. doi: 10.1302/0301-620X.91B2.21137. [DOI] [PubMed] [Google Scholar]
- 6.Beck M, Kalhor M, Leunig M, Ganz R. Hip morphology influences the pattern of damage to the acetabular cartilage: femoroacetabular impingement as a cause of early osteoarthritis of the hip. J Bone Joint Surg Br. 2005;87:1012–1018. doi: 10.1302/0301-620X.87B7.15203. [DOI] [PubMed] [Google Scholar]
- 7.Ganz R, Parvizi J, Beck M, et al. Femoroacetabular impingement: a cause for osteoarthritis of the hip. Clin Orthop Relat Res. 2003:112–120. doi: 10.1097/01.blo.0000096804.78689.c2. [DOI] [PubMed] [Google Scholar]
- 8.Afoke NY, Byers PD, Hutton WC. Contact pressures in the human hip joint. J Bone Joint Surg Br. 1987;69:536–541. doi: 10.1302/0301-620X.69B4.3611154. [DOI] [PubMed] [Google Scholar]
- 9.Sparks DR, Beason DP, Etheridge BS, et al. Contact pressures in the flexed hip joint during lateral trochanteric loading. J Orthop Res. 2005;23:359–366. doi: 10.1016/j.orthres.2004.08.019. [DOI] [PubMed] [Google Scholar]
- 10.von Eisenhart-Rothe R, AC, Steinlechner M, Muller-Gerbl M, Eckstein F. Quantitative determination of joint incongruity and pressure distribution during simulated gait and cartilage thickness in the human hip joint. Journal of Orthopaedic Research. 1999;7:532–539. doi: 10.1002/jor.1100170411. [DOI] [PubMed] [Google Scholar]
- 11.Bergmann G. Hip98: Data Collection of Hip Joint Loading on CD-ROM. Berlin: Free University and Humboldt University; 1998. [Google Scholar]
- 12.Bergmann G, Deuretzbacher G, Heller M, et al. Hip contact forces and gait patterns from routine activities. J Biomech. 2001;34:859–871. doi: 10.1016/s0021-9290(01)00040-9. [DOI] [PubMed] [Google Scholar]
- 13.Carlson CE, Mann RW, Harris WH. A radio telemetry device for monitoring cartilage surface pressures in the human hip. IEEE Trans Biomed Eng. 1974;21:257–264. doi: 10.1109/TBME.1974.324311. [DOI] [PubMed] [Google Scholar]
- 14.Hodge WA, Fijan RS, Carlson KL, et al. Contact pressures in the human hip joint measured in vivo. Proc Natl Acad Sci U S A. 1986;83:2879–2883. doi: 10.1073/pnas.83.9.2879. [DOI] [PMC free article] [PubMed] [Google Scholar]
- 15.Genda E, Iwasaki N, Li G, et al. Normal hip joint contact pressure distribution in single-leg standing--effect of gender and anatomic parameters. J Biomech. 2001;34:895–905. doi: 10.1016/s0021-9290(01)00041-0. [DOI] [PubMed] [Google Scholar]
- 16.Yoshida H, Faust A, Wilckens J, et al. Three-dimensional dynamic hip contact area and pressure distribution during activities of daily living. J Biomech. 2006;39:1996–2004. doi: 10.1016/j.jbiomech.2005.06.026. [DOI] [PubMed] [Google Scholar]
- 17.Bachtar F, Chen X, Hisada T. Finite element contact analysis of the hip joint. Medical & biological engineering & computing. 2006;44:643–651. doi: 10.1007/s11517-006-0074-9. [DOI] [PubMed] [Google Scholar]
- 18.Brown TD, DiGioia AM., 3rd A contact-coupled finite element analysis of the natural adult hip. J Biomech. 1984;17:437–448. doi: 10.1016/0021-9290(84)90035-6. [DOI] [PubMed] [Google Scholar]
- 19.Rapperport DJ, Carter DR, Schurman DJ. Contact finite element stress analysis of the hip joint. J Orthop Res. 1985;3:435–446. doi: 10.1002/jor.1100030406. [DOI] [PubMed] [Google Scholar]
- 20.Anderson AE, Ellis BJ, Maas SA, et al. Validation of finite element predictions of cartilage contact pressure in the human hip joint. J Biomech Eng. 2008;130 doi: 10.1115/1.2953472. 051008. [DOI] [PMC free article] [PubMed] [Google Scholar]
- 21.Anderson LA, Peters CL, Park BB, et al. Acetabular cartilage delamination in femoroacetabular impingement. Risk factors and magnetic resonance imaging diagnosis. J Bone Joint Surg Am. 2009;91:305–313. doi: 10.2106/JBJS.G.01198. [DOI] [PubMed] [Google Scholar]
- 22.Wiberg G. Studies on dysplastic acetabula and congenital subluxation of the hip joint. Acta Chir Scand. 1939;83:28–38. [Google Scholar]
- 23.Clohisy JC, Carlisle JC, Beaule PE, et al. A systematic approach to the plain radiographic evaluation of the young adult hip. J Bone Joint Surg Am. 2008;90(Suppl 4):47–66. doi: 10.2106/JBJS.H.00756. [DOI] [PMC free article] [PubMed] [Google Scholar]
- 24.Tonnis D. Congenital dysplasia and dislocation of the hip. Berlin: Springer Verlag; 1987. [Google Scholar]
- 25.Anderson AE, Ellis BJ, Peters CL, Weiss JA. Cartilage thickness: factors influencing multidetector CT measurements in a phantom study. Radiology. 2008;246:133–141. doi: 10.1148/radiol.2461062192. [DOI] [PMC free article] [PubMed] [Google Scholar]
- 26.Allen BC, Peters CL, Brown NA, Anderson AE. Acetabular cartilage thickness: accuracy of three-dimensional reconstructions from multidetector CT arthrograms in a cadaver study. Radiology. 2010;255:544–552. doi: 10.1148/radiol.10081876. [DOI] [PMC free article] [PubMed] [Google Scholar]
- 27.Anderson AE, Peters CL, Tuttle BD, Weiss JA. Subject-specific finite element model of the pelvis: development, validation and sensitivity studies. J Biomech Eng. 2005;127:364–373. doi: 10.1115/1.1894148. [DOI] [PubMed] [Google Scholar]
- 28.Puso MA, Maker, Bradley N, Ferencz, Robert M, Hallquist, John O. NIKE3D: A Nonlinear, Implicit, Three-Dimensional Finite Element Code. For Solid and Structural Mechanics. User's Manual. 2007 [Google Scholar]
- 29.Caligaris M, Ateshian GA. Effects of sustained interstitial fluid pressurization under migrating contact area, and boundary lubrication by synovial fluid, on cartilage friction. Osteoarthritis And Cartilage / OARS, Osteoarthritis Research Society. 2008;16:1220–1227. doi: 10.1016/j.joca.2008.02.020. [DOI] [PMC free article] [PubMed] [Google Scholar]
- 30.Maas S, Rawlins D, Weiss J. "PreView" Finite Element Pre-Processing. Musculoskeletal Research Laboratories. 2010 http://mrl.sci.utah.edu/software/preview.
- 31.Maas S, Rawlins D, Weiss J. "PostView" Finite Element Post Processing. Musculoskeletal Research Laboratories. 2010 http://mrl.sci.utah.edu/software/postview.
- 32.Athanasiou KA, Agarwal A, Dzida FJ. Comparative study of the intrinsic mechanical properties of the human acetabular and femoral head cartilage. J Orthop Res. 1994;12:340–349. doi: 10.1002/jor.1100120306. [DOI] [PubMed] [Google Scholar]
- 33.Anderson AE, Ellis BJ, Maas SA, Weiss JA. Effects of idealized joint geometry on finite element predictions of cartilage contact stresses in the hip. J Biomech. 2010;43:1351–1357. doi: 10.1016/j.jbiomech.2010.01.010. [DOI] [PMC free article] [PubMed] [Google Scholar]
- 34.Lutz A, Fietz K, Nackenhorst U. Simulation of the physiological contact pressure distribution in the human hip joint. Proceedings in Applied Mathematics and Mechanics. 2009;9:149–150. [Google Scholar]
- 35.Russell ME, Shivanna KH, Grosland NM, Pedersen DR. Cartilage contact pressure elevations in dysplastic hips: a chronic overload model. Journal of orthopaedic surgery and research. 2006;1:6. doi: 10.1186/1749-799X-1-6. [DOI] [PMC free article] [PubMed] [Google Scholar]
- 36.Brown TD, Shaw DT. In vitro contact stress distributions in the natural human hip. J Biomech. 1983;16:373–384. doi: 10.1016/0021-9290(83)90071-4. [DOI] [PubMed] [Google Scholar]
- 37.Rushfeldt PD, Mann RW, Harris WH. Improved techniques for measuring in vitro the geometry and pressure distribution in the human acetabulum. II Instrumented endoprosthesis measurement of articular surface pressure distribution. Journal of biomechanics. 1981;14:315–323. doi: 10.1016/0021-9290(81)90041-5. [DOI] [PubMed] [Google Scholar]
- 38.von Eisenhart-Rothe R, Eckstein F, Muller-Gerbl M, et al. Direct comparison of contact areas, contact stress and subchondral mineralization in human hip joint specimens. Anat Embryol (Berl) 1997;195:279–288. doi: 10.1007/s004290050047. [DOI] [PubMed] [Google Scholar]
- 39.Eckstein F, von Eisenhart-Rothe R, Landgraf J, et al. Quantitative analysis of incongruity, contact areas and cartilage thickness in the human hip joint. Acta anatomica. 1997;158:192–204. doi: 10.1159/000147930. [DOI] [PubMed] [Google Scholar]
- 40.Ateshian GA, Ellis BJ, Weiss JA. Equivalence between short-time biphasic and incompressible elastic material responses. Journal of biomechanical engineering. 2007;129:405–412. doi: 10.1115/1.2720918. [DOI] [PMC free article] [PubMed] [Google Scholar]
- 41.Ferguson SJ, Bryant JT, Ganz R, Ito K. An in vitro investigation of the acetabular labral seal in hip joint mechanics. Journal of biomechanics. 2003;36:171–178. doi: 10.1016/s0021-9290(02)00365-2. [DOI] [PubMed] [Google Scholar]
- 42.Konrath GA, Hamel AJ, Olson SA, et al. The role of the acetabular labrum and the transverse acetabular ligament in load transmission in the hip. The Journal of bone and joint surgery. 1998;American volume 80:1781–1788. doi: 10.2106/00004623-199812000-00008. [DOI] [PubMed] [Google Scholar]
- 43.Henak CA, Ellis BJ, Harris MD, et al. Role of the acetabular labrum in load support across the hip joint. Journal of biomechanics. 2011 doi: 10.1016/j.jbiomech.2011.06.011. (in Press) [DOI] [PMC free article] [PubMed] [Google Scholar]
Associated Data
This section collects any data citations, data availability statements, or supplementary materials included in this article.
Supplementary Materials
Supplementary Material - S Figure 1. Left - Time points and orientation of the simulated activities based upon data from Bergmann et al. [12]. Right - Hip contact force time points simulated during walking: (a) heel strike (WHS), (b) heel-mid (WHM), (c) midstance (WMD), (d) mid-late (WML), and (e) late stance (WLS).
Supplementary Material - S Figure 2. Contact stresses on the acetabular cartilage during heel strike activities, sampled onto a representative mesh and averaged across all subjects. Arrows indicate the approximate direction of the applied joint reaction force. Contact patterns tended to shift in correspondence with the changing direction of applied force.
Supplementary Material - S Figure 3. For consideration as a cover photo.