Abstract
Diabetic retinopathy has become an increasingly important cause of blindness. Nevertheless, vision loss can be prevented from early detection of diabetic retinopathy and monitor with regular examination. Common automatic detection of retinal abnormalities is for microaneurysms, hemorrhages, hard exudates, and cotton wool spot. However, there is a worse case of retinal abnormality, but not much research was done to detect it. It is neovascularization where new blood vessels grow due to extensive lack of oxygen in the retinal capillaries. This paper shows that various combination of techniques such as image normalization, compactness classifier, morphology-based operator, Gaussian filtering, and thresholding techniques were used in developing of neovascularization detection. A function matrix box was added in order to classify the neovascularization from natural blood vessel. A region-based neovascularization classification was attempted as a diagnostic accuracy. The developed method was tested on images from different database sources with varying quality and image resolution. It shows that specificity and sensitivity results were 89.4% and 63.9%, respectively. The proposed approach yield encouraging results for future development.
Keywords: Biomedical Image Analysis, Digital Image Processing, Image Segmentation, Feature selection, Diabetic Retinopathy, Neovascularization
Introduction
The prevalence of diabetic retinopathy varies with the duration of having the disease. At diagnosis, less than 5% of the patients have retinopathy, while after 10 years, the prevalence rate could rise to 40–50% [1]. Diabetes retinopathy has become an increasingly important cause of blindness. Nevertheless, vision loss can be prevented from early detection of diabetic retinopathy and monitor the existing retinopathy with regular examination [1]. A study by Javitt J et al. [2] and Jaudin R [1] showed that the high cost of screening and shortage of medical professionals are the factors that hamper patients from taking regular screening. With the advancement of digital image processing technologies, the techniques can be applied to analyze retinal images in the absence of expert ophthalmologists.
This paper focused on detecting neovascularization where new blood vessels grow due to extensive lack of oxygen in the retinal capillaries. They are weak, easily torn, and may cause loss of vision. It is a great challenge in detecting neovascularization due to its similarity with normal blood vessels. Most of the previous researches such as in [3–6] focus on specific lesion detection only. The research work by Zhang et al. [7] shows an improved detection of blood vessel which is able to include neovascularization net. However, this work does not classify or distinguish the neovascularization from normal blood vessel. There are also many intrusive methods for detecting blood vessels and neovascularization where radio-opaque contrast agent is injected into the blood stream and diagnosis is done manually by ophthalmologist based on the produced angiograph [8]. Even though angiography-based methods could produce detailed retinal image, they are usually not preferred especially for early stage or regular diagnosis because of the intrusive approach.
A study by Shivaram [6] applied a hemorrhages detection algorithm on a set of 15 images. The detection results are 89.5% sensitivity, 99.9% specificity, and 98.3% predictivity. Results are validated by comparing with the expert ophthalmologist’s hand truth. The algorithm is an automatic type, which only requires a set of images to be processed. Usher et al. has developed a support system for diabetic retinopathy screening. Their system shows maximum sensitivity of 94.8% for the detection of any retinopathy on per patient basis with specificity of 52.8%. The accuracy result is shown to be calculated through image-based and not pixel-based [9].
This paper presents a holistic, non-intrusive approach of detecting neovascularization using our proposed combination techniques: compactness classifier, morphological operator, Gaussian, and thresholding. The non-intrusive property is contributed by the fact that this approach used only uncalibrated color images without the fundus fluorescein angiograms. The main contribution of this research is in neovascularization detection where it has not yet been fully explored [10], and not many researches on its automatic detection were done. The lack of research for neovascularization detection could be due to:
Lower cases—as neovascularization is a worse case than most common types of abnormalities such as microaneurysms, hemorrhages, hard exudates, and cotton wool spot, it has a lower percentage of reported cases and thus does not represent a majority in diabetic retinopathy cases.
Neovascularization is very similar to normal blood vessels, thus poses a great challenge for automatic detection system to distinguish this abnormality with normal cases.
Neovascularization is a serious stage, and normally suspected cases will be referred to expert ophthalmologists rather than relying on an automatic detection system.
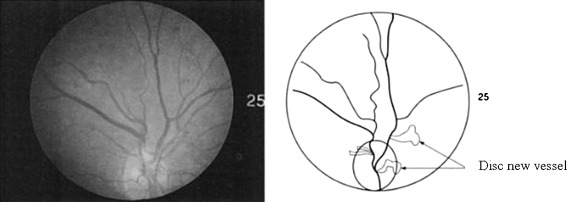
The authors believe that automatic neovascularization detection is very important as a support for existing methods on diabetic retinopathy detection. It can act as a pre-emptive strategy for getting immediate attention and treatment, help ophthalmologists in identifying hard-to-see features of neovascularization, and indirectly lower the cases of retinal damage. Figure 1 shows an example of neovascularization.
Fig. 1.
The left image shows a fundus image with neovascularization while the right image is the detected neovascularization near the optic disk [11]
Neovascularization Detection Scheme
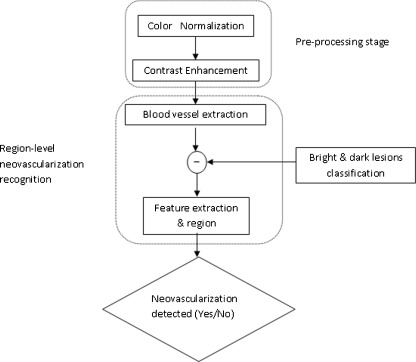
Our proposed neovascularization detection outline shown in Fig. 2 uses the green channel of the fundus image because in the green channel, the dark region has the highest contrast against the background. The proposed scheme consists of a two-stage image processing algorithms: neovascularization detection and segmentation.
Fig. 2.
The outline of the proposed system for automatic identification of neovascularization
The proposed algorithm was developed by using Matlab Release 2008a. It was run on a laptop with Windows Vista Ultimate 32-bit Operating System, powered by Intel Core 2 Duo Processor (P7350) and 2 GB DDRII RAM.
Neovascularization is difficult to extract due to its structure which is a random growth pattern. Moreover, the thickness of the blood vessel which constructs the lesion is usually as thin as one pixel. Plus, neovascularization is blended with the background image due to the uneven illumination of the image. It could present in various pattern, which are mostly like winding vessel, flower, sea coral, or other complicated structures. Neovascularization is usually located at the connection of vasculature branches. There is no color or intensity difference between dark lesions and neovascularization. The advantage for such condition is that a simple compactness classifier can be used to separate the result for dark lesions and blood vessels as illustrated in Eq. 1. Thus, neovascularization detection method will be based mainly on blood vessel detection method.
 |
1 |
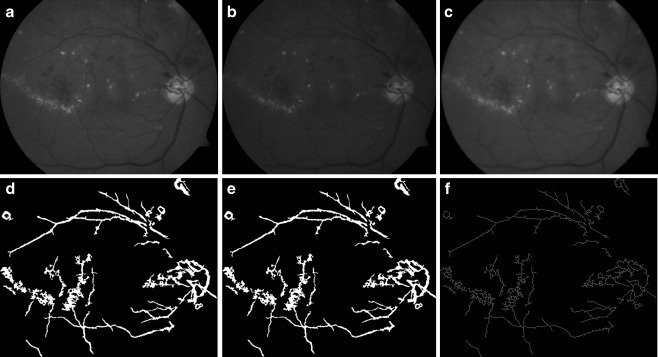
In order to develop an algorithm that is able to detect neovascularization, it must also able to detect the smallest blood vessels. Pre-processed image was used in the blood vessel extraction process as shown in Fig. 3. Therefore, a contrast adjustment technique implemented from [12] was performed in this work using sigmoid function as illustrated in Eq. 2. This technique was used to smooth the image by controlling actual contrast value, α. Thus, the image details perceived more clearly compared to that of original image. The result from pre-processing stage is a grayscale image; IMpre-processed with normalized intensity and enhanced contrast.
 |
2 |
Fig. 3.
a Image after applying pre-processing operation; b image after applying match-based filter; c contrast stretched image; d image after multiple morphology dilation and erosion; e result after thresholding; f morphology open applied to minimize noise
Although the small vessels have lower reflect compared to other retinal surface, they appear relative to the background. It is observed that these vessels almost never have ideal step edge due to intensity vessel profile varies by a small amount from vessel to vessel [13]. It is approximated by using Gaussian curve as in Eq. 3.
 |
3 |
The kernel used for the matched-based filter technique was constructed by using Gaussian equation with 16 × 16 size element [14] and a sigma value of 2. The sigma value is obtained through trial and error method. The value is set after the result of match-based filter is optimum. Then, match-based filter technique was applied. By applying the kernel to the image, only region with property match to the kernel was enhanced by mean of increment in the pixel intensity value. Contrast stretching technique was applied to the enhanced image to adjust the grayscale image intensity.
Multiple morphology dilation and erosion were also applied to the enhanced image in order to remove blood vessel. Multiple morphology dilation and erosion with smaller size of structuring element was used rather than a single process of dilation and erosion due to the destructive effect of using a large size of structuring element at once. Using a smaller size of structuring element repeatedly avoids losses of fundus image features while increases the contrast between dark and bright region.
Once the blood vessel branch was obtained, thresholding process was carried out with the threshold value set at ten percentage of maximum pixel intensity value of the result image. Finally, morphology open with value of 100 was applied to remove any region with area less than the value.
Neovascularization Classification Scheme
The result image of blood vessel might still have bright lesions or dark lesions fragments. Thus, bright and dark lesions result images were excluded in the process. This is important in order to eliminate the possibility of misdetection due to the number of lesions that could be misinterpreted as blood vessels and thus increase the number of blood vessels.
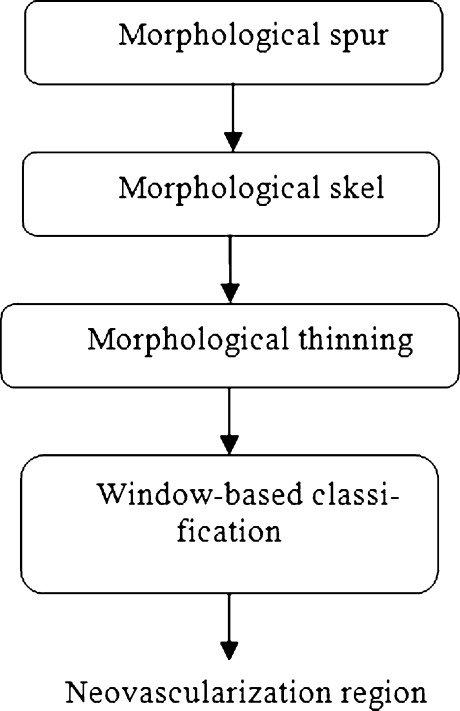
Figure 4 shows the detail of classification of neovascularization method. Neovascularization classification method was constructed based on two assumptions. It is assumed that when a square window is passed through the neovascularization region, it will contain a greater number of blood vessels compared to the non-neovascularization region. The numbers of blood vessels are calculated by separating the region of blood vessels. Another assumption is that when a square window is passed through the neovascularization region, it will contain a greater area of blood vessels compared to the non-neovascularization region. The area of blood vessels is calculated directly without separating the independent blood vessels region.
Fig. 4.
The procedure for Neovascularization feature extraction and region classification of the proposed system
A square window was created with 100 × 100 window size to locate the neovascularization region. The square window was run through to the result image after morphology thinning and spurs techniques were applied. Morphology spur removes spur pixel in blood vessel region and morphology thinning converts the object to lines of one pixel wide.
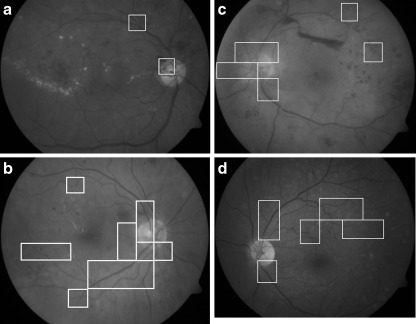
Several processes were carried out while running the square window. Morphology label was used to calculate the number of blood vessels region, while morphology area was used to calculate the area of blood vessel covering the window box. The classification of neovascularization was depending on the two assumptions. Thus, in order to classify the region as a neovascularization region, the square window must contain four or more blood vessels and the blood vessels must cover more than seven percentage of the square window area. An example of the successful detection is as in Fig. 5. A red box will appear to mark the neovascularization region.
Fig. 5.
Final detection result for image. The window boxes indicate areas with neovascularization a Image no. 120 from DIARETDB1 database [15]; b Image no. 276 from DIARETDB1 database [15]; c Image no. 96 from DIARETBD0 [16]; d Image no. 129 from DIARETDB1 [15]
Result and Discussion
As explained in “Introduction,” neovascularization occurs due to deteriorated diabetic retinopathy conditions. It is a critical stage prior to blindness, but the probability of having neovascularization is low from the population of diabetic cases. Fundus images from five different public databases (MESSIDOR [17], DIARETDB0 [16], DIARETDB1 [15], DRIVE [18], STARE [19]) and one database from a local hospital in Malaysia were searched for neovascularization cases. The images are from the benchmark retinal databases that are available online. Thus, detail of selection process or enrollment procedures of the patients is available through their respective websites. Certain criteria were set to choose suitable neovascularization image. Therefore, out of the five online databases and one local hospital database with 313 images, only 11 were found to have neovascularization; thus, all these images were used in our study. It is because the images are not clear, low resolution, and ground truth not related to diabetic diseases are discarded. Altogether, there were only 11 images chosen with indicated ground truth as having neovascularization.
The sizes of original images obtained are various depend on the database. DRIVE database contains images with the size of 768 × 584 pixels. On the other hand, STARE database uses 700 × 605 pixels, while images in MESSIDOR database are in 1,440 × 960, 2,240 × 1,488, and 2,304 × 1,536 pixels resolution. This shows the adaptability of the developed algorithm that is able to cope with multiple image resolutions.
These 11 images were used in our experiments to pinpoint the exact locations of neovascularization for each image. The measured sensitivity and specificity for each image is tabulated in Table 1. From our experiments, we obtained an average specificity of 89.4%, and sensitivity was 63.9%. Sensitivity and specificity of the detection result are obtained by comparing the result with ground truth. The ground truth is prepared by a local senior ophthalmologist as the clinical “gold standard.” Sensitivity and specificity can be calculated as below:
 |
4 |
 |
5 |
- TP
True Positive
- TN
True Negative
- FP
False Positive
- FN
False Negative
Table 1.
The result of neovascularization detection in retinal images
| 24-Bit images | Sensitivity (%) | Specificity (%) |
|---|---|---|
| Image 8 | 98.7582 | 91.7358 |
| Image 139 | 95.5891 | 0.0000 |
| Image 211 | 73.8596 | 100.0000 |
| Image 95 | 0.0000 | 94.5081 |
| Image 96 | 88.2159 | 95.7349 |
| Image 120 | 100.0000 | 98.6254 |
| Image 129 | 75.0245 | 95.8637 |
| Image 178 | 0.0000 | 97.6133 |
| Image 185 | 100.0000 | 38.8497 |
| Image 209 | 0.0000 | 91.6527 |
| Image 210 | 67.3143 | 95.8642 |
| Image 276 | 100.0000 | 83.5315 |
| Average | 63.0000 | 89.4000 |
SN is a measure of the sensitivity of the system in correctly classifying pixels with neovascularization, and SP is a measure of the system in correctly classifying pixels without neovascularization. The detection result obtained for neovascularization is done based on regions. It is worth to acknowledge that a huge portion of fundus image is covered by blood vessel branch. Meaning, with both blood vessel and dark lesion sharing the similar property of color intensity, a poor algorithm will give a very low specificity due to false detection of blood vessel as dark lesion. Zero percent sensitivity on the other hand means that the retinal image does not detect any neovascularization in a region, while 0% specificity means that retinal images does detect neovascularization region that do not belong to neovascularization class. This is because neovascularization region is usually almost blended with the background and dark lesions.
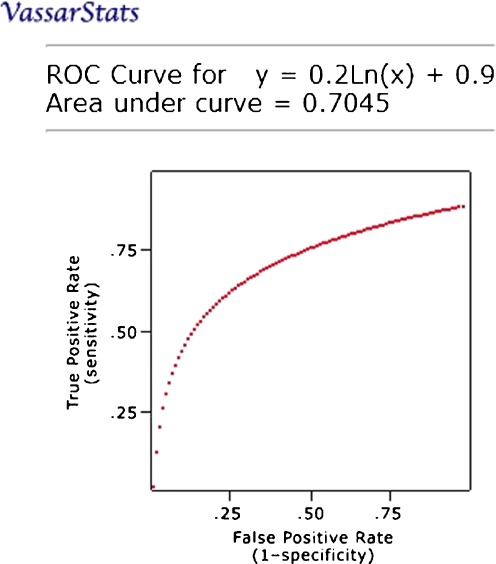
The receiver operating curve (ROC) is plotted for true positive rate (sensitivity) at the vertical axis against the false positive rate (100 − specificity) at the horizontal axis on different cutoff points. The closer the ROC plot is to the upper left corner, the higher the overall accuracy of the system [20]. ROC graph is plotted to show the system performance of neovascularization detection as shown in Fig. 6. From the ROC graph, optimum thresholds and settings can be chosen for different intention on sensitivity and specificity. In order to construct an ROC curve, several threshold values are applied.
Fig. 6.
ROC for neovascularization detection
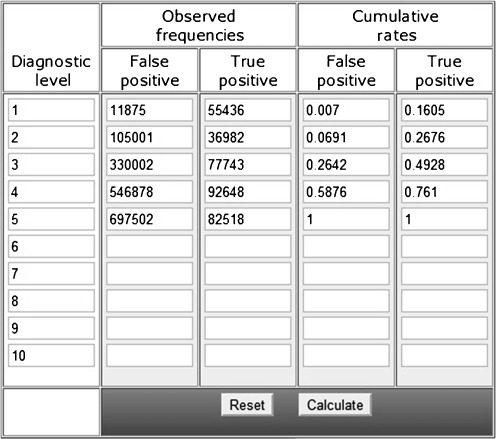
Adjustment to the threshold value to increase sensitivity will lead to a decrement in specificity, while a decrement in sensitivity will be followed by an increment in specificity. Such relation occurs due to the thresholding process that is depending on the threshold value. Therefore, area under the graph is a measure for the accuracy. In other words, it also measures the discrimination ability of the algorithm to correctly classify the retinal image with or without neovascularization. The proposed method is proven to be good as it achieved area under graph with 0.7045. The parameter used to vary the result as in Table 2 is the window size for detecting the possible area of neovascularization.
Table 2.
Table of True Positives (TP) and False Positive (FP) used to construct the ROC Curve of Neovascularization detection generated by online software
No comparison made between the approach algorithm and manual detection of neovascularization that uses fluorescein angiography images as the input images are different. Fluorescein angiography images provide important information on pathologies. In practical terms, the decision whether to laser treat the retina does not depend significantly on the images from fluorescein angiography, it is mostly done without this investigation. The fluorescein angiograms are not suitable for an automatic screening system because there are side effect associated giving a patient fluorescein. The use of color fundus images is more suitable for an automatic screening system in order to detect and treat diabetic retinopathy in an early stage [21].
Conclusion
Detection of neovascularization is a difficult task for retinal abnormality detection since the formed tiny blood vessel is small and not visibly clear. The proposed algorithm works well on poor quality image, different pixel resolution, and different type of database (variation of fundus camera). Its intention is to support the ophthalmologist decision in the diabetic retinopathy screening process. The algorithm is developed to process each image automatically.
Some past works on diabetic retinal abnormalities identification mainly detect lesions and were assessed in term of either lesion- or image-based accuracy against an approximately small dataset of retinal images. The reported lesion-based measurement was often an approximation of the real diagnostic accuracy as it was evaluated in a patch resolution basis. In this research work, pixel-level accuracy was used to locate the diabetic retinal abnormalities in color fundus image. Thus, an accurate accuracy measurement can be evaluated. Indeed, this system was able to identify neovascularization abnormality compared to other approaches.
A total of 11 color fundus images used in this research were provided from different sources. Uneven illumination is a main obstacle in detecting retinal abnormalities. The condition prevents the use of a simple threshold method such as pixel intensity threshold. It is because there is a huge possibility that the pixel intensity for a bright lesion at a region is similar to the pixel intensity of a background or a dark lesion. Thus, adjusted contrast enhancement and color normalization as pre-processing steps were applied to improve the image quality.
Various approaches could be used to extract the wanted features. However, the best result is the highest possible sensitivity value while maintaining the specificity at the optimum level. A result with high sensitivity value but very poor specificity value is to be avoided as it means that many misclassifications have happened. A new algorithm is developed to locate the neovascularization in retina: function box manipulation with features properties to distinguish neovascularization from normal vessel. This software is pre-validated by an ophthalmologist based on ground truth. It is still a new study in automatic medical analysis; therefore, 63.9% for sensitivity and 89.4% specificity still accepted as classification accuracy.
The proposed algorithm has shown encouraging result and could be used to evaluate digital retinal image obtained in diabetic retinopathy screening and used by non-expert to indicate which patient eye that needs further ophthalmologist investigations and treatments. This application provides a huge amount of saving in terms of manually reviewed the number of retinal image by ophthalmologists. Besides, the proposed algorithm performed well in detecting all the retinopathy diseases as a whole in an image and not a lesion-by-lesion process.
Acknowledgment
The project was supported by the grants from the National Science Foundation of Malaysia. The authors would like to thank to local general hospital and all the public available databases (DRIVE, STARE, Diaretdb0, and Messidor program) for providing the diabetic retinal images and clinical information.
References
- 1.Jaudin R. Report of screening for diabetic retinopathy. Putrajaya: Ministry of Health Malaysia; 2006. [Google Scholar]
- 2.Javitt JC. Cost effectiveness of current approaches to the control of retinopathy in Type I diabetics. Ophthalmology. 1989;9:255–264. doi: 10.1016/s0161-6420(89)32923-x. [DOI] [PubMed] [Google Scholar]
- 3.Walter T, Klein J-C, Massin P, Erginay A. A Contribution of Image Processing to the Diagnosis of Diabetic Retinopathy – Detection of Exudates in Color Fundus Images of the Human Retina. IEEE Trans Med Imaging. 2002;21:1236–1243. doi: 10.1109/TMI.2002.806290. [DOI] [PubMed] [Google Scholar]
- 4.Sopharak A, Uyyanonvara B: Automatic exudates detection on Thai diabetic retinopathy patients’ retinal images. Proceedings of the 2006 ECTI International Conference, 2006, pp 709–712
- 5.Niemeijer M, Ginneken B, Staal J, Suttorp-Schulten MSA, Abramoff MD. Automatic Detection of Red Lesions in Digital Color Fundus Photographs. Med Imaging IEEE Trans. 2005;24(24):584–592. doi: 10.1109/TMI.2005.843738. [DOI] [PubMed] [Google Scholar]
- 6.Shivaram JM, Patil R, Anarind HS. Automated Detection and Quantification of Hemorrhages in Diabetic Retinopathy Images Using Image Arithmetic and Morphological Methods. Int J Recent Trends Eng. 2009;2(6):174–176. [Google Scholar]
- 7.Zhang L, Li Q, You J, Zhang D. A Modified Matched Filter with Double-Sided Thresholding for Screening Proliferative Diabetic Retinopathy. IEEE Trans Inf Technol Biomed. 2009;13(4):528–534. doi: 10.1109/TITB.2008.2007201. [DOI] [PubMed] [Google Scholar]
- 8.Takerkart K, Fenouil R, Piovano J, Reynaud A, Hoffart L, Chavane F, Papadopoulo T, Conrath J, Masson GS: A Quantification framework for post-lesion neovascularization in retinal angiography. Proceedings of the 5th IEEE Int. Sym. Biomed Imaging, 2008, pp 1457–1460
- 9.Usher D, Dumskyi M, Himaga M, Williamson TH, Nussey S, Boyce J. Automated Detection of Diabetic Retinopathy in Digital Retinal Images: A Tool for Diabetic Retinopathy Screening. Diabet UK Diabet Med. 2004;21(1):84–90. doi: 10.1046/j.1464-5491.2003.01085.x. [DOI] [PubMed] [Google Scholar]
- 10.Patton N, Aslam TM, MacGillivray T, Deary IJ, Dhillon B, Eikelboom RH, Yogesan K, Constable IJ. Retinal image analysis: Concepts, applications, and potentials. Prog Retinal Eye Res. 2006;25:99–127. doi: 10.1016/j.preteyeres.2005.07.001. [DOI] [PubMed] [Google Scholar]
- 11.Rudnicka ARR, Birch J. Diabetic eye-disease-identification & co-management. Amsterdam: Elsevier; 2000. [Google Scholar]
- 12.Kovesi P: Matlab and octave functions for computer vision and image processing. Retrieved March 8, 2009 from School of Computer Science and Software Engineering, The University of Western Australia. Available online: http://www.csse.uwa.edu.au
- 13.Chaudhuri S, Chatterjee S, Katz N, Nelson M, Goldbaum M. Detection of blood vessels in retinal images using two dimensional matched filters. IEEE Trans Med Imaging. 1989;8(3):263–269. doi: 10.1109/42.34715. [DOI] [PubMed] [Google Scholar]
- 14.Hoover A, Kouznetsova V, Goldbaum M. Locating blood vessel in retinal images by piecewise threshold probing of a matched filter response. IEEE Trans Med Imaging. 2000;19(3):203–210. doi: 10.1109/42.845178. [DOI] [PubMed] [Google Scholar]
- 15.DIARETDB1 database. Available online: http://www2.it.l ut.fi/project/imageret/diaretdb1/
- 16.DIARETDB0 database. Available online: http://www2.it.lut.fi/project/imageret/diaretdb0/index.html
- 17.MESSIDOR database. Available online: http://messidor.crihan.fr
- 18.DRIVE database. Available online: http://www.isi.uu.nl/Research/Databases/DRIVE/
- 19.STARE database. Available online:http://www.parl.clemson.edu/stare/probing/
- 20.Zweig MH, Campbell G. Receiver-operating characteristic (ROC) plots: A fundamental evaluation tool in clinical medicine. Clin Chem. 1993;39:561–577. [PubMed] [Google Scholar]
- 21.Sopharak A, Uyyanonvara B, Barman S, Williamson TH. Automatic Detection of Diabetic Retinopathy Exudates from non-dilated Retinal Images using Mathematical Morphology methods. Sci Direct Comput Med Imaging Graphics. 2008;32:720–727. doi: 10.1016/j.compmedimag.2008.08.009. [DOI] [PubMed] [Google Scholar]


