

Abstract
Purpose
To explore different allometric equations for scaling clearance across the human life-span using propofol as a model drug.
Methods
Data from seven previously published propofol studies ((pre)term neonates, infants, toddlers, children, adolescents and adults) were analysed using NONMEM VI. To scale clearance, a bodyweight-based exponential equation with four different structures for the exponent was used: (I) 3/4 allometric scaling model; (II) mixture model; (III) bodyweight-cut-point separated model; (IV) bodyweight-dependent exponent model.
Results
Model I adequately described clearance in adults and older children, but overestimated clearance of neonates and underestimated clearance of infants. Use of two different exponents in Model II and Model III showed significantly improved performance, but yielded ambiguities on the boundaries of the two subpopulations. This discontinuity was overcome in Model IV, in which the exponent changed sigmoidally from 1.35 at a hypothetical bodyweight of 0 kg to a value of 0.56 from 10 kg onwards, thereby describing clearance of all individuals best.
Conclusions
A model was developed for scaling clearance over the entire human life-span with a single continuous equation, in which the exponent of the bodyweight-based exponential equation varied with bodyweight.
KEY WORDS: allometric, clearance, life-span, pharmacokinetics, propofol
INTRODUCTION
For scaling pharmacokinetics across the human life-span, the 3/4 allometric scaling approach (1) has gained in popularity in the field of pediatrics. While the 3/4 allometric scaling approach was originally designed to describe metabolic rates between different species covering a wide range in bodyweight (2), this function is now being applied to parameterize the influence of changes in body size on drug clearance parameters within the human weight-range.
In contrast with the reports supporting the 3/4 allometric scaling principles (3–5), there is a number of theoretical arguments against these scaling principles in general (6–8). Furthermore, the value of the allometric exponent is debated (9,10), the existence of a unique and universal value for the exponent is thought to be unlikely (11,12) and the application of allometric scaling principles to pharmacokinetics in the human weight-range is disputed (13,14). For paediatrics, the covering of changes in body size made by this bodyweight-based allometric equation with a fixed exponent of 0.75 for clearance are specifically insufficient to describe and predict drug clearance in preterm and term neonates, infants and young children (13,15,16). When applying the 3/4 allometric scaling method to different drugs, it has been found that the model systematically over-predicted clearances for neonates and under-predicted clearances for infants (15,17).
In order to account for the discrepancy of the 3/4 allometric method in young children, an augmentation of the 3/4 allometric equation with an age-based sigmoidal equation has been proposed (18,19). However, this age-adjustment is unidirectional, whereas bi-directional changes from the 3/4 allometric line have been reported in the papers aforementioned, that depend on the age of the children (15,17). Furthermore, introduction of this age-based maturation equation introduces age into the model in addition to bodyweight. While age and bodyweight are highly correlated in the paediatric population in a nonlinear manner, this may result in a collinearity problem (20). In this respect, it is emphasized that recent research shows that a priori inclusion of a false predefined covariate relationship into a model may decrease the predictive performance of that model (21). As a result of these limitations, in some reports the exponent of the allometric scaling equation was estimated instead of fixed to 0.75, resulting in values higher than 1 in datasets of young infants (22,23). From these reports, it seems that an optimized and statistically sound scaling approach is needed for scaling of clearance in paediatrics.
The aim of this study was to explore new approaches to scale drug clearance over the entire human life-span. Propofol was used as a model drug, and for this study seven datasets were available from preterm neonates with a median (range) gestational age of 37 (26–40) weeks to 81 year old adults (15,24–29).
MATERIALS AND METHODS
Subjects
A total of 174 subjects from seven previously published propofol studies were included in the current study. These studies are described in detail elsewhere and are briefly discussed as relevant to the current analysis.
Neonates (24)
Twenty-five cardiovascularly and respiratory stable neonates with a median of bodyweight of 2.93 (range 0.68–4.03) kilograms, postnatal age of 8 (1–25) days and gestational age of 37 (26–40) weeks were given an intravenous bolus dose of propofol (3 mg⋅kg−1) for the elective removal of chest tubes, (semi)elective chest tube placement or endotracheal intubation.
Infants (25)
Twenty-two non-ventilated infants after major craniofacial surgery with a median bodyweight of 8.9 (4.8–12.5) kilograms, aged 10 (3.8–17.3) months received 2–4 mg⋅kg−1·h−1 propofol during a median of 12.5 (6.0–18.1) hours.
Toddlers (26)
Twelve toddlers with minor burns, who had a median bodyweight of 11.2 (8.7–18.9) kilograms and age of 17.8 (12–31) months, were administered 4 mg⋅kg−1 propofol just before bathing.
Children (27)
Fifty-three healthy unpremedicated children with a median bodyweight of 23.3 (15–60.5) kilograms and median age of 7 (3–11) years were studied. Twenty children received an intravenous loading dose of 3 mg⋅kg−1 propofol. In the remaining 33 children, an intravenous loading dose of 3.5 mg⋅kg−1 was followed by a maintenance infusion. In 18 of the 33 children, a single infusion rate of 0.15 mg⋅kg−1⋅min−1 was administered, while 15 children received an infusion of 0.20 mg⋅kg−1⋅min−1 for 30 min, followed by an infusion of 0.125 mg⋅kg−1⋅min−1 till the end of the procedure.
Adolescents (15)
Fourteen adolescents with a median bodyweight of 51 (36.6–82) kilograms and median age of 14.7 (9.8–20.1) years were anaesthetized with propofol-remifentanil (2–10 mg⋅kg−1·h−1) for scoliosis surgery during 6.8 (3.3–7.7) hours with an intra-operative wake-up test followed by re-induction of anesthesia.
Adults I (28)
Twenty-four women undergoing gynaecological surgery, with a median bodyweight of 68.5 (55–80) kilograms and a median age of 45.5 (33–57) years, received 2.5 mg⋅kg−1 propofol over 60 s for induction of anesthesia.
Adults II (29)
Twenty-four healthy volunteers with a median bodyweight of 79.4 (44.4–122.7) kilograms and median age of 53 (26–81) years were administered a bolus dose of propofol, followed 1 h later by a 60 min infusion with an infusion rate of 25, 50, 100, or 200 mg⋅kg−1·min−1 in a study which investigated the influences of method of administration, infusion rate, patient covariates, and EDTA (ethylenediaminetetraacetic acid) on the pharmacokinetics of propofol.
Pharmacokinetic Modeling
Model Building
The population pharmacokinetic analysis was performed with the non-linear mixed effects modeling software NONMEM version 6.2. (ICON Development Solutions, Ellicott City, MD, USA) using the first-order conditional estimation method with the interaction option (FOCEI). Tools like S-PLUS interface for NONMEM (LAP&P Consultants BV, Leiden, NL), S-Plus (version 8.1, Insightful Software, Seattle, WA, USA), XPose and R (version 2.10.0) were used to visualize the output and evaluate the models.
Propofol concentrations were logarithmically transformed and fitted simultaneously, since the range in concentrations was more than 1,000 fold. Model building was performed in four steps: (1) selection of structural model, (2) selection of statistical sub-model, (3) covariate analysis, (4) model validation. A difference in objective function (OFV) between models of more than 7.88 points was considered as statistically significant (p < 0.005 assuming a Chi-square distribution). Furthermore, the goodness-of-fit plots (observed versus individual predicted concentrations and versus population predicted concentrations, and conditional weighted residuals versus time and versus population prediction concentrations) were evaluated (30). Finally, improvement of the individual concentration-time profiles, the confidence intervals of the parameter estimates and the correlation matrix were assessed.
Structural Model
Based on previous reports (31–33) the time-course of propofol concentrations was modeled with a three-compartment model, which was parameterized in terms of total clearance (CL), volume of distribution of the central compartment (V1), volume of distribution of the rapid-equilibrating peripheral compartment (V2) and slow-equilibrating peripheral compartment (V3), and inter-compartmental clearances between central compartment and two peripheral compartments (Q2,Q3). In addition, the performance of a two compartment model with the parameters CL, Q2, V1 and V2 was evaluated.
Statistical Model
Inter-individual variability in the pharmacokinetic parameters was tested in the model assuming log-normal distributions, expressed as
 |
1 |
where θ i is the individual pharmacokinetic parameter value for the ith individual, θ TV is the population pharmacokinetic parameter value or typical value, and η i is a random variable for the ith individual from a normal distribution with mean zero and variance ω 2. In addition to testing the inclusion of inter-individual variability on individual parameters, model improvement by inclusion of covariance between these variability parameters was tested as well.
For the residual error, an additive model for log-transformed concentrations was used which corresponds to proportional error on untransformed data, expressed as:
 |
2 |
where C
ij is the value of the observed propofol concentration of ith individual at time j,  is the value of the predicted propofol concentration of the ith individual at time j, and ε is a random variable for this observation from a normal distribution with mean zero and variance σ
2.
is the value of the predicted propofol concentration of the ith individual at time j, and ε is a random variable for this observation from a normal distribution with mean zero and variance σ
2.
Covariate Models
To visualize potential relationships, candidate covariates such as age and bodyweight were plotted independently versus the empirical Bayes post hoc estimates for all pharmacokinetic parameters. Potential covariates were separately implemented into the model using a linear or power equation over the studied covariate range:
 |
3 |
In this equation, θ i represents the individual parameter estimate of the ith subject, θ TV represents the population parameter estimate, Cov is the covariate of interest with subscript median indicating the median value of the particular covariate and k is the exponent which was fixed to 1 for a linear function or estimated for a power function.
The significance of a covariate was statistically tested by use of the objective function. A p value < 0.005 was considered significant in the forward inclusion while on the other hand a more stringent p value of < 0.001 was used in the backward deletion. In addition, individual and population parameter estimates were plotted against the most predictive covariate to evaluate whether the individual predicted parameters are evenly distributed around the population predicted values (30). When two or more covariates were found to significantly improve the model, the covariate causing the largest reduction in the objective function was retained in the model and served as the basis for subsequent inclusion of additional covariates. Furthermore, for the final covariate model, general criteria for model evaluation were considered as described under ‘Model Building’, while also the results of the model validation procedures were taken into account.
As bodyweight proved to be superior over age as a covariate for clearance, four covariate models based on bodyweight were tested. For propofol clearance, the common structure of these allometric models was:
 |
4 |
in which Cl i is clearance in the ith individual with bodyweight BW i; Cl p is the clearance in a standardized adult with a bodyweight of 70 kg; and the exponent k has different values in the four different covariate models as described below.
Model I.
The 3/4 allometric model; in which k was fixed to 0.75.
Model II.
The mixture model; in which different values for the exponent k were estimated for two sub-populations. The entire population was assumed to have two subpopulations: POP 1 and POP 2. For each sub-population different k and Cl p values were estimated, but the inter-individual variability on Cl was kept the same for both sub-populations. The assignment of individuals to one of the sub-populations was determined by a probability model (34). Briefly, the probability model assumed two log-normal distributions for clearance with different mean values but common standard deviation for two sub-populations. Each individual has a probability of π belonging to POP 1 and has 1-π probability of belonging to POP 2.The mixture model was implemented by the $MIX option in NONMEM VI.
Model III.
The bodyweight-cut-point separated model; in which different values for the exponent k were estimated for two sub-populations: POP bw<d and POP bw≥d. These sub-populations were determined by a cut-point bodyweight d which is a fixed effect parameter in NONMEM: individuals with bodyweight less than the cut-point belonged to POP bw<d and individuals with bodyweight greater than or equal to the cut-point belonged to POP bw≥d.
Model IV.
The bodyweight-dependent exponent (BDE) model; in which the allometric exponent k changed in a sigmoidal fashion with bodyweight according to Eq. 5:
 |
5 |
in which BW i is bodyweight of an individual i; k 0 is the value of the exponent at a theoretical bodyweight of 0 kg; k max is the maximum decrease of the exponent; k 50 is the bodyweight at which a 50% decrease in the maximum decrease of exponent is attained, and γ is the Hill coefficient determining the steepness of sigmoidal decline in the exponent.
Model Validation
Stratified bootstrap re-sampling was performed to obtain the same numbers of patients of each of the seven study populations in the new re-sampled datasets compared to the original dataset. This stratified bootstrap was implemented by the “bootstrap” command and the “-stratify_on” option in Perl-speaks-NONMEM (copyright by Mats Karlsson, Niclas Jonsson and Andrew Hooker). The median, standard deviation and the 90% confidence interval of the parameter estimates were calculated based on the results of the runs that minimized successfully.
In addition, the normalized prediction distribution errors (NPDE) method (35) was used as a simulation-based diagnostic. The dataset was simulated 2,000 times in NONMEM, each observed concentration was subsequently compared to the simulated reference distribution using the NPDE add-on package in R. A histogram of the NPDE distribution in the total dataset and plots of NPDE versus individual predicted concentration and versus time were used to evaluate the final model.
In order to evaluate the precision of the population predicted clearances by the four different covariate models for clearance, we used the root mean square error (RMSE) which was calculated as follows:
 |
6 |
 |
7 |
in which Cl p is the population predicted clearance; Cl i is the individual predicted clearance; n is the number of individuals.
RESULTS
The analysis was based on a total number of 4,396 observations from 174 individuals aged between 1 day to 81 years and with a bodyweight varying between 0.68 and 122.7 kg. An overview of the datasets used for model building is shown in Table I.
Table I.
Overview of Propofol Pharmacokinetic Datasets Used in the Current Analysis (Values Expressed as Median (Range))
| Population | N | Indication | Weight (kg) | Age (yrs) | Administration | Samplesc |
|---|---|---|---|---|---|---|
| Neonates (24) | 25 | Removal of chest tubes | 2.93(0.68–4.03) | 8(1–25)a | Bolus | 4–14 |
| Infants (25) | 20 | Post-operative sedation after | 9(4.8–12.5) | 10.2(3.8–17.3)b | Infusion | 4–15 |
| craniofacial surgery | ||||||
| Toddlers (26) | 12 | Bathing of patients with minor burn injuries | 11.2(8.74–18.9) | 1.25(1–2.6) | Bolus | 11–12 |
| Children (27) | 53 | Superficial body surface surgery | 23.3(15–60.5) | 7(3–11) | Bolus&infusion | 5–18 |
| Adolescents (15) | 14 | Scoliosis surgery | 51(36.6–82) | 14.5(9.6–19.8) | Bolus&infusion | 6–21 |
| Female adults(28) | 24 | Gynecological surgery | 68.5(55–80) | 45.5(33–57) | Bolus | 18 |
| Adults (29) | 24 | PK study in healthy volunteers | 79.4(44.4–122.7) | 53(26–81) | Infusion | 20–21 |
aage in days
bage in months
cnumber of samples per subject (range)
A three compartment model performed better than a two compartment model. In this three compartment model, four different bodyweight-based allometric equations for clearance were seperately tested and evaluated for their performance. All parameter estimates including their coefficients of variation (CV values) and objective functions of these four covariate models are listed in Table II.
Table II.
Parameter Values, Corresponding Coefficients of Variation (CV%), and Objective Function for the Four Different Covariate Models for Clearance. Model I: 3/4 Allometric Model; Model II: the Mixture Model; Model III: the Bodyweight-Cut-Point Separated Model; Model IV: the Bodyweight-Dependent Exponent (BDE) Model
| Parameter | Model | |||
|---|---|---|---|---|
| Model I | Model II | Model III | Model IV | |
| Fixed effect | ||||
| Cl (L/min) | = Clp⋅(bw/70)0.75 | = Clp⋅(bw/70)k | = Clp⋅(bw/70)k | = Clp⋅(bw/70)k |
| Clp (L/min∙70 kg) | 1.88(5.3%) | 1.99(2.5%) | ||
| Clp (L/min∙70 kg) | ||||
| of POP1 | 2.52(9.7%) | |||
| of POP2 | 2.13(3.8%) | |||
| Clp (L/min∙70 kg) | ||||
| of POPbw<d | 15.4(29.3%) | |||
| of POPbw≥d | 2.03(2.8%) | |||
| k | ||||
| of POP1 | 1.32(4.2%) | |||
| of POP2 | 0.68(8.9%) | |||
| k | ||||
| of POPbw<d | 1.68(8.4%) | |||
| of POPbw≥d | 0.61(5.9%) | |||
| π (i = 1) | 0.2(27.7%) | |||
| d (kg) | 16.5 FIX | |||

| ||||
| k 0 | 1.35 FIX | |||
| k max | 0.79(8.5%) | |||
| k 50 (kg) | 3.71(7.4%) | |||
| γ | 5.1 FIX | |||
| Q2(L/min) | 1.81 (6.2%) | 1.82 (6.3%) | 1.8 (6.2%) | 1.76 (6.6%) |
| Q3 (L/min) | =Q3p⋅(bw/70) | =Q3p⋅(bw/70) | =Q3p⋅(bw/70) | =Q3p⋅(bw/70) |
| Q3p (L/min∙70 kg) | 1.55 (4.8%) | 1.54(4.8%) | 1.55 (4.8%) | 1.59 (5.5%) |
| V1 (L) | 5.18 (10.6%) | 4.94 (11.4%) | 5.06 (11.1%) | 4.9 (11.8%) |
| V2 (L) | =V2p∙(bw/70) | =V2p∙(bw/70) | =V2p∙(bw/70) | =V2p∙(bw/70) |
| V2p (L/70 kg) | 23.9 (10.5%) | 23.4 (10.8%) | 23.1 (10.7%) | 23.9 (10.4%) |
| V3 (L) | =V3p⋅(bw/70) | =V3p⋅(bw/70) | =V3p⋅(bw/70) | =V3p⋅(bw/70) |
| V3p (L/70 kg) | 228 (6.8%) | 219 (7.0%) | 216 (7.0%) | 226 (8.6%) |
| Inter-individual variability | ||||
| ω2 CL | 0.44(20.7%) | 0.11 (17.4%) | 0.21 (24.5%) | 0.08(17.1%) |
| ω2 V1 | 1.55(15.2%) | 1.52(16.0%) | 1.53(15.9%) | 1.53(16.3%) |
| ω2 Q3 | 0.23(14.5%) | 0.22(16.3%) | 0.22(15.7%) | 0.27(20.1%) |
| ω2 V2 | 0.81(11%) | 0.82 (11.4%) | 0.81(11.4%) | 0.82(11.5%) |
| ω2 V3 | 0.3(17.4%) | 0.31(17.8%) | 0.32(17.4%) | 0.76(39.3%) |
| Residual error | ||||
| σ2 additive | 0.06(10.1%) | 0.06(10.2%) | 0.06(10.3%) | 0.06(10.3%) |
| OFV | −2339.7 | −2486.2 | −2464.4 | −2,489 |
bw=bodyweight; π = the probability of the individuals belonging to POP1 in the mixture model (Model II); d = the cut-point in bodyweight dividing the two sub-populations in the bodyweight-cut-point separated model (Model III); k 0= value of the exponent at a theoretical bodyweight of 0 kg; k max= the maximum decrease of the exponent; k 50= the bodyweight at which a 50% decrease in the maximum decrease of exponent is attained; γ= the Hill coefficient determining the steepness of sigmoidal decline in the exponent
The 3/4 allometric model (Model I) with a fixed allometric exponent of 0.75 had an OFV of −2339.7 (Table II). With this model population values of propofol clearance in children weighing less than 15 kg, were both over-estimated (in children between 0.5 and 5 kg) and under-estimated (in children between 5 and 15 kg) (Fig. 1).
Fig. 1.
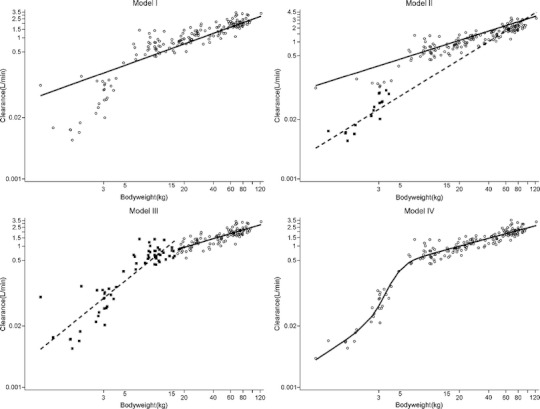
Plots of post hoc and population clearance values versus bodyweight. For the 3/4 allometric model (Model I), ○: individual post hoc clearances, solid line: population predicted clearance curve; the mixture model (Model II), ■: individual post hoc clearances of POP1, ○: individual post hoc clearances of POP2, dashed line: population predicted clearance curve of the POP1, solid line: population predicted clearance curve of POP2; the bodyweight-cut-point separated model (Model III), ■: individual post hoc clearances of POPbw<d, ○: individual post hoc clearances of POPbw≥d, dashed line: population predicted clearance curve of the POPbw<d, solid line: population predicted clearance curve of POPbw≥d; the bodyweight-dependent exponent (BDE) model (Model IV), ○: individual post hoc clearances, solid line: population predicted clearance curve.
For the mixture model (Model II) the OFV decreased significantly (p < 0.001) compared to Model I (Table II). The estimated allometric exponent value for clearance of population POP 1 was less than 1 (0.676), whereas its value for clearance of population POP 2 was greater than 1 (1.321) (Table II). The probability of an individual belonging to POP 1 (π) in Model II was found to be 0.2. Figure 1 shows that the population line of Model II described the post hoc propofol clearances better than Model I.
The bodyweight-cut-point separated model (Model III) had an OFV of −2464.4, which was an increase of 21.8 (P < 0.001) points compared to Model II and a decrease of 124.7 points (p < 0.001) compared to Model I (Table II). The bodyweight cut-point was estimated to be 16.5 kg, which was fixed to this value later on to obtain a successful covariance step. The estimated exponents of populations POP bw<d and POP bw≥d were 1.68 and 0.614, respectively (Table II). Figure 1 shows that Model III results in improved the fit of the population line to the post hoc clearances compared to Model I.
The bodyweight-dependent exponent model (Model IV) had the lowest OFV of −2,489 of the four allometric covariate models, which was significantly superior over the 3/4 allometric model and the bodyweight-cut-point separated model (p < 0.001) (Table II). The OFV of this model was not significantly different from the OFV of the mixture model. In order to get a successful covariance step, the exponent of bodyweight at 0 kg (k 0) and the hill factor (γ) were fixed to the estimated values from a successful run without covariance step, which were 1.35 and 5.24, respectively. Visually, Model IV had the best overall distribution of post hoc clearances versus population clearance (Fig. 1). Finally, model IV had the lowest inter-individual variability in clearance (Table II), indicating that this new equation indeed accounts for variability in clearance in the entire range of bodyweight of the subjects.
Table III lists the%RMSE values for the different paediatric subpopulations for all four covariate models. The precision of clearance prediction shows a trend of decrease from adult population to neonate population for the four models. In neonates, infants, and children, the bodyweight-dependent exponent model (Model IV) had the lowest%RMSE, and thus the highest precision, of the four models. In toddlers, the mixture model (Model II) had the lowest%RMSE value compared to other models.
Table III.
%RMSE of the Four Bodyweight-Based Exponential Equations for the Different Human Subpopulations, Model I: 3/4 Allometric Model; Model II: the Mixture Model; Model III: the Bodyweight-Cut-Point Separated Model; Model IV: the Bodyweight-Dependent Exponent (BDE) Model
| Population | Model I (%) | Model II (%) | Model III (%) | Model IV (%) |
|---|---|---|---|---|
| Neonates | 160 | 149 | 61 | 49 |
| Infants | 63 | 41 | 53 | 40 |
| Toddlers | 25 | 37 | 38 | 33 |
| Children | 32 | 26 | 26 | 23 |
| Adolescents | 24 | 53 | 30 | 27 |
| Adults I & II | 24 | 26 | 21 | 20 |
Based on these results, Model IV was selected as covariate model and further optimized. The parameter estimates of the final PK model are listed in Table IV. Figure 2 shows how the bodyweight dependent exponent for clearance (k, Eq. 5) changes with bodyweight according to the estimated parameters of Eq. 5 in Table IV. The figure shows that k decreased from a highest value of 1.35 (k 0) at the theoretical bodyweight zero to a lowest value of 0.65 (k 0-k max). At a bodyweight of 3.78 kg (k 50), half of the maximum decrease was reached (Table IV). The Hill coefficient (γ) of 5.24 reflected the rapid decrease in the exponent (k) with bodyweight (Fig. 2).Concerning other parameters than clearance, a linear function for bodyweight on V1 for the children who were younger than 100 days was identified, while for V2 a power equation based on bodyweight was found. Inclusion of these covariates resulted in a further decrease of 91.7 point (p < 0.001) in the OFV compared to Model IV. The observed versus population predicted plots stratified by study in Fig. 3 confirm that the final model not only describes the study population as a whole, but also the individual study populations without bias. Results of the bootstrap analysis show that the median estimated values based on resampled data were close to the estimated values from the final model fit of the original data and that all CV percentages are below 50%. This suggests the final model to be stable and the estimated parameter values to be accurate and precise. The results of the bootstrap are of particular relevance for the parameters that were fixed in model IV, i.e. k 0 and γ, as they justify the actual value these parameters were fixed to. Furthermore, the results from the normalized prediction distribution errors (NPDE) analysis in Fig. 4 show that the model can predict the median concentration in the overall dataset accurately, even though there is a slight over-prediction of the variability in the model. Finally, no trend in the plots of NPDE versus time and predicted concentration were observed.
Table IV.
Parameter Estimates, Bootstrap Results and Their Corresponding Coefficients of Variation (CV%) Values for the Final PK Model
| Parameter | Final model | Bootstrapa |
|---|---|---|
| Fixed effect | ||
| Cl (L/min) | = Clp∙(bw/70)k | = Clp∙(bw/70)k |
| Clp (L/min∙70 kg) | 2.02(2.6%) | 2.02(2.5%) |

| ||
| k 0 | 1.34 FIX | 1.35(6.2%) |
| k max | 0.79(12.2%) | 0.80(10.7%) |
| k 50 (kg) | 3.78(15.1%) | 3.75(7.5%) |
| γ | 5.24 FIX | 5.25(41.6%) |
| Q2(L/min) | 1.77(6.3%) | 1.72(7.9%) |
| Q3 (L/min) | =Q3p⋅(bw/70) | =Q3p⋅(bw/70) |
| Q3p (L/min∙70 kg) | 1.65(5.0%) | 1.64 (4.8%) |
| V1 (L) | if PNA ≥ 100 then = V1p, if PNA < 100 then = V1p⋅(bw/70) | |
| V1p (L) | 7.58(12.4%) | 7.69(10.1%) |
| V2 (L) | =V2p∙(bw/70)m | =V2p∙(bw/70)m |
| V2p (L/70 kg) | 15.5(14.7%) | 15.7 (11.4%) |
| m | 0.55(17.5%) | 0.55(10.8%) |
| V3 (L) | =V3p⋅(bw/70) | =V3p⋅(bw/70) |
| V3p (L/70 kg) | 221(8.9%) | 225(8.9%) |
| Inter-individual variability | ||
| ω2 CL | 0.09(18.0%) | 0.08(19.4%) |
| ω2 V1 | 1.19(41.3%) | 1.22 (18.3%) |
| ω2 Q3 | 0.25(17.0%) | 0.26(19.9%) |
| ω2 V2 | 0.52(40.8%) | 0.54(16.6%) |
| ω2 V3 | 0.71(44.0%) | 0.75(46%) |
| Residual error | ||
| σ2 additive | 0.06(10.3%) | 0.06 (10.1%) |
| OFV | −2580.7 | |
aMean estimated parameter values and their coefficient of variation in percentage from 200 stratified bootstrapping re-samples
bw=bodyweight; k 0= the exponent at a theoretical bodyweight of 0 kg; k max= the maximum decrease of the exponent; k 50= the bodyweight at which a 50% decrease in the maximum decrease of exponent is attained; γ= the Hill coefficient determining the steepness of sigmoidal decline in the exponent; m = the exponent of bodyweight on V2
Fig. 2.
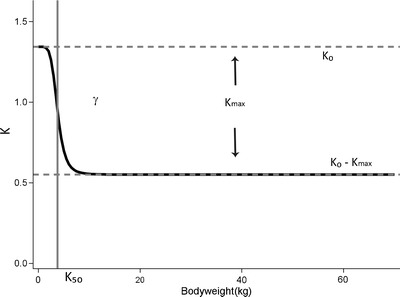
The relationship between the allometric exponent k and bodyweight in the bodyweight-dependent exponent (BDE) model for clearance (Model IV, Eq. 5). The parameter k 0 represents the value of the exponent at a theoretical bodyweight of 0 kg, k max represents the maximum decrease of the exponent, k 50 represents bodyweight at which 50% of the maximum decrease in the exponent is attained, and γ represents the Hill coefficient that determines the steepness of the sigmoidal decline.
Fig. 3.
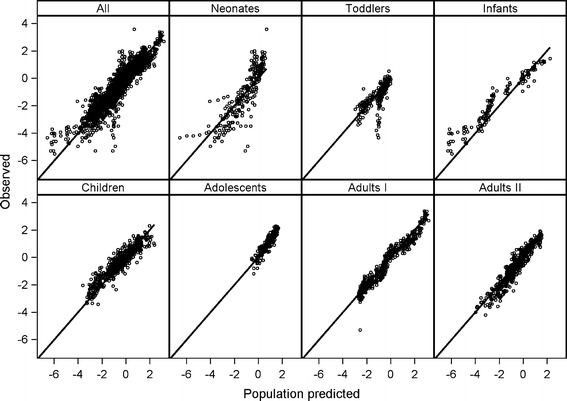
Observed versus population predicted propofol concentrations of the bodyweight-dependent exponent model (Model IV). ‘All’ presents data of all datasets together. Other panels represent data of neonates (24), infants (25), toddlers (26), children (27), adolescents (15), adults I (28) and adults II (29).
Fig. 4.
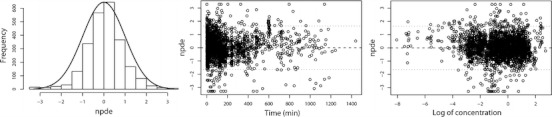
NPDE results of the final PK model for propofol. Left panel: histogram of NPDE distribution in the full dataset with the solid line representing a normal distribution as a reference; Middle panel: NPDE versus time; Right panel: NPDE versus log transformed concentration.
Figure 5 shows how variation in the parameters k 0, k max, k 50, and γ of the bodyweight dependent exponent k of Eq. 5 results in different curves for clearance versus bodyweight, including the observed curve in the current analysis on propofol clearance. This figure illustrates that the developed bodyweight-dependent exponent model is capable of capturing different maturation profiles of clearance versus bodyweight allowing in principle to be applied to different drugs and/or different metabolic pathways.
Fig. 5.
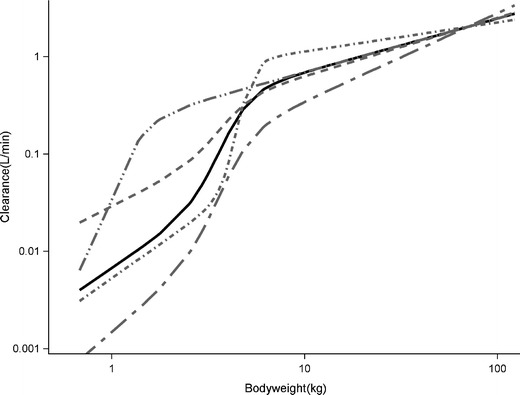
Simulations for the bodyweight-dependent exponent (BDE) model (Model IV) on the basis of different values for the parameters of Model IV (Eq. 5). Solid black curve: BDE curve with k 0 = 1.34, k max = 0.79, k 50 =3.78, γ = 5.24 (final PK model); dashed grey curve: BDE curve with k 0 = 1, k max = 0.4, k 50 = 3.78, γ = 5; long dash short dash grey curve: BDE curve with k 0 = 1.7, k max = 0.8, k 50 = 3.78, γ = 5; short dash dot grey curve: BDE curve with k 0 = 1.4, k max = 1.1, k 50 = 4.5, γ = 10; medium dash double dot grey curve: BDE curve with k 0 = 1.34, k max = 0.8, k 50 = 1, γ = 5.
DISCUSSION
In this study, we tested four different allometric equations to capture changes in propofol clearance in seven datasets comprising almost every stage of human life. We found that fixing the allometric exponent to 0.75 (the 3/4 allometric model, Model I) resulted in adequate description of clearance in adults, adolescents, children and toddlers, but yielded significant under-prediction in infants and over-prediction in term and preterm neonates. Results of the mixture model (Model II) and the bodyweight-cut-point separated model (Model III) showed that an allometric exponent other than 0.75 was more suitable for neonates and infants. In fact, both models identified an allometric exponent greater than 1 for the subpopulation that was composed of mainly neonates and infants resulting in improved description of clearance in these youngest and lightest patient groups in comparison with the 3/4 allometric model. This has been reported before for morphine clearance in children younger than 3 years of age, where an exponent of 1.44 was found to best describe the developmental changes in clearance (22). Similarly, Mahmood reported that the error in the prediction of clearance decreased when the scaling exponent increased from 0.75 towards 1 when studying different drugs in children less than 1 year of age (13). Even though the overall performance improved significantly, the use of two different allometric exponents for different human subpopulations as implemented in Model II and Model III resulted in ambiguous clearance predictions for the individuals on the boundaries of the paediatric subpopulations. In the current study, the observed issue of different exponents at different weight ranges was overcome by implementing an allometric equation with an exponent that varies with bodyweight. This bodyweight-dependent exponent (BDE) model contains a continuous bodyweight-based equation which allowed for the description of maturational changes in propofol clearance in individuals covering the entire human life-span. While the current model needs to be further evaluated in an external validation procedure, according to the advanced model evaluation criteria for pediatric population models (30), the descriptive and predictive performances of this model were affirmed by stratified diagnostics (Fig. 3), bootstrap validation (Table IV), NPDE (Fig. 4), and%RMSE results (Table III).
An important question is whether this bodyweight-dependent exponent may reflect underlying physiological maturation processes. Unfortunately, we were not able to establish a direct link between the change in exponent and the physiological maturation process, due to the lack of physiological information in our data. The results of this study are therefore to be compared to other studies. The reported high value of the exponent at very low bodyweights (Fig. 2), is the result of rapid changes in propofol clearance with bodyweight at these young age ranges (Fig. 1, model IV). The lower value for the exponent at higher weight ranges, results from the accomplishment of the maturation process of propofol clearance (Fig. 2). According to the well-stirred model, hepatic clearance is determined by hepatic extraction ratio and liver blood flow. As propofol is a drug with a high extraction ratio, systemic clearance is driven by liver blood flow (36,37). While there are no good data on hepatic blood flow in relation to age, hepatic blood flow in infants was suggested to be comparable to adult values. Therefore maturation of metabolic capacity could be considered the cause of the rapid changes in clearance in the young individuals (38). For propofol, glucuronidation by the UGT1A9 isoenzyme is the major elimination pathway. UGT1A9 was reported to undergo an age-dependent quantitative differential regulation extending up to 24 months of age (39), and it was found that only part of the reduced glucuronidation rate was compensated by hydroxylation in neonates (40). Even though this cannot be proven, it can be speculated that the rapid change in the bodyweight-dependent exponent at low bodyweight ranges may be the result of the change in the capacity of the UGT1A9 isoenzyme.
In recent years, there has been a debate on how bodyweight and age, which are two correlated covariates in the paediatric population, should be included in population pharmacokinetic models. It has been proposed that the 3/4 allometric equation can be used to standardize drug clearance to the average adult bodyweight of 70 kg, after which age-based equations can be added to account for maturational differences in the younger populations compared to the older ones (1,41). These age based functions are needed because poor prediction performance of the 3/4 allometric model can be expected when scaling clearance to children under a certain age (15–17). However, this addition of age to the 3/4 allometric bodyweight based scaling function may result in collinearity. The effect of the collinearity on parameter estimates in nonlinear mixed effect models has already been studied and it was found that high collinearity between predictors, defined as data collinearity, increased the bias of the parameter estimates and enlarged the corresponding standard errors (20). More recently, it has been shown that when one of two correlated covariates that contain information about a model parameter is pre-selected over the other, the predictive performance of the resulting model may be diminished, unless the pre-selected covariate relationship reflects the true biological relationship (21). With the great amount of theoretical and experimental evidence against the 3/4 allometric model (6–12,14), and the risk of collinearity when introducing age to correct for deviations from this model, new scaling approaches are needed.
The bodyweight-dependent exponent model we described in this paper are of particular relevance for scaling clearance parameters to the youngest age ranges including infants, term and preterm neonates. Since in these age groups changes in the pharmacokinetics may be expected to be large, there is currently great interest in scaling clearance parameters from older populations to neonates or infants younger than 2 years of age (15,16,42). It is however uncertain whether the parameters of the bodyweight-dependent exponent model we developed for propofol can be generalized to other drugs. Propofol has very specific characteristics such as a high extraction ratio, direct glucuronidation and high lipophilicity. However, as Fig. 5 shows, the function is very flexible, and in our opinion the proposed model can be applied to other drugs provided data in young children are available to estimate the exact parameters of Eq. 5 of the bodyweight dependent exponent model for that drug.
CONCLUSION
In this study, we have developed a model for scaling propofol clearance over the entire human life-span with a single continuous bodyweight based equation, in which the exponent of the equation varies with bodyweight. The flexibility of this bodyweight-dependent exponent (BDE) model may increase the applicability of this type of models to scale clearance of other drugs over large parts of the human life-span. This function may provide an alternative for allometric scaling approaches in the extrapolation of drug clearances from older to younger human age-ranges.
ACKNOWLEDGMENTS & DISCLOSURES
We would like to thank Dr. Murat, and Dr. Kataria and Dr. Schnider (www.opentci.org) for kindly sharing their clinical data. We would also like to thank for Dr. Tamara van Steeg, Dr. Joost DeJongh, and Dr. Lia Liefaard for their technical support. This study was performed within the framework of Dutch Top Institute Pharma project number D2-104. All authors declare no conflict of interest.
Open Access
This article is distributed under the terms of the Creative Commons Attribution License which permits any use, distribution, and reproduction in any medium, provided the original author(s) and the source are credited.
ABBREVIATIONS
- BDE
bodyweight-dependent exponent
- EDTA
ethylenediaminetetraacetic acid
- NPDE
normalized prediction distribution errors
- RMSE
root mean square error
REFERENCES
- 1.Anderson BJ, Holford NH. Mechanism-based concepts of size and maturity in pharmacokinetics. Annu Rev Pharmacol Toxicol. 2008;48:303–32. doi: 10.1146/annurev.pharmtox.48.113006.094708. [DOI] [PubMed] [Google Scholar]
- 2.Kleiber M. Energy metabolism. nnu Rev Physiol. 1956;18:35–52. doi: 10.1146/annurev.ph.18.030156.000343. [DOI] [PubMed] [Google Scholar]
- 3.West GB, Brown JH, Enquist BJ. A general model for the origin of allometric scaling laws in biology. Science. 1997;276(5309):122–6. doi: 10.1126/science.276.5309.122. [DOI] [PubMed] [Google Scholar]
- 4.West GB, Brown JH, Enquist BJ. The fourth dimension of life: fractal geometry and allometric scaling of organisms. Science. 1999;284(5420):1677–9. doi: 10.1126/science.284.5420.1677. [DOI] [PubMed] [Google Scholar]
- 5.McMahon T. Size and shape in biology. Science. 1973;179(79):1201–4. doi: 10.1126/science.179.4079.1201. [DOI] [PubMed] [Google Scholar]
- 6.Agutter PS, Wheatley DN. Metabolic scaling: consensus or controversy? Theor Biol Med Model. 2004;1:13. doi: 10.1186/1742-4682-1-13. [DOI] [PMC free article] [PubMed] [Google Scholar]
- 7.Glazier DS. Beyond the ‘3/4-power law’: variation in the intra- and interspecific scaling of metabolic rate in animals. Biol Rev Camb Philos Soc. 2005;80(4):611–62. doi: 10.1017/S1464793105006834. [DOI] [PubMed] [Google Scholar]
- 8.Kolokotrones T, Van S, Deeds EJ, Fontana W. Curvature in metabolic scaling. Nature. 2010;464(7289):753–6. doi: 10.1038/nature08920. [DOI] [PubMed] [Google Scholar]
- 9.Dodds PS, Rothman DH, Weitz JS. Re-examination of the “3/4-law” of metabolism. J Theor Biol. 2001;209(1):9–27. doi: 10.1006/jtbi.2000.2238. [DOI] [PubMed] [Google Scholar]
- 10.Mahmood I. Application of fixed exponent 0.75 to the prediction of human drug clearance: an inaccurate and misleading concept. Drug Metabol Drug Interact. 2009;24(1):57–81. doi: 10.1515/DMDI.2009.24.1.57. [DOI] [PubMed] [Google Scholar]
- 11.Bokma F. Evidence against universal metabolic allometry. Funct Ecol. 2004;18:184–7. doi: 10.1111/j.0269-8463.2004.00817.x. [DOI] [Google Scholar]
- 12.White CR, Cassey P, Blackburn TM. Allometric exponents do not support a universal metabolic allometry. Ecology. 2007;88(2):315–23. doi: 10.1890/05-1883. [DOI] [PubMed] [Google Scholar]
- 13.Mahmood I. Prediction of drug clearance in children from adults: a comparison of several allometric methods. Br J Clin Pharmacol. 2006;61(5):545–57. doi: 10.1111/j.1365-2125.2006.02622.x. [DOI] [PMC free article] [PubMed] [Google Scholar]
- 14.Mahmood I. Prediction of drug clearance in children: impact of allometric exponents, body weight, and age. Ther Drug Monit. 2007;29(3):271–8. doi: 10.1097/FTD.0b013e318042d3c4. [DOI] [PubMed] [Google Scholar]
- 15.Peeters MY, Allegaert K, Blusse van Oud-Alblas HJ, Cella M, Tibboel D, Danhof M, et al. Prediction of propofol clearance in children from an allometric model developed in rats, children and adults versus a 0.75 fixed-exponent allometric model. Clin Pharmacokinet. 2010;49(4):269–75. doi: 10.2165/11319350-000000000-00000. [DOI] [PubMed] [Google Scholar]
- 16.Bjorkman S. Prediction of cytochrome p450-mediated hepatic drug clearance in neonates, infants and children: how accurate are available scaling methods? Clin Pharmacokinet. 2006;45(1):1–11. doi: 10.2165/00003088-200645010-00001. [DOI] [PubMed] [Google Scholar]
- 17.Edginton AN, Willmann S. Physiology-based versus allometric scaling of clearance in children: a comparison. J Clin Pharmacol. 2006;46(6):703. [Google Scholar]
- 18.Anderson BJ, Allegaert K, Van den Anker JN, Cossey V, Holford NH. Vancomycin pharmacokinetics in preterm neonates and the prediction of adult clearance. Br J Clin Pharmacol. 2007;63(1):75–84. doi: 10.1111/j.1365-2125.2006.02725.x. [DOI] [PMC free article] [PubMed] [Google Scholar]
- 19.Anand KJ, Anderson BJ, Holford NH, Hall RW, Young T, Shephard B, et al. Morphine pharmacokinetics and pharmacodynamics in preterm and term neonates: secondary results from the NEOPAIN trial. Br J Anaesth. 2008;101(5):680–9. doi: 10.1093/bja/aen248. [DOI] [PMC free article] [PubMed] [Google Scholar]
- 20.Bonate PL. The effect of collinearity on parameter estimates in nonlinear mixed effect models. Pharm Res. 1999;16(5):709–17. doi: 10.1023/A:1018828709196. [DOI] [PubMed] [Google Scholar]
- 21.Khandelwal A, Hooker AC, Karlsson MO. Influence of Correlated Covariates on Predictive Performance for Different Models. PAGE 20 Abstr 2220 http://www.page-meeting.org/default.asp?abstract=2220.
- 22.Knibbe CA, Krekels EH, van den Anker JN, DeJongh J, Santen GW, van Dijk M, et al. Morphine glucuronidation in preterm neonates, infants and children younger than 3 years. Clin Pharmacokinet. 2009;48(6):371–85. doi: 10.2165/00003088-200948060-00003. [DOI] [PubMed] [Google Scholar]
- 23.van den Broek MP, Huitema AD, van Hasselt JG, Groenendaal F, Toet MC, Egberts TC, et al. Lidocaine (lignocaine) dosing regimen based upon a population pharmacokinetic model for preterm and term neonates with seizures. Clin Pharmacokinet. 2011;50(7):461–9. doi: 10.2165/11589160-000000000-00000. [DOI] [PubMed] [Google Scholar]
- 24.Allegaert K, Peeters MY, Verbesselt R, Tibboel D, Naulaers G, de Hoon JN, et al. Inter-individual variability in propofol pharmacokinetics in preterm and term neonates. Br J Anaesth. 2007;99(6):864–70. doi: 10.1093/bja/aem294. [DOI] [PubMed] [Google Scholar]
- 25.Peeters MY, Prins SA, Knibbe CA, DeJongh J, van Schaik RH, van Dijk M, et al. Propofol pharmacokinetics and pharmacodynamics for depth of sedation in nonventilated infants after major craniofacial surgery. Anesthesiology. 2006;104(3):466–74. doi: 10.1097/00000542-200603000-00013. [DOI] [PubMed] [Google Scholar]
- 26.Murat I, Billard V, Vernois J, Zaouter M, Marsol P, Souron R, et al. Pharmacokinetics of propofol after a single dose in children aged 1–3 years with minor burns. Comparison of three data analysis approaches. Anesthesiology. 1996;84(3):526–32. doi: 10.1097/00000542-199603000-00006. [DOI] [PubMed] [Google Scholar]
- 27.Kataria BK, Ved SA, Nicodemus HF, Hoy GR, Lea D, Dubois MY, et al. The pharmacokinetics of propofol in children using three different data analysis approaches. Anesthesiology. 1994;80(1):104–22. doi: 10.1097/00000542-199401000-00018. [DOI] [PubMed] [Google Scholar]
- 28.Knibbe CA, Voortman HJ, Aarts LP, Kuks PF, Lange R, Langemeijer HJ, et al. Pharmacokinetics, induction of anaesthesia and safety characteristics of propofol 6% SAZN vs propofol 1% SAZN and Diprivan-10 after bolus injection. Br J Clin Pharmacol. 1999;47(6):653–60. doi: 10.1046/j.1365-2125.1999.00942.x. [DOI] [PMC free article] [PubMed] [Google Scholar]
- 29.Schnider TW, Minto CF, Gambus PL, Andresen C, Goodale DB, Shafer SL, et al. The influence of method of administration and covariates on the pharmacokinetics of propofol in adult volunteers. Anesthesiology. 1998;88(5):1170–82. doi: 10.1097/00000542-199805000-00006. [DOI] [PubMed] [Google Scholar]
- 30.Krekels EH, van Hasselt JG, Tibboel D, Danhof M, Knibbe CA. Systematic evaluation of the descriptive and predictive performance of paediatric morphine population models. Pharm Res. 2011;28(4):797–811. doi: 10.1007/s11095-010-0333-1. [DOI] [PMC free article] [PubMed] [Google Scholar]
- 31.Gepts E, Camu F, Cockshott ID, Douglas EJ. Disposition of propofol administered as constant rate intravenous infusions in humans. Anesth Analg. 1987;66(12):1256–63. doi: 10.1213/00000539-198712000-00010. [DOI] [PubMed] [Google Scholar]
- 32.Marsh B, White M, Morton N, Kenny GN. Pharmacokinetic model driven infusion of propofol in children. Br J Anaesth. 1991;67(1):41–8. doi: 10.1093/bja/67.1.41. [DOI] [PubMed] [Google Scholar]
- 33.Schuttler J, Ihmsen H. Population pharmacokinetics of propofol: a multicenter study. Anesthesiology. 2000;92(3):727–38. doi: 10.1097/00000542-200003000-00017. [DOI] [PubMed] [Google Scholar]
- 34.Ette EI, Williams PJ, editors. Pharmacometrics: The Science of Quantitative Pharmacology: Wiley; 2007.
- 35.Brendel K, Comets E, Laffont C, Laveille C, Mentre F. Metrics for external model evaluation with an application to the population pharmacokinetics of gliclazide. Pharm Res. 2006;23(9):2036–49. doi: 10.1007/s11095-006-9067-5. [DOI] [PMC free article] [PubMed] [Google Scholar]
- 36.Barash PG. Clinical anesthesia. 6. Philadelphia: Wolters Kluwer Health/Lippincott Williams & Wilkins; 2009. [Google Scholar]
- 37.Morgan DJ, Campbell GA, Crankshaw DP. Pharmacokinetics of propofol when given by intravenous infusion. Br J Clin Pharmacol. 1990;30(1):144–8. doi: 10.1111/j.1365-2125.1990.tb03755.x. [DOI] [PMC free article] [PubMed] [Google Scholar]
- 38.Alcorn J, McNamara PJ. Ontogeny of hepatic and renal systemic clearance pathways in infants: part I. Clin Pharmacokinet. 2002;41(12):959–98. doi: 10.2165/00003088-200241120-00003. [DOI] [PubMed] [Google Scholar]
- 39.Strassburg CP, Strassburg A, Kneip S, Barut A, Tukey RH, Rodeck B, et al. Developmental aspects of human hepatic drug glucuronidation in young children and adults. Gut. 2002;50(2):259–65. doi: 10.1136/gut.50.2.259. [DOI] [PMC free article] [PubMed] [Google Scholar]
- 40.Allegaert K, Rayyan M, de Hoon J, Tibboel D, Verbesselt R, Naulaers G, et al. Contribution of glucuronidation to tramadol disposition in early neonatal life. Basic Clin Pharmacol Toxicol. 2006;98(1):110–2. doi: 10.1111/j.1742-7843.2006.pto_336.x. [DOI] [PubMed] [Google Scholar]
- 41.Holford NH. A size standard for pharmacokinetics. Clin Pharmacokinet. 1996;30(5):329–32. doi: 10.2165/00003088-199630050-00001. [DOI] [PubMed] [Google Scholar]
- 42.Johnson TN, Rostami-Hodjegan A, Tucker GT. Prediction of the clearance of eleven drugs and associated variability in neonates, infants and children. Clin Pharmacokinet. 2006;45(9):931–56. doi: 10.2165/00003088-200645090-00005. [DOI] [PubMed] [Google Scholar]