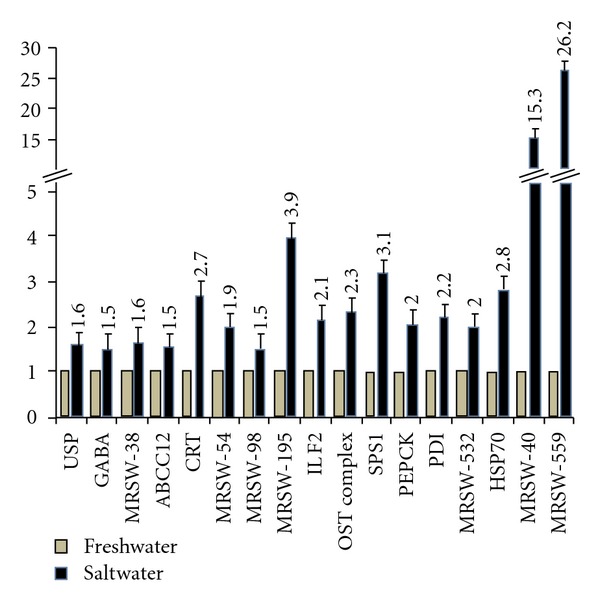
Figure 2.

The expression profiles of selected ESTs enriched from SSH cDNA library by quantitative real-time polymerase chain reaction (qPCR). The qPCR data for all ESTs was normalized with RPL8 as reference gene. The qPCR data shows the relative gene expression levels in the salt water-stressed gill of M. rosenbergii over unstressed gill (default setting as 1 in each case). The clones MRSW-40 and MRSW-559 were significantly up-regulated in the tune of about 15- and 26-fold, respectively. The rest of the clones were up-regulated in the tune of ≥1.5-fold. The numbers on top of each bar for salt water-treated gill represent fold changes in expressions relative to the expressions in freshwater-treated gill. The data represents the average of three independent (each in duplicate) experiments. USP, ubiquitin-specific protease; GABA, γ-aminobutyric acid; ABCC12, ATP-binding cassette protein C12; CRT, calreticulin; ILF2, interleukin enhancer binding factor 2; OST complex, oligosaccharyltransferase complex; SPS1, selenophosphate synthetase 1; PEPCK, phosphoenolpyruvate carboxykinase; PDI, protein disulphide isomerase; HSP70, heat shock protein 70.
