Abstract
Deformable image registration (DIR) is increasingly used in radiotherapy applications and provides the basis for a previously described model of patient-specific respiratory motion. We examine the accuracy of a DIR algorithm and motion model with respiration-correlated CT (RCCT) images of software phantom with known displacement fields; physical deformable abdominal phantom with implanted fiducials in liver; and small liver structures in patient images. The motion model is derived from a principal component analysis that relates volumetric deformations with the motion of the diaphragm or fiducials in the RCCT. Patient data analysis compares DIR with rigid registration as ground truth: the mean ± standard deviation in 3D discrepancy in liver structure centroid position is 2.0 ± 1.0 mm. DIR discrepancy in software phantom is 3.8 ± 2.0 mm in lung and 3.7 ± 1.8 mm in abdomen; discrepancies near chest wall are larger than indicated by image feature matching. Marker 3D discrepancy in physical phantom is 3.6 ± 2.8 mm. The results indicate that visible features in the images are important for guiding the DIR algorithm. Motion model accuracy is comparable to DIR, indicating that two principal components are sufficient to describe DIR-derived deformation in these data sets.
Keywords: Deformable image registration, image-guided radiation treatment, organ motion, lung cancer, liver cancer
1. INTRODUCTION
Deformable image registration is increasingly used in radiotherapy applications such as 4D treatment planning, adaptive treatment planning and respiration motion-corrected cone-beam CT. 4D planning incorporates patient-specific motion information, derived from respiration-correlated CT (RCCT) and deformable image registration (DIR), explicitly into the treatment planning process [1]. The methods rely on DIR-derived displacement fields to specify the trajectory of each voxel between image sets in the RCCT. Dieterich et al [2] briefly review various approaches to 4D planning. Some investigative approaches to adaptive treatment planning involve dose calculation to evaluate and accommodate patient changes during fractionated treatment. Dose distributions are calculated from CT or CBCT at treatment, then warped back to the planning CT in order to compute cumulative dose and re-optimize the treatment plan [3, 4, 5, 6]. DIR is an important component in methods to correct for respiration-induced motion artifacts in CBCT [7, 8, 9, 10]. Because these applications affect a patient’s treatment plan and positioning at treatment, the accuracy of DIR has bearing on the dose delivered to the target and surrounding normal tissue, so it is important to investigate the accuracy of DIR.
The applications assume the DIR-derived displacement field to be correct throughout the volume of interest (VOI); however, studies of DIR accuracy have focused primarily on high-contrast features in lung. There have been limited studies in abdomen, where the low image contrast is more challenging. This is particularly relevant in CT images of liver, which contain relatively large featureless regions, but is also relevant in featureless regions in lung. A major difficulty in testing accuracy in such regions within patient images is the absence of a ground truth for comparison. Numerical simulations and physical deformable phantoms are valuable in that they provide a known ground truth for evaluating DIR accuracy, especially in regions with little or no features. Physical phantoms additionally take into consideration the entire image acquisition process. Clinical data sets are more realistic but ground truth is approximate and relies on visible features. Thus the different types of data sets are complementary and study different aspects of DIR performance [11].
Different evaluation methods for deformable image registration have been reported in the literature. Recently, a multi-institution deformable registration accuracy study (MIDRAS) has been conducted to compare the performance of various algorithms in lung, liver and prostate sites [12]. The bronchial bifurcations in the lungs, calcificatons in the heart and the aorta were identified by a radiation oncologist for comparison to the deformation analysis. The results showed that the majority of algorithms performed well for lung and liver cases with mean absolute errors of 2.5 mm or less in each direction, but with maximum errors up to 13 mm. Serban et al.[13] studied a lung phantom in which a compressive piston was used to mimic respiration-induced deformation. Displacements of implanted landmarks (i.e. Nylon wires and Lucite beads, emulating vascular and bronchial bifurcations) and mock tumor were studied and showed the 3D vector mean and standard deviation (SD) registration accuracy to be 0.5 ± 0.4 mm for landmarks, 0.4 ± 0.1 mm for tumor and 1.0 ± 0.8 mm for lung. Kashani et al.[14] evaluated eight DIR algorithms from six institutions using a deformable phantom with characteristics similar to lung. The phantom consisted of an anthropomorphic plastic chest wall, skeleton, and a compressible section containing tumor-simulating spheres and small plastic markers. The average 3D distance error was from 1.5 ± 1.3 to 3.9 ± 3.0 mm depending on the algorithm, with maximum errors between 5.1 and 15.4 mm, which occurred in areas of uniform image intensity but large local deformation discontinuities. Coselmon et al.[15] evaluated a mutual information-based DIR algorithm in lung images of eleven patients, each of whom had sequential CT scans at breath-held normal inspiration and expiration states. The alignment accuracy was defined as the standard deviation of the difference between the actual and predicted positions, and found to be 3.1 mm and 3.6 mm in AP (anterior–posterior) and SI (superior–inferior) directions, respectively. Zhong et al. [16] analyzed two DIR algorithms (Demons and B-Spline) based on two numerical phantoms of lung and prostate. In each phantom, the vector displacement field was computed using a finite element method, with the force vector applied on the diaphragm in lung phantom and applied to the center of the bar that attached to the bladder in prostate phantom as the known input and the resultant displacement serving as ground truth, to quantify the displacement error in the DIR. The displacement mean errors were reduced by more than 50% when the registrations were evaluated in the lung only relative to the errors across the entire image (the DIR was performed in the entire image). The results suggest that the error is higher in regions outside lung because of relatively fewer features to guide the registration.
We have previously described a patient-specific motion model and its application to predicting respiration-induced organ deformations without assuming repeatable breath cycles [17], and to motion-corrected CBCT [10]. In both papers, the motion model is derived from a principal component analysis of the DIR between images at different motion states, and can be used to predict 3D deformation from the position and direction of motion (i.e., inspiration or expiration) of the diaphragm or implanted fiducials in the images. It can thus predict deformations from images for which DIR is not possible, such as fluoroscopy, cine radiographs acquired during treatment delivery, or CBCT reconstructed from sparse projections [10]. The model assumes that two principal components are adequate to accurately describe the deformations between motion states, such that its accuracy is comparable to the DIR from which it is derived. Zhang et al [17] have shown this assumption to be valid in a limited number of patient cases in lung but further confirmation is required. Further, it has not been evaluated in abdomen, where respiration-induced deformation may differ from lung. Determination of the accuracy of the motion model and the underlying DIR algorithm is essential to evaluate the model’s validity for predicting respiration-induced deformations and for motion-corrected CBCT.
Our study examines DIR and motion model accuracy in CT images of an analytical (software) phantom and a physical deformable phantom with known ground truths, and in patient CT images in abdomen. The software phantom includes thoracic and abdominal regions, and provides a known ground truth throughout the CT volume. Thus it allows comparison of DIR accuracy between regions with varying amounts of visible features. The physical deformable abdominal phantom and patient abdominal images provide further evaluation of DIR in regions of low-contrast tissue.
2. METHODS
2.1 Evaluation of deformable registration
The DIR algorithm evaluated in this paper is a fast free form registration via calculus of variations [18]. The method minimizes an energy function consisting of pixel gray-scale similarity and smoothness requirements to map corresponding voxels between two CT image sets:
| (1) |
where I A (x⃗) and IB (x⃗) are the intensity of images A and B at point x⃗, u⃗ is the vector displacement field, and λ is an adjustable parameter. The first term of describes the similarity between images A and B, while the second term is a smoothing term that limits sharp gradients in u⃗. The displacement field is found by solving the Euler-Lagrange equations
| (2) |
The registration is done gradually from low-resolution (32×32, 128 iterations) to fine-resolution (256×256, 16 iterations) using full CT number range without additional image pre-processing. We evaluate DIR accuracy in three types of respiration-correlated CT (RCCT) image sets: (1) synthetic images derived from the 4D NURBS-based cardiac torso (NCAT) phantom; (2) physical deformable abdominal phantom with implanted radiopaque markers in liver; and (3) patient image sets in abdomen.
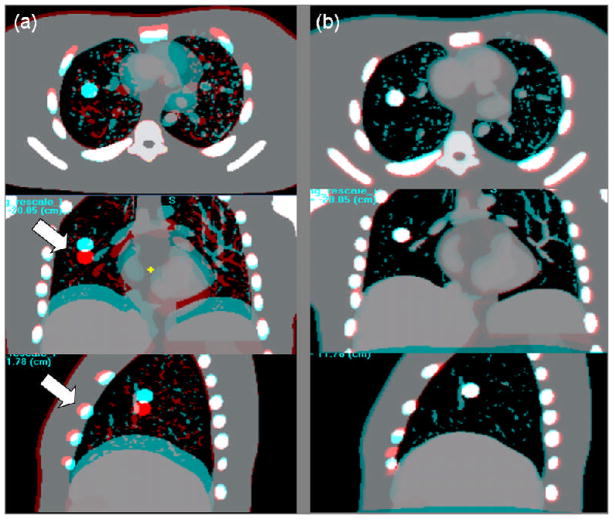
The NCAT phantom (figure 1) is a software package that provides a realistic dynamic model of the human anatomy [19]. Organ shapes are constructed from non-uniform rational B-splines (NURBS) surfaces, based on the 3D Visible Human CT dataset. The software models respiratory motion using diaphragmatic contraction and chest expansion, and generates volumetric CT image sets at user-specified intervals over the respiratory cycle, referred to here as motion states. In addition, it provides the voxel displacements between consecutive image sets within the lungs and abdomen, thus providing a ground truth for comparison. One limitation of the model is that although it realistically models and defines features within the lung, anatomic features are less accurate within the abdominal organs and elsewhere outside of the lung region. The NCAT simulation in this study uses a 5 s respiratory period, 2 cm diaphragm excursion, 0.5 cm anterior–posterior (AP) chest excursion, and generates 10 motion states at 0.5 s intervals. The cumulative ground truth displacements over the 6 simulated motion states are compared to the corresponding results from DIR (EE to EI) (5 registrations, between motion states 1–2, 2–3, …, 5–6). The lungs and abdominal region are manually segmented for purposes of determining DIR accuracy separately in the two regions.
Figure 1.
NCAT phantom. Red-blue overlay of coronal images at end expiration and end inspiration motion states a) before and b) after deformable image registration. Arrows show motion-induced differences in the lung and in the chest wall before DIR.
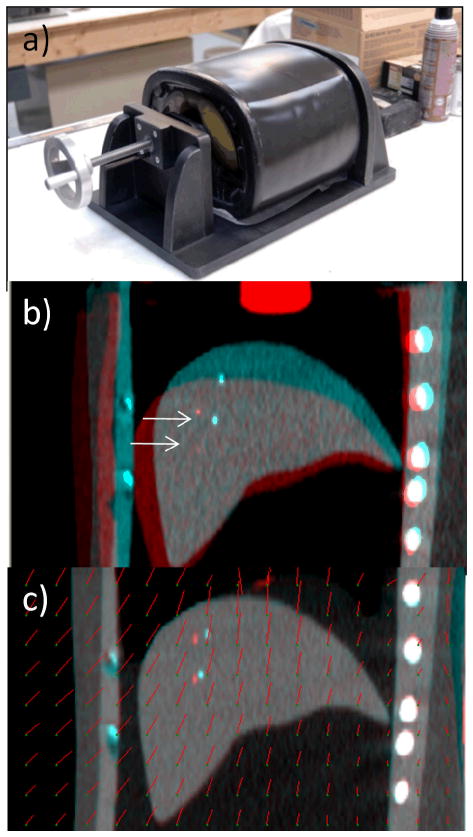
The physical deformable abdominal phantom (figure 2) is custom made (CIRS, Norfolk VA), containing partial lungs, liver and surrounding tissue composed of a water-based polymer that is CT compatible. Radiopaque markers with diameter 1 mm and length 5 mm are embedded inside the liver. The position of a diaphragm-shaped piston is varied to simulate organ deformation during the breathing cycle. The phantom walls are flexible to allow deformation. In our experiment, the piston is set to 6 positions varying over 3.5 cm, thus simulating a range of deformations similar to clinical case. In 4 positions, the piston was successively compressed and in the other 2 positions, the piston was withdrawn. The piston position was 0, 10, 20, 30, 35 and 15 mm relative to the uncompressed state. DIR calculates a voxel-dependent displacement that deforms the reference image (at the uncompressed state) into the image at each deformation (compressed) state. Evaluation of DIR in liver compares the predicted and observed displacements of 5 markers as the position of the piston is varied. There is uncertainty in identifying the marker positions in the z direction due to the slice thickness which is 2.5 mm. The marker may appear on 1 or 2 slices, thus we estimate the uncertainty is 1.2 mm which is half of the slice thickness and the one-standard-deviation uncertainty in actual marker displacement is estimated to be 1.7 mm.
Figure 2.
(a) Physical deformable abdominal phantom. (b) Overlay of coronal view CT images of phantom in an uncompressed (blue enhanced) and compressed (red enhanced, piston position 30 cm) state. Arrows indicate the markers in the two images. (c) Overlay of uncompressed and compressed phantom images after deformable image registration (compressed state deformed to match uncompressed). Red line segments indicate the magnitude and direction of displacement at the point of the green dots.
The displacements of anatomical landmarks in liver in respiration-correlated CT images of patients are also evaluated (Lightspeed, GE Healthcare, Waukesha, WI). The landmarks consisting of dilated bile ducts, common hepatic duct, surgical clips, stent in common bile duct and liver cysts are identified in images at end inspiration (EI) and end expiration (EE). A local rigid registration from EI to EE is first performed in a small cubical volume of interest enclosing the landmarks (typically 4cm on a side or less), and the displacements are used as ground truth. We assume that there is little deformation in a VOI of this size and confirm this by inspecting the image match agreement following rigid registration. The DIR is performed using a VOI that encompasses the entire CT image volume. The corresponding DIR displacements from EI to EE are compared to the ground truth. Seven patients were studied, each with two or more visible landmarks inside the liver. By repeating the registration on 10 randomly selected landmarks, the estimated mean repeatability of the rigid registration for 10 structures is 1.8 mm, with a standard deviation of 1.0 mm.
2.2 Evaluation of patient-specific motion model
The patient-specific respiratory motion model has been described in more detail previously [17], and we summarize it here. The model is derived from a patient’s RCCT image set and predicts the 3-dimensional deformations from a reference image at EE and the displacement and direction of motion of a mobile surrogate, such as the diaphragm or implanted fiducial, relative to its position in the reference image. The direction of motion, which serves to model any hysteresis in the RCCT, is determined from the surrogate’s current position and its (approximately one-third cycle) prior position in the RCCT set. A principal component analysis (PCA) is performed to parameterize the 3D deformation field in terms of the surrogate motion, thereby enabling modeling of cycle-to-cycle variations in motion state as well as interfraction variations. Our previous study in a limited number of lung cancer patient cases found that model-predicted images calculated from the first two principal components accurately reproduced anatomic motion observed in the actual RCCT images [17].
In the present study, we evaluate the adequacy of two principal components to accurately model deformations by comparing the motion model and DIR using the 3 types of image sets described in the previous section. In each image set, the model is calibrated by applying DIR between a reference image set at EE and each of the other images at different motion states. The model calibration uses 10 motion states (including reference) in the NCAT image set, 6 in the physical phantom image set, and 10 in the patient RCCT image sets. In most image sets, diaphragm apex displacements in the superior–inferior direction and relative to the reference image are used as surrogate signals. In one clinical case where the diaphragm is not completely within the image field-of-view, an implanted marker is used instead as surrogate signal. Following PCA, the first two principal components are selected to yield a model-predicted displacement field at the desired motion state.
Evaluation of the motion model in NCAT phantom compares the model-predicted displacement field between the EE and EI motion states within the lungs and abdominal cavity with the ground truth displacement field generated directly from the NCAT program. Evaluation in physical phantom compares the model-predicted displacements with the observed displacements of the 5 markers. In the patient images, the model-predicted displacements of visible landmarks in liver between EE and EI motion states are compared to the DIR prediction and to the rigid registration as ground truth.
3. RESULTS
3.1 Evaluation of deformable image registration
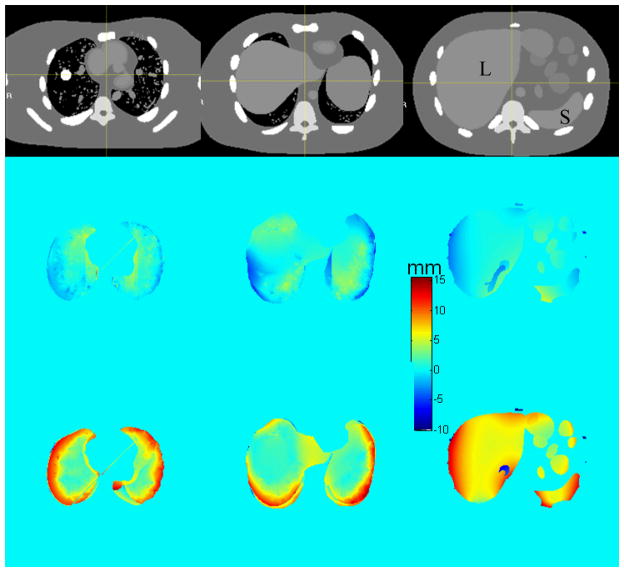
Figure 3 shows color-wash plots of the difference in NCAT-phantom (ground truth) and DIR-predicted displacement fields between EE and EI motion states, for different axial cuts through the thorax and abdomen (top row). Middle and lower rows show the discrepancy in the anterior–posterior (AP) and superior–inferior (SI) directions. The mean discrepancy (over voxels) and 95 percentile discrepancy (i.e., 95% of voxels are below this value) are summarized in Table 1. The mean discrepancy (between the software phantom and the DIR results) of the 3D displacements is 3.8 ± 2.0 mm in lung and 3.7 ± 1.8 mm in abdomen. Since the NCAT software provides voxel trajectories only within the lungs and abdominal cavity, the evaluation is focused in those areas. We note two regions where larger discrepancies occur. The first is in portions of lung adjacent to the chest wall, and portions of liver and spleen adjacent to the ribs. The NCAT displacement field is discontinuous at these boundaries, changing from primarily SI motion inside the organs to primarily AP motion in the chest wall and ribs, whereas the DIR displacement field varies continuously owing to the smoothness term in the cost function. The second region of larger discrepancy is in the inferior part of the liver interior, particularly in the SI direction (Figure 3 right column). This is likely a result of the lack of visible features inside the liver to guide the DIR. Although the EE and EI image overlay following DIR shows good agreement (Figure 1), the comparison of displacement fields shows evidence of larger disagreement.
Figure 3.
Discrepancy between NCAT-phantom (ground truth) and DIR-predicted displacements, in AP (middle row) and SI (bottom row) directions. Positive discrepancy denotes that NCAT displacement is larger. Top row: corresponding axial CT slices. Spherical tumor is visible in the right lung. Symbols “L” and “S” denote liver and spleen.
Table 1.
Mean EE-EI displacement discrepency of voxels inside thorax (lungs) and abdominal organs of NCAT phantom. 95% CL denotes ninety-five percentile discrepancy (i.e., 95% of voxels are below this value) between NCAT (ground truth) and DIR-predicted voxel displacements and between NCAT (ground truth) and the model prediction.
| NCAT-DIR | NCAT-model | |||||
|---|---|---|---|---|---|---|
| LR (mm) | AP (mm) | SI (mm) | LR (mm) | AP (mm) | SI (mm) | |
| Thorax Mean | 0.5 | 0.8 | 3.6 | 0.5 | 0.8 | 3.0 |
| Abdomen Mean | 1.0 | 0.8 | 3.3 | 0.9 | 0.8 | 3.3 |
| Thorax 95 CL | 2.2 | 2.6 | 7.6 | 2.1 | 2.5 | 7.0 |
| Abdomen 95 CL | 2.4 | 2.1 | 7.5 | 2.4 | 2.3 | 7.8 |
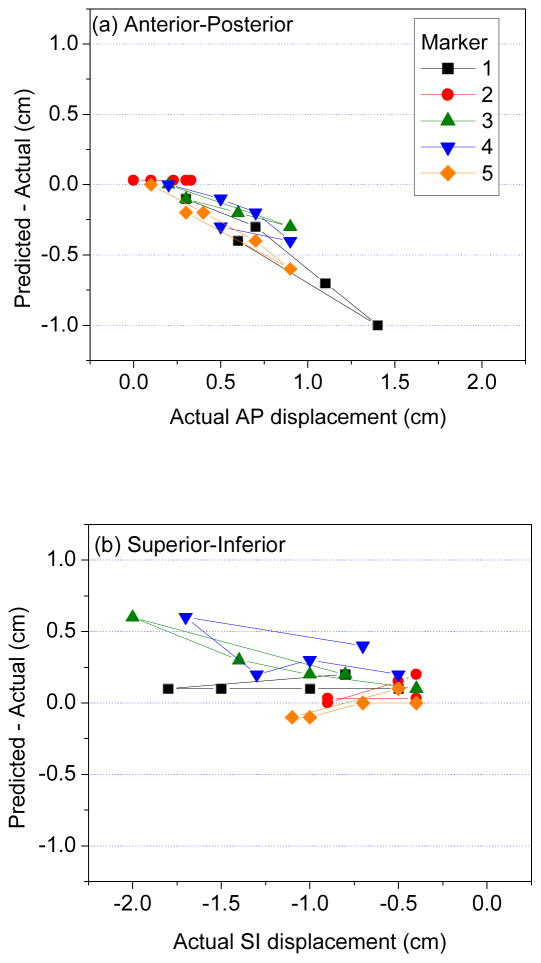
Results in physical phantom further illustrate the point that DIR discrepancy in the liver interior may be larger than anticipated. Figure 2(b) shows CT image overlays of the phantom at two different compression states. The two markers visible in the coronal image are displaced 22 mm and 18 mm (3D distance) between the two states. Following DIR, the agreement at the liver boundary between the two images is very good (Figure 2c); however, there is a discrepancy of 7 mm and 4 mm between the DIR-predicted (in red) and actual (blue) marker positions. Figures 4(a) and 4(b) show the difference between DIR predicted and actual marker position vs actual displacements of implanted radiopaque markers in liver of the physical phantom in the AP and SI directions, respectively. The discrepancy (3D distance) between DIR-predicted and actual displacement over the five markers ranges 0–11 mm. The mean ± standard deviation in 3D discrepancy is 3.6 ± 2.8 mm. The mean and standard deviation of the actual 3D marker displacement is 11.7 ± 5.8 mm. The disagreement is proportional to the degree of deformation, corresponding to diaphragm excursion from 10 mm (i.e., between piston positions 0 and 10 mm) to 32 mm (piston positions 0 to 35 mm). The plots show that DIR underestimates the actual displacement in the AP direction. In the SI direction, DIR overestimates the actual displacements of markers close to the piston (which has larger deformation) and underestimates displacements of markers in the inferior portion of liver.
Figure 4.
Discrepancy (DIR predicted–actual displacement) vs actual displacements of implanted radiopaque markers in physical deformable phantom, in the (a) anterior–posterior, and (b) superior–inferior directions. In (a), positive displacement is in anterior direction; in (b), negative displacement is in inferior direction.
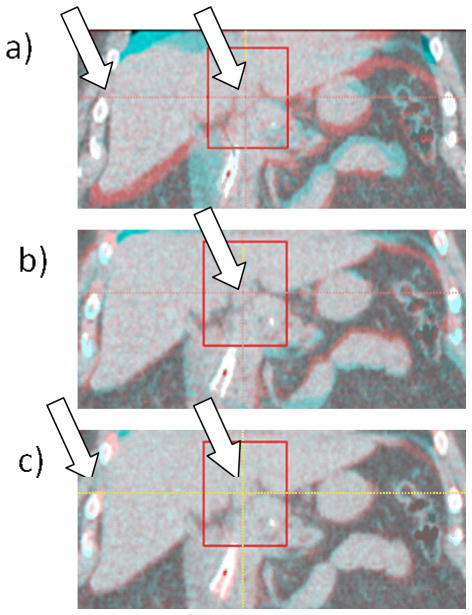
Figure 5 shows an example of landmark bile duct in patient #1. Figure 5(a) shows the EE-EI overlay of a coronal section before registration with the landmark and surrounding VOI indicated with a rectangle. Left arrow indicates a region of discontinuity in displacement between ribs and liver: Note that the ribs are well aligned between the EE and EI images, whereas the liver shows sizable displacement in the SI direction. Figure 5(b) shows the overlay after rigid registration and Figure 5(c) shows the overlay after deformable registration. There is approximately 10 mm difference in landmark position between EE and EI. Following rigid registration the overlay image shows only small discrepancies in landmark position and shape (Figure 5b), indicating that the assumption of negligible deformation within the VOI is reasonable. The overlay image following DIR also shows that the discrepancies within the VOI are reduced (Figure 5c). Note that the liver is well aligned whereas the ribs show some misalignment (left arrow), owing to the limited ability of the DIR to handle sharp gradients in the displacement field.
Figure 5.
Example of a bile duct used as a landmark in patient #1. a) EE–EI overlay of a coronal section before registration and the surrounding VOI indicated with a rectangle; left arrow indicates a discontinuity in displacement between ribs and liver; b) EE–EI overlay after rigid registration; c) EE–EI overlay after deformable registration. The liver is aligned well but the ribs are not (left arrow), which is due to the discontinuity in displacement not fully accounted for by the DIR.
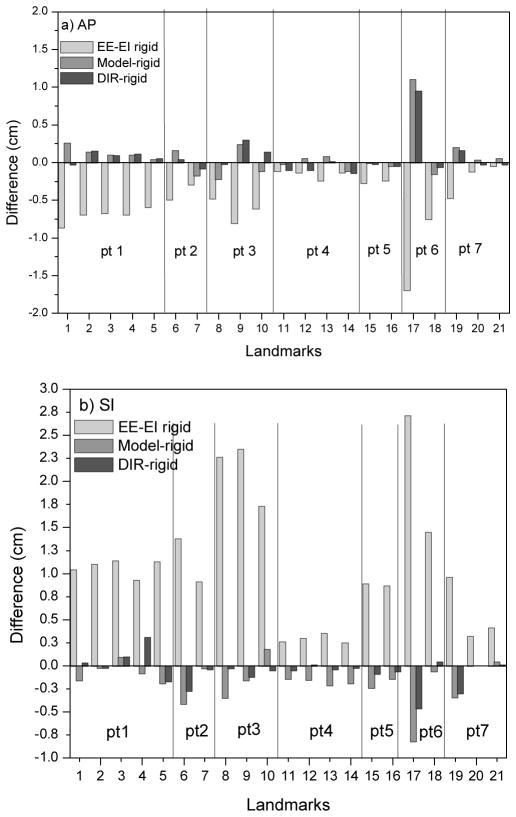
Figure 6 summarizes landmark motion and DIR accuracy in patient images. The mean (over patients and landmarks) EE-to-EI displacement (light gray bars) in the AP direction is 5.0 mm and range from 0.5 mm to 19.7 mm; the mean SI displacement is 10.8 mm and ranges from 2.5 mm to 23.6 mm. There is good agreement between the local rigid registration (ground truth) and the DIR results: mean ± standard deviation discrepancy (21 landmarks 7 patients, dark gray bars) is 0.6±0.4 mm (LR), 1.2±2.0 mm AP and 1.0±1.2 mm SI. All but one discrepancy is less than 5 mm; the largest discrepancy is of a liver cyst landmark in Patient 6 and is 9 mm in the AP direction. We also note that this landmark exhibits the largest EE-to-EI motion among those measured: 17 mm AP and 23.6 mm SI.
Figure 6.
EE-EI landmark displacement (light gray bars) in liver in 7 patients, in (a) AP and (b) SI directions, using rigid registration in a small VOI around the landmarks as ground truth. Dark gray bars show discrepancy between DIR-predicted and rigid registration displacements; medium gray bars show discrepancy between model-predicted and rigid registration displacements.
3.2 Evaluation of motion model
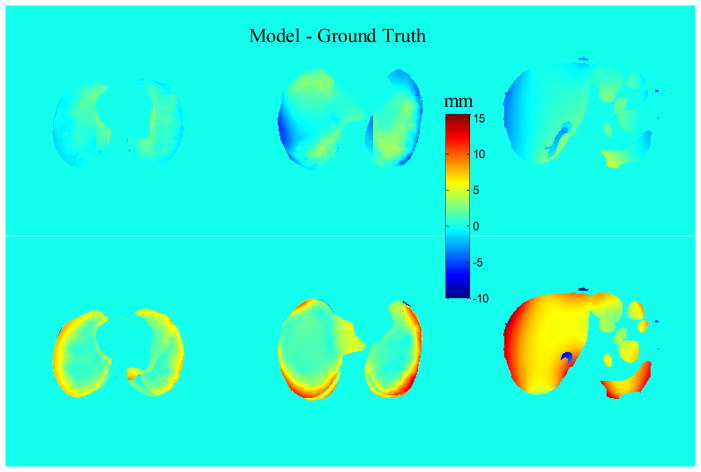
Figure 7 shows color-wash plots of the discrepancy in displacement between the motion model and ground truth in the NCAT phantom, for the same axial slices as in Figure 3. Comparison of Figures 3 and 7 shows that the discrepancies in the motion model are similar to those for DIR. The discrepancy of the 3D displacements between NCAT software and motion model is 3.3 ± 2.0 mm in lung and 3.7 ± 1.9 mm in abdomen. The result is slightly lower than for DIR in lung and similar in abdomen. This indicates that the assumption that the use of only two principal components does not degrade the accuracy in predicting deformation. This is further supported in Table 1, which compares mean and 95% confidence limit discrepancies of DIR and model predictions relative to ground truth.
Figure 7.
Discrepancy in EE-EI displacements between motion model and NCAT ground truth in AP (upper row) and SI (lower row) directions.
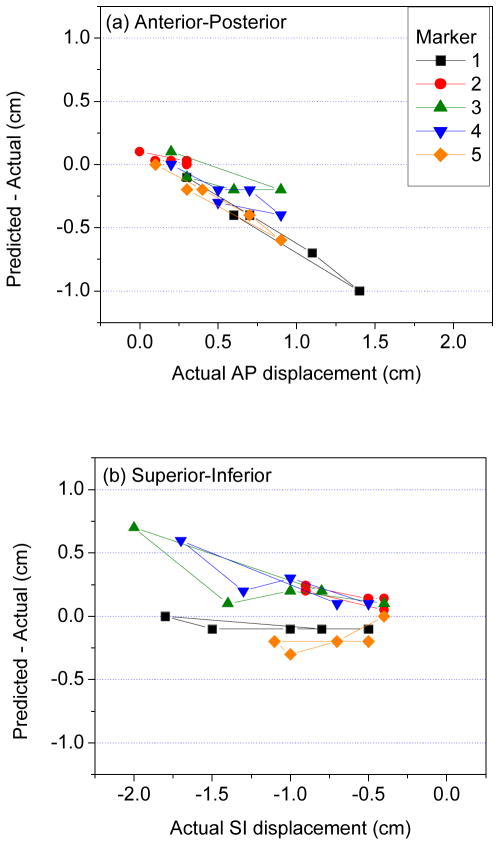
Figure 8(a) and 8(b) show the difference between motion model predicted and actual marker vs actual displacements of implanted radiopaque markers in liver of the physical phantom in the AP and SI directions, respectively. The mean discrepancy (3D distance) between Model-predicted and actual marker displacement is 3.8 mm and the standard deviation is 2.7 mm. Disagreement appears proportional to the degree of deformation and this behavior is explained in the Discussion section. The results are comparable to the DIR results (3.6 ± 2.8 mm) and indicate that motion model with two principal components is preserving accuracy.
Figure 8.
Discrepancy (Motion Model predicted–actual displacement) vs actual displacements of implanted radiopaque markers in physical deformable phantom, in the (a) anterior–posterior, and (b) superior–inferior directions.
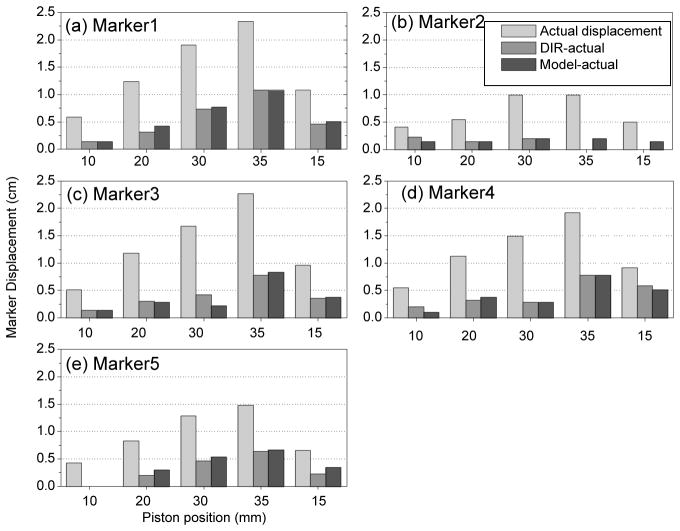
Figure 9 summarizes model accuracy using landmarks in physical deformable phantom and compares it to DIR accuracy. The mean ±standard deviation discrepancy between model prediction and ground truth is 0.8±1.2 mm LR, 1.4±1.7 mm AP and 2.0±2.4 mm SI. This discrepancy is slightly larger than that for DIR (see previous section). It is consistent with the estimated repeatability of the rigid registration which is about 1.8 mm.
Figure 9.
EE-EI displacement (light gray bars), discrepancy between the DIR-predicted and actual observed displacements (medium gray) and discrepancy between model-predicted and actual displacements (dark gray) of 5 markers (a through e, each subplot stands for one marker) vs. piston position (10, 20, 30, 35 and 15 mm) in the physical deformable phantom.
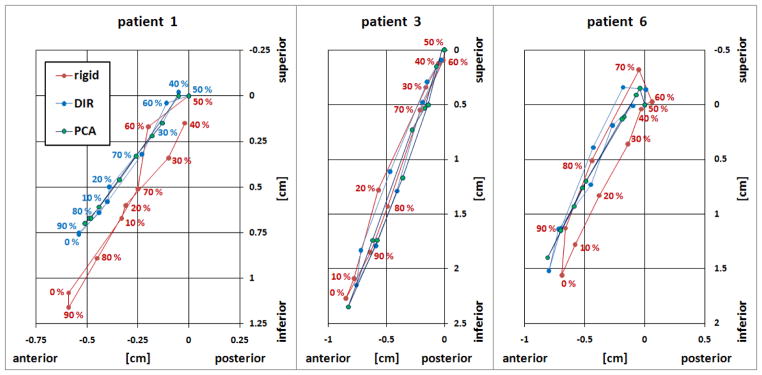
Figure 10 shows the landmark motion trajectories in the SI–AP plane in patients 1, 3 and 6, measured over the RCCT image set. Red indicates the rigid registration results, blue indicated DIR reults and green indicates model prediction results. DIR and motion model show very similar motion trajectories, whereas the trajectories from the rigid registation of patients 1 and 6 are shifted approximately 2 mm in the SI direction. This is consistent with the uncertainty in the reproducibilty of rigid registration and the RCCT resolution (2.5 mm slice spacing).
Figure 10.
Landmark motion trajectories in the SI(z)–AP(y) plane in patients 1, 3 and 6, measured over 10 RCCT images. 0% phase (as measured by the external respiratory motion monitor) corresponds to end inspiration. Displacements are relative to 50% phase image. Red indicates the rigid registration results, blue indicates DIR results and green indicates model prediction results.
4. Discussion and Conclusions
Prior studies of DIR accuracy have been limited mostly to high-contrast features in lung. This study examines the accuracy of a particular DIR method (fast free-form [18]) in software and physical deformable phantoms with known ground truth, including regions where visible features are absent. The study also investigates DIR in patient images in abdomen, where low contrast features are more challenging to DIR. Visible internal features in the CT images are important for guiding the deformable registration method. In the NCAT phantom, there is larger discrepancy between DIR and ground truth in the lower liver and spleen than in lung, which indicates that accuracy is less in regions where features are lacking. DIR is less accurate at regions of sharp gradients in the displacement field. In the case of the NCAT phantom, there is a discontinuity at the lung-chest wall and abdomen-chest wall boundaries, where the ground truth motion changes abruptly from primarily SI in the lung and abdomen to AP in the chest wall. As stated previously, the smoothness term in the fast free-form DIR cost function limits the ability to represent such abrupt changes. Many DIR algorithms assume that the displacement field is smoothly varying and thus exhibit this limitation. Methods have been proposed that produce discontinuous vector fields at the boundaries of anatomical subregions, by performing registration independently on each subregion [20]. We have not examined such an approach in the current study. Instead, our results serve to underscore the potential for deformation inaccuracy near these boundaries when using many commonly available DIR algorithms. We also point out that examination of deformed and target images may show good agreement of visible features as in Figure 1(b), but may not reveal disagreement near the chest wall as indicated by comparison of displacement fields. Our phantom results are consistent with Zhong’s findings [16] that DIR accuracy is better in regions with visible features.
The fast free-form DIR in physical phantom shows larger discrepancies in the AP direction (Fig. 4a) than in the SI direction (Fig. 4b). This behavior can be better understood by examining Eq. (2), which represents the driving force of the iterative adjustment of the displacement field u⃗ [18]. Since in most of the phantom liver volume there is an absence of features (Fig. 2), then ∂I B(x⃗ + u⃗)/∂u⃗ ≈ 0 in those regions, or the two images have matched intensity (IB(x⃗ + u⃗) − IA(x⃗) ≈ 0). In either case, the second term of Eq. (2) is zero and the displacement field is interpolated from the surrounding region, which is driven by image matching at the liver boundary and is primarily in the SI direction. The volume and number of implanted fiducials are small, thus their contribution to the determination of u⃗ is small relative to that for the entire liver. The results indicate that the particular DIR method examined here is relatively insensitive to small and sparsely spaced image features that are within otherwise featureless regions. As a consequence, the error in predicted displacement is approximately proportional to the actual displacementfor some markers, as seen in Figure 9.
There are few reported evaluations of DIR in abdominal CT images. Our results in patient images show that reasonable results can be obtained in abdomen although the image feature contrast is low relative to lung. The range of absolute discrepancy of features (except one outlier) in our study is 0.1–1.8mm (LR), 0.1–3.0 mm (AP) and 0.0–3.1 mm (SI). This is comparable in magnitude to Ref [6], which uses vessel bifurcations as landmarks and found the range of average absolute error in lung 4DCT to be 0.6–1.2 mm (LR), 0.5–1.8 mm (AP), and 0.7–2.0 mm (SI). In obtaining these results, we have assumed that rigid registration in a small VOI of approximately 4 cm on a side is sufficiently accurate to serve as a ground truth. As we have noted in the NCAT results, there may be large gradients in the deformation field at the boundary between abdomen and rib cage, which may render the rigid registration less accurate. For example, landmark 17 in patient 6 is 1 cm from the rib cage. The discrepancy between the measurement and prediction is large for this case. A second potential inaccuracy is that there may be rotations present that have not been included in the rigid registration. By rerunning the rigid registration with rotations enabled, we find that rotations in most cases are less than 3 degrees. The resultant maximum displacement of a voxel 2 cm from the VOI center is 1 mm, which is well within the previously stated mean repeatability of the rigid registration (1.8 mm). Rigid registration of one case yields a rotation of 5 degrees (patient 3 in Fig. 6), corresponding to a maximum displacement of 2 mm.
The phantom results have shown that accuracy is less in regions where features are lacking. These findings suggest that radiotherapy applications of DIR methods such as fast free-form to 4D treatment planning, which assume DIR is accurate throughout the volume, should be used with caution in regions lacking visible features. A possible way to incorporate variable DIR accuracy in 4D planning is to assign different uncertainties to voxel trajectories that are derived from the displacement fields, depending on the voxel location in the image and the expected DIR accuracy in that neighborhood, as determined from analytical phantom studies such as NCAT. The 4D planning process could be repeated with different voxel trajectories, representing the likely range of uncertainty in the displacement field. Vaman et al have described a method of estimating DIR errors in an RCCT image set [21]. The method uses PCA to separate eigenmodes containing physical motion from those containing errors from the imaging and registration process.
In this study we have also examined the accuracy of a patient-specific model of respiration-induced motion by comparing its predicted deformation from surrogate signals with ground truth and with DIR prediction in analytical, physical phantom and patient image sets. The model is derived from DIR between respiration-correlated images, followed by a principal component analysis which relates the first two principal components to the position and direction of motion of the diaphragm or fiducial. It is important to diagnose the relative contributions of each (DIR vs choice of two principal components) to discrepancies with measured deformations. This will indicate where efforts should be focussed to improve accuracy. The results show the motion model accuracy to be comparable to DIR in all three types of images, indicating that the assumption of two principal components is sufficient to describe the DIR-derived deformation. Zhang’s study [17] examined model accuracy in lung and was limited to four patients. Our study extends the investigation to abdomen, in phantom and in 7 patients; thus, it examines the ability of the motion model to accommodate diverse types of deformation represented by the different data sets. The relevance of these findings is that the degrees of freedom needed to represent respiration-induced deformation can be greatly reduced by means of PCA, thus facilitating its application. As stated, the accuracy of the underlying DIR must be understood and taken into account. The two applications of the model that we have previously investigated are to reduce artifacts in RCCT images by replacement with model generated images [17], and to correct motion artifacts in cone-beam CT [10]. Future work will investigate model accuracy in the context of these applications.
Acknowledgments
This work was supported in part by Award Number R01-CA126993 from the National Cancer Institute. The content is solely the responsibility of the authors and does not necessarily represent the official views of the National Cancer Institute or the National Institutes of Health.
References
- 1.Keall P. 4-dimensional computed tomography imaging and treatment planning. Semin Radiat Oncol. 2004;14:81–90. doi: 10.1053/j.semradonc.2003.10.006. [DOI] [PubMed] [Google Scholar]
- 2.Dieterich S, Cleary K, D’Souza W, Murphy MJ, Wong KH, Keall P. Locating and targeting moving tumors with radiation beams. Med Phys. 2008;35 (12):5684– 5694. doi: 10.1118/1.3020593. [DOI] [PubMed] [Google Scholar]
- 3.Yan D, Jaffray DA, Wong JW. A model to accumulate fractionated dose in a deforming organ. Int J Radiat Oncol Biol Phys. 1999;44:665–675. doi: 10.1016/s0360-3016(99)00007-3. [DOI] [PubMed] [Google Scholar]
- 4.Wu C, Jeraj R, Olivera GH, Mackie TR. Re-optimization in adaptive radiotherapy. Phys Med Biol. 2002;47:3181–3195. doi: 10.1088/0031-9155/47/17/309. [DOI] [PubMed] [Google Scholar]
- 5.Birkner M, Yan D, Alber M, et al. Adapting inverse planning to patient and organ geometrical variation: algorithm and implementation. Med Phys. 2003;30:2822–2831. doi: 10.1118/1.1610751. [DOI] [PubMed] [Google Scholar]
- 6.Velec M, Moseley JL, Eccles CL, Craig T, Sharpe MB, Dawson LA, Brock KK. Effect of Breathing Motion on Radiotherapy Dose Accumulation in the Abdomen Using Deformable Registration. Int J Radiat Oncol Biol Phys. 2010 doi: 10.1016/j.ijrobp.2010.05.023. [DOI] [PMC free article] [PubMed] [Google Scholar]
- 7.Li T, Koong A, Xing L. Enhanced 4D cone-beam CT with inter-phase motion model. Med Phys. 2007;34:3688–3695. doi: 10.1118/1.2767144. [DOI] [PubMed] [Google Scholar]
- 8.Rit S, Wolthaus JWH, Herk M, Sonke J. On-the-fly motion-compensated cone-beam CT using an a priori model of the respiratory motion. Med Phys. 2009;36:2283–2296. doi: 10.1118/1.3115691. [DOI] [PubMed] [Google Scholar]
- 9.Leng S, Zambelli J, Tolakanahalli R, et al. Streaking artifacts reduction in four-dimensional cone-beam computed tomography. Med Phys. 2008;35:4649–4659. doi: 10.1118/1.2977736. [DOI] [PMC free article] [PubMed] [Google Scholar]
- 10.Zhang Q, Hu Y, Liu F, Mageras G, Goodman K, Rosenzweig K. Correction of motion artifactsin cone-beam CT using a patient-specific respiratory motion model. Med Phys. 2010;37:2901. doi: 10.1118/1.3397460. [DOI] [PMC free article] [PubMed] [Google Scholar]
- 11.Jannin P, Fitzpatrick JM, Hawkes DJ, Pennec X, Shahidi R, Vannier MW. Validation of medical image processing in image-guided therapy. IEEE Trans Med Imaging. 2002;21(12):1445–1449. doi: 10.1109/TMI.2002.806568. [DOI] [PubMed] [Google Scholar]
- 12.Brock Kristy K, et al. Results of a multi-institution deformable registration accuracy study (MIDRAS) Int J Radiation Oncology Biol Phys. 2010;76(2):583–596. doi: 10.1016/j.ijrobp.2009.06.031. [DOI] [PubMed] [Google Scholar]
- 13.Serban M, Heath E, Stroian G, Collins DL, Seuntjens J. A deformable phantom for 4D radiotherapy verification: design and image registration evaluation. Med Phys. 2008;35:1094–1102. doi: 10.1118/1.2836417. [DOI] [PubMed] [Google Scholar]
- 14.Kashani R, Hub M, Balter JM, Kessler ML, Dong L, Zhang L, Xing L, Xie Y, Hawkes D, Schnabel JA, McClelland J, Joshi S, Chen Q, Lu W. Objective assessment of deformable image registration in radiotherapy: A multi-institution study. Med Phys. 2008;35:5944–5953. doi: 10.1118/1.3013563. [DOI] [PMC free article] [PubMed] [Google Scholar]
- 15.Coselmon MM, Balter JM, McShan DL, et al. Mutual information based CT registration of the lung at exhale and inhale breathing states using thin-plate splines. Med Phys. 2004;31:2942–2948. doi: 10.1118/1.1803671. [DOI] [PubMed] [Google Scholar]
- 16.Zhong H, Kim J, Chetty IJ, et al. Analysis of deformable image registration accuracy using computational modeling. Med Phys. 2010;37:970–979. doi: 10.1118/1.3302141. [DOI] [PMC free article] [PubMed] [Google Scholar]
- 17.Zhang Q, Pevsner A, Hertanto A, Hu Y, Rosenzweig K, Ling C, Mageras G. A patient-specific respiratory model of anatomical motion for radiation treatment planning. Med Phys. 2007;34:4772–4781. doi: 10.1118/1.2804576. [DOI] [PubMed] [Google Scholar]
- 18.Lu W, Chen M, Olivera G, Ruchala K, Mackie T. Fast free-form deformable registration via calculus of variations. Phys Med Biol. 2004;49:3067–3087. doi: 10.1088/0031-9155/49/14/003. [DOI] [PubMed] [Google Scholar]
- 19.Garrity JM, Segars WP, Knisley SB, Tsui BMW. Development of a dynamic model for the lung lobes and airway tree in the NCAT phantom. IEEE Trans Nucl Sci. 2003;50:378–383. [Google Scholar]
- 20.Wu Z, Rietzel E, Boldea V, Sarrut D, Sharp GC. Evaluation of deformable registration of patient lung 4DCT with subanatomical region segmentations. Med Phys. 2008;35:775–781. doi: 10.1118/1.2828378. [DOI] [PubMed] [Google Scholar]
- 21.Vaman C, Staub D, Williamson J, Murphy MJ. A method to map errors in the deformable registration of 4DCT images. Med Phys. 2010;37:5765–5776. doi: 10.1118/1.3488983. [DOI] [PMC free article] [PubMed] [Google Scholar]


