Abstract
Although fast-scan cyclic voltammetry (FSCV) has contributed to important advances in neuroscience research, the technique is encumbered by significant analytical challenges. Confounding factors such as pH change and transient effects at the microelectrode surface make it difficult to discern the analytes represented by complex voltammograms. Here we introduce paired-pulse voltammetry (PPV), that mitigates the confounding factors and simplifies the analytical task. PPV consists of a selected binary waveform with a specific time gap between each of its two comprising pulses, such that each binary wave is repeated, while holding the electrode at a negative potential between the waves. This allows two simultaneous yet very different voltammograms (primary and secondary) to be obtained, each corresponding to the two pulses in the binary waveform. PPV was evaluated in the flow cell to characterize three different analytes, (dopamine, adenosine, and pH changes). The peak oxidation current decreased by approximately 50%, 80%, and 4% for dopamine, adenosine, and pH, in the secondary voltammogram compared with primary voltammogram, respectively. Thus, the influence of pH changes could be virtually eliminated using the difference between the primary and secondary voltammograms in the PPV technique, which discriminates analytes on the basis of their adsorption characteristics to the carbon fiber electrode. These results demonstrate that PPV can be effectively used for differentiating complex analytes.
Introduction
Background subtracted Fast Scan Cyclic Voltammetry (FSCV) at carbon fiber micro-electrodes (CFM) is well recognized in the field of neuroscience research 1–3 and has now been widely utilized for in-vivo neurochemical detection. The authors have previously described the development of the Wireless Instantaneous Neurotransmitter Concentration Sensing System (WINCS), which is a wireless, sterilizable, compact and low-noise device that combines FSCV with digital telemetry to perform microsecond electrochemical measurements in the brain. 4, 5. Efforts have also been made to optimize the sensitivity and specificity of the technique for neurochemical detection, by application of specific voltammetric waveforms 6. For example detection of dopamine was improved by application of a triangle shaped waveform consisting of a +1.0V peak, a holding potential of −0.4V between scans, and a sweep rate of 300 V/s7, 8. Similarly an N-shape voltammetric waveform has been used for the improvement of serotonin detection and to reduce electrode fouling9. However, the sensitivity and specificity of in-vivo neurochemical detection, where complex voltammograms are influenced by pH changes or other gross environmental changes at the CFM surface, has remained a challenging issue. A common approach to these problems in the past has been to only analyze the data set for a short period of time following electrical or mechanical stimulation, which generally gives clear discernable electrochemical signal changes2. However, this approach limits the experimental design and is not a fundamental solution for analyzing complex voltammograms. Advanced analysis algorithms like principal component regression (PCR) have also been used to estimate metabolite concentrations in complicated voltammograms2. Using PCR, dopamine and adenosine have been successfully quantified10–12, and several publications have successfully differentiated multiple analytes (including pH) in complex data sets collected both in vivo and in vitro 11, 13–15. In parallel with this advanced post-processing method, we assumed, additional electrochemical information by a different type of FSCV waveform from conventional FSCV would be helpful for improving the estimation of specific metabolites in complex electrochemical environments.
One of significant factors, affecting the cyclic voltammetric response during FSCV, is the adsorption of species from the solution onto the microelectrode surface. It was noted that applying a waveform that has a 0.0V holding potential between scans with respect to the reference Ag/AgCl electrode, lowered the amount of DA adsorbed by 75% when compared to the holding potential of −0.4V 16. It is also known that at physiological DA concentration, 95% of the electrochemical DA oxidation current comes from the adsorbed molecules and only 5% from diffused molecules, during each potential sweep 17. A negative potential (−0.4V) was therefore used to hold the electrode in-between voltammetric sweeps, in order to enhance DA adsorption on the CFM surface and increase the detection sensitivity. Recently, the adsorption properties of other analytes besides DA have also been investigated 18. Since adsorption is a property, specific to each analyte, we assumed that adsorption could be an important factor, aiding to discriminate various analytes in FSCV.
The adsorption peak current is known to follow the given equation 19.
| (1) |
Where, n is the number of electrons involved in electrode reaction, A is the electrode surface area, v is the sweep rate, and Γ0 is the amount of adsorbed analyte. As described in the equation above, adsorption current is linearly proportional to the amount of adsorbed analyte.
If the time is sufficiently short and the analyte concentration is constant within that short time, the adsorption current will become a function of time. In FSCV, the time between cyclic voltage waveform pulses at which a constant potential is held also affects the amplitude of a species that adsorbs to the electrode surface 16. The greater the time between scans, the more the adsorption processes can be thought to occur and approach equilibrium. Moreover, for a specific repetition time, the adsorption would depend upon the intrinsic properties, specific to each analyte like molecular mass, charge etc. This reflects that repetition time could be used as a parameter for differentiating various analytes by utilizing their adsorption characteristics in FSCV. Stamford et al. reported that double-cycle voltammetry could be used for detecting ascorbic acid based on its different diffusion characteristics from the other metabolites’ characteristics20. In this paper, we extended this double sweep technique into background subtracted FSCV which we called Paired Pulse Voltammetry (PPV). PPV was evaluated here to obtain differential information related to adsorption characteristics of analytes or metabolites like dopamine, adenosine, and pH by controlling the scan repetition time, sweep rate and peak voltage of triangle waveform.
Material and Methods
Paired Pulse Voltammetry
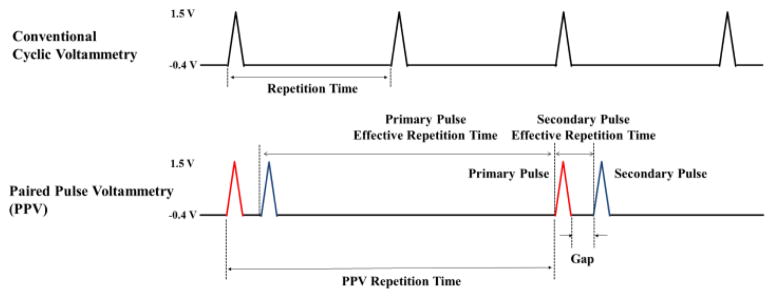
The most widely used conventional FSCV waveform for the detection of adenosine and dopamine is a triangle shaped voltammetric pulse as shown in Fig. 1. Repeating 10 times per second, the applied potential sweeps from −0.4V to +1.5V and back to −0.4 V, at a sweep rate of 400V/s, while the electrode is held at a holding potential of −0.4V between voltammetric pulses. Unlike conventional FSCV, PPV suggested in this paper consists of a paired pulse (primary and secondary pulse) or binary waveform with a specific time gap between the two pulses comprising each binary wave, repeated with a negative holding potential between the paired pulses/binary waves, as in conventional FSCV. The primary pulse is defined as the first pulse in the binary waves, and the secondary pulse as the following pulse as shown in Fig. 1. The effective repetition time of the primary pulse is the time difference between the primary pulse of the current binary sweep and secondary pulse of the previous binary sweep as shown in Fig. 1. Whereas, the effective repetition time of the secondary pulse is the time difference between the first and second pulse comprising the binary wave. For example, if we use PPV with 5Hz frequency (200ms between two binary pulse sweeps), 400V/s sweep rate (9.5ms per single pulse from −0.4V to 1.5V back to −0.4V), and 2.2ms gap between primary and second pulse of the binary waveform, the effective repetition time of primary pulse will be 188.3ms (=200ms −9.5ms − 2.2ms) and the secondary pulse will be 11.7ms (=9.5ms + 2.2ms). The difference between two pulses reflects the amount of adsorbed analyte on the microelectrode surface due to the discrepancy between their effective repetition times.
Fig. 1. The conventional FSCV waveform and proposed paired pulse voltammetry (PPV) waveform.
PPV consists of a selected binary waveform with a specific time gap between each of its two comprising pulses, such that each binary wave is repeated, while holding the electrode at a potential between the waves. The primary pulse has long effective repetition time compared with the secondary pulse
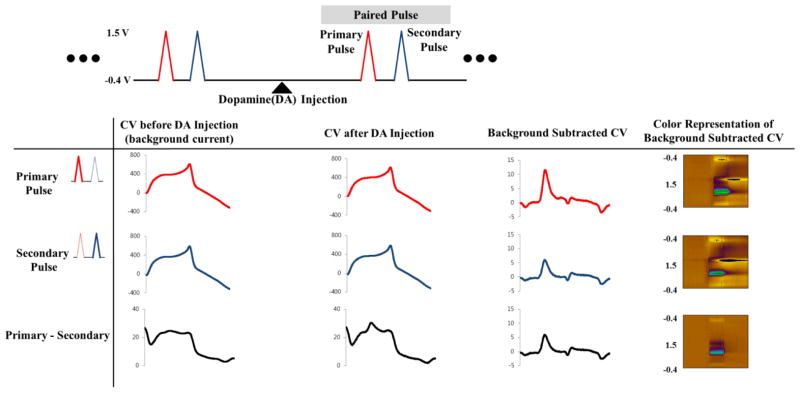
The voltammogram obtained from the first pulse in the binary waveform (red triangle in Fig. 2) is referred to as the primary voltammogram (long repetition time), and that obtained from the second pulse (blue triangle in Fig. 2) as the secondary voltammogram (short repetition time). Primary and secondary voltammograms are obtained with a single continuous binary sweep. Therefore, three types of voltammograms could be reconstructed using PPV as shown Fig. 2. The primary voltammogram (P voltammogram) was constructed with the voltammetric data set acquired at the primary pulse of the binary waveform. The secondary voltammogram (S voltammogram) was constructed with the data set acquired from voltammetry at the second pulse of the binary waveform. Last, the difference voltammogram (P-S voltammogram) was constructed by subtracting the S voltammogram from P voltammogram at each time point of data acquisition. In addition, three background subtracted cyclic voltammograms could be calculated by subtracting each subtraction background current obtained at the same time point as shown in Fig. 2.
Fig. 2. Data analysis with PPV.
Three types of voltammograms is reconstructed using PPV. The primary voltammogram (P voltammogram) was constructed with the voltammetric data set acquired at the primary pulse of the binary waveform. The secondary voltammogram (S voltammogram) was constructed with the data set acquired from voltammetry at the second pulse of the binary waveform. Last, the difference voltammogram (P-S voltammogram) was constructed by subtracting the S voltammogram from P voltammogram.
Data Acquisition
All experiments were performed using the previously published WINCS System 4, 21. Briefly, WINCS incorporates front-end analog circuitry for FSCV, a microprocessor, and Bluetooth radio, all on a single rechargeable lithium-polymer battery–powered, multilayer, printed circuit board that is hermetically sealed in a polycarbonate case, permitting sterilization using the Sterrad gas plasma process. In FSCV mode, WINCS uses a transimpedance amplifier to convert current to voltage, and a difference amplifier to subtract a triangular waveform potential applied to a CFM prior to signal digitization. A digital-to-analog converter applies the FSCV waveform to the CFM, and an analog-to-digital converter samples FSCV at a rate of 100 kilosamples per second. Bluetooth 2.4–2.5 GHz digital telemetry is used to wirelessly communicate between WINCS and a basestation computer running Windows XP. Custom software controls WINCS parameters and operation, such as data acquisition and transmission, the applied potential waveform, and data sampling rate. Data, in the form of a sequence of unsigned 2-byte integers, are saved to the base-station computer hard drive for offline processing either with MATLAB (The MathWorks, Inc.) or LabVIEW software (National Instruments Corp.). The acquired data are displayed in several graphical formats for nearly real time analysis by the Mayo Clinic engineered software (WINCSware) running on the WINCS base station computer.
Fabrication of Carbon Fiber Microelectrodes
For FSCV, the carbon fiber microelectrode (CFM) was constructed by aspirating a single carbon fiber (d = 7 μm) (Cytec Thornel® T300) into a borosilicate glass capillary and pulling to a microscopic tip using a pipette puller (P-2000, Sutter Instruments, CA, USA). The exposed carbon fiber was trimmed to a final length of ~100 μm using a scalpel 22. The Ag/AgCl reference electrode was fabricated by chloridizing a 31 gauge silver wire 23.
Flow Injection Apparatus
Flow injection analysis was used for in vitro measurements with FSCV at a CFM. The flow-injection analysis system consisted of a syringe pump (Harvard Apparatus, Hollisoton, MA) that directed buffer solution through a Teflon tube to a 6-port injection valve (Rheodyne, Rohnert Park, CA). The inejction valve was controlled by a 12V solenoid and was used to introduce analyte from an injection loop in an electrochemical cell. A CFM is placed in a flowing stream of buffer and analyte is injected as a bolus. The buffer solution, composed of 150 mM sodium chloride and 12 mM Trizma base at pH 7.4, was pumped across the CFM at a rate of 2 ml/min.
in vivo Experiment
Three adult male Sprague-Dawley rats, weighing 300 to 400 g, were used for the in vivo study. Rats were housed under standard conditions with ad libitum access to food and water. Care was provided in accordance with NIH guidelines and approved by the Mayo Clinic Institutional Animal Care and Use Committee.
Results and Discussion
Paired Pulse Voltammetry for Dopamine, pH changes, and Adenosine
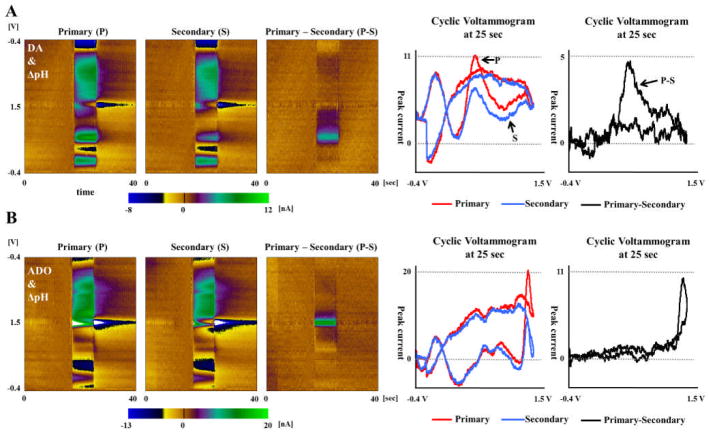
PPV was applied to solutions of dopamine DA 1uM, adenosine ADO 5uM, and ΔpH +0.1 with the following parameters: −0.4V rest/holding potential, 1.5V peak potential, 400 V/s sweep rate, 2.2ms gap and 5Hz repetition rate (200ms repetition time). As previously described, the effective repetition times of P voltammogram and S voltammogram are 188.3ms and 11.7ms, respectively.
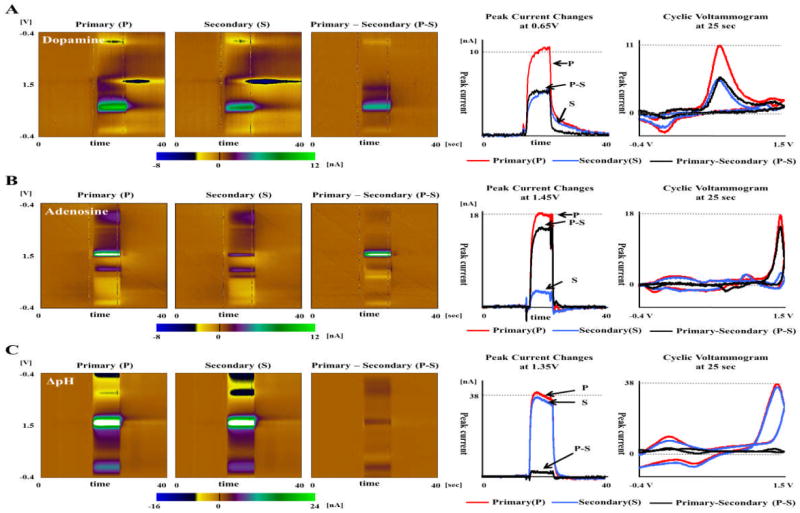
For DA, the P-S voltammogram was expected to show a clear DA signal, since catecholamines like DA tend to be adsorbed on the CFM surface under a negative holding potential and are more dependent on effective repetition time when compared to the smaller H+ ions. The results were as anticipated and are shown in Fig. 3(A). The peak current of the background subtracted S voltammogram at 0.6 V potential had decreased by approximately 50% when compared to the background subtracted P voltammogram. The background subtracted P-S voltammogram therefore showed a clear DA signal at the same potential. An interesting result was that the changes occurring at the reduction potential around −0.2V seemed to be unnoticeable in the P-S voltammogram. This can be explained by the two different sources of current changes and their time dependence. The oxidation current changes are from the DA getting adsorbed on the CFM surface during the “holding time” gap between each triangular pulse/the effective repetition time, whereas the source of reduction current is DA-o-quinone formed at the CFM surface, just after DA oxidation at 0.6V in an anodic sweep, and is unlikely to be significantly influenced by the repetition time.
Fig. 3. DA, Adenosine, ΔpH responses in PPV using flow injection analysis.
A. PPV responses to DA 1uM. Three pseudo-color plots consisted of P voltammogram, S voltammogram and their difference in PPV. The peak current of the background subtracted S voltammogram at 0.6V potential had decreased by approximately 50% when compared to the background subtracted P voltammogram. B. PPV responses to ADO 5uM. The first oxidation current of S voltammogram at 1.35V decreased up to 80% compared to S voltammogram, which lead to clear current changes in the P-S voltammogram. C. PPV responses to 0.1 ΔpH. The P voltammogram and S voltammogram of pH change were very similar to each other, such that only a small amount of signal change was noticeable in the P-S voltammogram.
The first oxidative peak current of adenosine, occurring at 1.35V, decreased by up to 80% in the S voltammogram when compared to the P voltammogram. It resulted in clearer difference signal in the P-S voltammogram. Although DA is well known for adsorption at carbon surface during a −0.4V holding potential, the comparison of difference (P-S) voltammograms between DA and ADO showed that ADO had a larger difference signal than DA. A possible explanation is that the difference signal may come from not how well but how fast the molecules are adsorbed at CFM surface due to diffusional limitations of mass transport. The slower diffusion and adsorption of ADO compared to DA may lead to smaller amounts of adenosine adsorption during the given effective repetition time of the secondary voltammogram and thus resulting in smaller current. Another interesting finding was that the second peak oxidation current of ADO at 1.2V was nearly the same between the P and S voltammograms, similar to the reduction currents of DA at −0.2 V. A similar explanation is proposed assuming that the second oxidation peak current, arising from the adenosine already adsorbed at the CFM surface is unlikely to be influenced by the effective repetition time.
PPV responses to pH changes showed a different pattern than that of both DA and ADO. The Primary and secondary voltammograms were very similar, as shown in Fig. 3(C), such that only a small amount of signal change was noticeable in the P-S voltammogram. Peaks in the background subtracted cyclic voltammogram in response to a pH change may be caused by a shift in the background of a carbon electrode, defined by the electrochemically active surface groups present on the electrode surface18. A quick equilibration or stabilization process on the electrode surface leads to similar pattern even with the comparatively short repetition time of the secondary voltammetry.
The Effect of Repetition Time on PPV
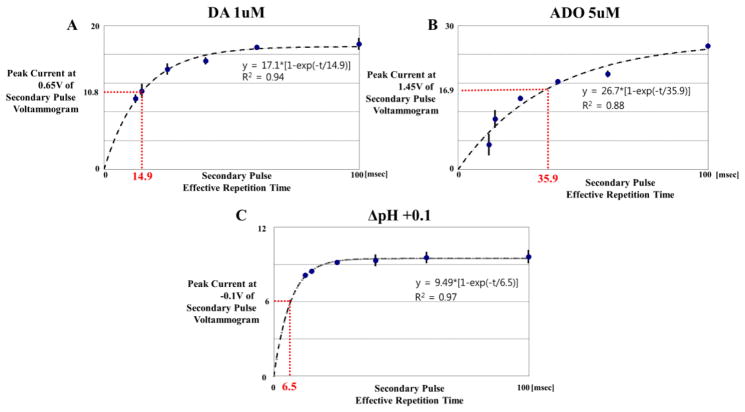
In order to further investigate the effect of repetition time on PPV, we obtained PPV data using six different time gaps (2.5, 5, 15, 30, 50, 90 ms), which respectively corresponded to the effective repetition times (12.0, 14.5, 24.5, 39.5, 59.5, 99.5 ms) of the secondary voltammogram, at 5Hz repetition rate of PPV. Three measurements with each gap were conducted for dopamine 1uM, adenosine 5uM, and ΔpH 0.1. The average and standard deviation of the three oxidation current measurements were plotted against time gap for each DA, ADO and pH secondary voltammograms, as shown in Fig. 3. The current in the S voltammogram at 0.6V potential for DA was 9.8nA with 12.0ms of effective repetition time, reaching a plateau of approximately 17.0 nA with an effective repetition time of 59.5ms. As seen in Fig. 4(A), the DA current response initially increased at high rate, and then slowed, nearing saturation as the time gap between the two pulses comprising the binary waveform increased. The curve fit well with following exponential equation (R-squared values > 0.88):
| (2) |
where t is the effective repetition time, and a and b are fitting coefficients such that ‘a’ is the saturated current value when repetition time would be infinite, and ‘b’ is the coefficient of reaction time, or the time required to reach approximately 63% of the saturated current value. Here, the curve ideally approaches to zero at the zero effective repetition time of the secondary pulse. Practically, zero effective repetition time is impossible because the repetition time of secondary pulse is defined as the duration between the starting point of primary pulse and the starting time of the secondary pulse as shown in Fig. 1. The minimum repetition time of the secondary pulse to be applied is 9.5 ms with the applied potential sweeps from −0.4V to +1.5V and back to −0.4 V, at a sweep rate of 400V/s, and with zero gap time. In the back-back pulses (PPV with zero gap time), the tail part of primary waveform however influences the initial part of secondary waveform, which leads to the distortion of background current of the secondary pulse. About 2ms gap time between two pulses is empirically needed to ensure the PPV for avoiding the distortion of secondary voltammogram.
Fig. 4. The effect of repetition time on PPV.
Plot of DA peak currents at 0.65V in from the S voltammogram using five effective repetition times (12.0, 14.5, 24.5, 39.5, 59.5, 99.5ms, respectively, n=3). The curve fitted with exponential curve (R-squared values > 0.88). B. ADO current plots in S voltammogram at 1.45V potential. C. ΔpH current plots in S voltammogram at −0.1V potential
The DA current response with respect to repetition time, fit with the above exponential function with a 0.94 R-squared value. For ADO, the current versus repetition time curve fit with the above equation with the R-square value of 0.88. As shown in Fig. 4, the reaction time constant ‘b’ for DA at 0.6V was about 14.5 ms. This reaction time was influenced not only by adsorption and diffusion characteristics of DA, but also by reduction of dopamine ortho-quinone in primary pulse. For instance, when dopamine ortho-quinone is reduced back to dopamine, that dopamine immediately sticks to the electrode, and would give a current in secondary pulse. The reaction time constant of ADO at 1.49V potential was 39.5ms, approximately two times slower than DA. This may be due to the lower diffusion coefficient for ADO (4.4 × 10⁻⁶ cm2/s) rather than one of DA ( 6.0 × 10⁻⁶ cm2/s) 24, 25,. In addition, after ADO oxidation, its product does not return back to adenosine unlike dopamine redox process. This could influence on slower reaction time. Comparatively, the response for pH change was the fastest, measuring at approximately 6.5ms. As described in the previous section, the fast H+ ion diffusion coefficient (10−4 cm2/s26) to the CFM surface and a quick stabilization process at the electrode surface resulted in near complete removal of pH change visible in the difference (P-S) voltammogram.
The reaction time coefficient described here, holds high importance, as it could be used to characterize each analyte and aid in distinguishing molecules from one another in otherwise complicated or ambiguous conventional FSCV datasets. The reaction time maybe be influenced by the analyte’s molecular size, mass, charge, redox process, and other characteristics, which should be investigated in future studies to fully understand the complex dynamics of microelectrode species detection.
The Effect of sweep rate on PPV
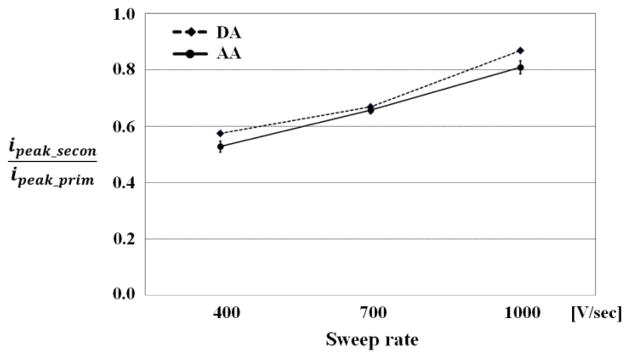
To investigate the effect of sweep rate change, we applied three different rates (400, 700, and 1000V/s) with PPV for detection of 1 uM DA with the same effective repetition time (12ms) of the secondary pulse, held constant by adjusting gap time (2.5ms, 6.5ms, and 8.2ms). As shown in Fig. 5, the sweep rate change from 400 to 1000 V/s caused an increase in the peak current response of the primary pulse and the one of the secondary pulse, which is consistent with the previous theory that the current will scale linearly with sweep rate if the process is adsorption19. Therefore, the difference between primary and secondary pulse would be constant at various sweep rates.
Fig. 5. The effect of sweep rate on PPV.
Plot of the peak currents of the primary and secondary voltammograms and the ratio of secondary over primary voltammogram at three different sweep rates (400, 700, and 1000V/s). DA(1uM) were measured with the same effective repetition time (12ms).
The Evaluation of PPV in Mixtures
To further test its capability, PPV was evaluated for resolving mixture solutions of 1uM DA with 0.1 ΔpH and 5uM ADO with 0.1 ΔpH. As shown in Fig. 6(A), the combination of ΔpH and DA produced visually complicated P and S voltammograms in which it was difficult to differentiate individual components. However, the P-S voltammogram showed the DA oxidation peak as significant, with minimized ΔpH influence. As seen in Fig. 6(B), the reduced influence of ΔpH was more evident in the mixture solution with ADO than with DA, because the reaction time coefficient ‘b’ of ADO is greater than that of DA. It is to be noted that although pH change had been nearly completely removed, we could detect only the first oxidation peak of ADO in the P-S voltammogram. As previously described, the second oxidation peak appears independent of the effective repetition time and had similar intensity in the primary and secondary voltammograms, therefore cancelling out in the P-S voltammogram.
Fig. 6. PPV responses in mixtures.
PPV was evaluated for resolving mixture solutions of 1uM DA with 0.1 ΔpH and 5uM ADO with 0.1 ΔpH A. PPV with 2.5ms gap in DA 1uM and 0.1 ΔpH mixture solution. The P-S voltammogram showed the DA oxidation peak as significant, with minimized ΔpH influence. B. PPV with 2.5ms gap in ADO 5uM and 0.1 ΔpH mixture solution. The reduced influence of ΔpH was more evident in the mixture solution with ADO than with DA.
Another interesting finding was that the P-S voltammogram appeared stable around the switching potential; whereas conventional FSCV can often show noticeable current changes (Fig. 6). There were no detectable current changes due to background drift or electrode surface environmental changes. Since these changes related to electrode conditioning are unlikely to depend on the repetition time, they reflect equally on the P and S voltammetry, only to cancel out and result in P-S voltammetry. The properties of P-S voltammetry could be very valuable in evaluating in vivo recordings, especially in human electrochemistry where the data sets often get complex by numerous changes occurring at the microelectrode surface.
The Evaluation of PPV in in vivo Experiment
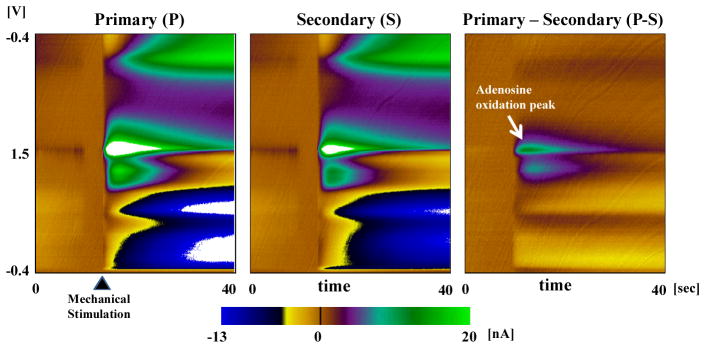
For evaluating the performance of PPV in-vivo, we applied PPV in the rat brain experiments for ADO detection. There are large pools of adenosine stored in the astrocytes that can be released by mechanical stimulation27, 28. In order to release adenosine, we used mechanical stimulation in the rat brain. After insertion of the CFM electrode in the thalamus, we lightly touched the surface in order to evoke ADO release while recording. As shown in Fig. 7, CFM touching induced current changes from ADO release as well as variations due to micro-environmental electrode condition changes. By applying PPV with a 2.5ms gap, only ADO responses were realized, while minimizing the effect of electrode environmental condition changes on the P-S voltammetry. An interesting finding was the clear second oxidation peak at 1.2V in the P-S voltammogram, which was not seen with in-vitro ADO detection experiments (Fig 7). This may be due to a different micro-environment around the electrode during the in-vivo experiments, altering the analyte adsorption at CFM surface when compared to in-vitro experiments. It could also be a response to the other metabolites being released in the brain during mechanical stimulation and needs to be elucidated by further studies like, in-vivo electrical stimulation evoking ADO release or ex-vivo mechanical stimulation in brain slice.
Fig. 7. The Evaluation of PPV in in vivo Experiment.
After insertion of the CFM electrode in the thalamus, we lightly touched the surface in order to evoke ADO release while recording. By applying PPV with a 2.5ms gap, only ADO responses were realized, while minimizing the effect of electrode environmental condition changes on the P-S voltammetry.
Conclusions
In conventional FSCV the time-varying potential is a brief pyramidal waveform, typically repeated 10 times per second. The CFM is otherwise maintained at a specified holding potential with respect to the reference electrode. Here we introduce PPV where the waveforms are paired in doublets—two identical waveforms (“pulses”), separated in time by an arbitrary but short interval at the holding potential. The virtue of paired-pulse voltammetry is that it can discriminate analytes on the basis of their adsorption characteristics. When the voltammogram for one of the pulses comprising a doublet is subtracted from the voltammogram for the other pulse, the effects of pH change, for example, can largely be eliminated.
Acknowledgments
This work was supported by NIH (K08 NS 52232 award to KHL) and Mayo Foundation (Research Early Career Development Award for Clinician Scientists award to KHL).
Notes and references
- 1.Garris PA. Nature methods. 2010;7:106–108. doi: 10.1038/nmeth0210-106. [DOI] [PubMed] [Google Scholar]
- 2.Heien ML, Khan AS, Ariansen JL, Cheer JF, Phillips PE, Wassum KM, Wightman RM. Proceedings of the National Academy of Sciences of the United States of America. 2005;102:10023–10028. doi: 10.1073/pnas.0504657102. [DOI] [PMC free article] [PubMed] [Google Scholar]
- 3.Michael AC, Borland LM. Electrochemical Methods for Neuroscience. CRC Press; 2007. [PubMed] [Google Scholar]
- 4.Bledsoe JM, Kimble CJ, Covey DP, Blaha CD, Agnesi F, Mohseni P, Whitlock S, Johnson DM, Horne A, Bennet KE, Lee KH, Garris PA. Journal of neurosurgery. 2009;111:712–723. doi: 10.3171/2009.3.JNS081348. [DOI] [PMC free article] [PubMed] [Google Scholar]
- 5.Griessenauer CJ, Chang SY, Tye SJ, Kimble CJ, Bennet KE, Garris PA, Lee KH. Journal of neurosurgery. 2010;113:656–665. doi: 10.3171/2010.3.JNS091627. [DOI] [PMC free article] [PubMed] [Google Scholar]
- 6.Heien ML, Phillips PE, Stuber GD, Seipel AT, Wightman RM. The Analyst. 2003;128:1413–1419. doi: 10.1039/b307024g. [DOI] [PubMed] [Google Scholar]
- 7.Garris PA, Wightman RM. In: Neuromethods: Voltammetric Methods in Brain Systems. Boulton A, Baker G, Adams RN, editors. Humana Press Inc; Totowa, NJ: 1995. pp. 179–220. [Google Scholar]
- 8.Rice ME, Nicholson C. In: Neuromethods: Voltammetric Methods in Brain Systems. Boulton A, Baker G, Adams RN, editors. Humana Press Inc; Totowa, NJ: 1995. pp. 27–81. [Google Scholar]
- 9.Jackson BP, Dietz SM, Wightman RM. Analytical chemistry. 1995;67:1115–1120. doi: 10.1021/ac00102a015. [DOI] [PubMed] [Google Scholar]
- 10.Cechova S, Elsobky AM, Venton BJ. Neuroscience. 2010;171:1006–1015. doi: 10.1016/j.neuroscience.2010.09.063. [DOI] [PMC free article] [PubMed] [Google Scholar]
- 11.Cechova S, Venton BJ. Journal of neurochemistry. 2008;105:1253–1263. doi: 10.1111/j.1471-4159.2008.05223.x. [DOI] [PubMed] [Google Scholar]
- 12.Swamy BE, Venton BJ. The Analyst. 2007;132:876–884. doi: 10.1039/b705552h. [DOI] [PubMed] [Google Scholar]
- 13.Sanford AL, Morton SW, Whitehouse KL, Oara HM, Lugo-Morales LZ, Roberts JG, Sombers LA. Analytical chemistry. 2010;82:5205–5210. doi: 10.1021/ac100536s. [DOI] [PMC free article] [PubMed] [Google Scholar]
- 14.Heien ML, Johnson MA, Wightman RM. Analytical chemistry. 2004;76:5697–5704. doi: 10.1021/ac0491509. [DOI] [PubMed] [Google Scholar]
- 15.Swamy BE, Venton BJ. Analytical chemistry. 2007;79:744–750. doi: 10.1021/ac061820i. [DOI] [PubMed] [Google Scholar]
- 16.Bath BD, Michael DJ, Trafton BJ, Joseph JD, Runnels PL, Wightman RM. Analytical chemistry. 2000;72:5994–6002. doi: 10.1021/ac000849y. [DOI] [PubMed] [Google Scholar]
- 17.Zachek MK, Takmakov P, Moody B, Wightman RM, McCarty GS. Analytical chemistry. 2009;81:6258–6265. doi: 10.1021/ac900790m. [DOI] [PMC free article] [PubMed] [Google Scholar]
- 18.Takmakov P, Zachek MK, Keithley RB, Bucher ES, McCarty GS, Wightman RM. Analytical chemistry. 2010;82:9892–9900. doi: 10.1021/ac102399n. [DOI] [PMC free article] [PubMed] [Google Scholar]
- 19.Bard AJ, Faulkner LR. Electrochemical Methods: Fundamentals and Applications. John Wiley & Sons, Inc; New York: 2001. [Google Scholar]
- 20.Stamford JA, Kruk ZL, Millar J. Journal of neuroscience methods. 1984;10:107–118. doi: 10.1016/0165-0270(84)90064-5. [DOI] [PubMed] [Google Scholar]
- 21.Shon YM, Chang SY, Tye SJ, Kimble CJ, Bennet KE, Blaha CD, Lee KH. Journal of neurosurgery. 2010;112:539–548. doi: 10.3171/2009.7.JNS09787. [DOI] [PMC free article] [PubMed] [Google Scholar]
- 22.Cahill PS, Walker QD, Finnegan JM, Mickelson GE, Travis ER, Wightman RM. Analytical chemistry. 1996;68:3180–3186. doi: 10.1021/ac960347d. [DOI] [PubMed] [Google Scholar]
- 23.Garris PA, Christensen JR, Rebec GV, Wightman RM. Journal of neurochemistry. 1997;68:152–161. doi: 10.1046/j.1471-4159.1997.68010152.x. [DOI] [PubMed] [Google Scholar]
- 24.Dworkin M, Keller KH. J Biol Chem. 1977;252:864–865. [PubMed] [Google Scholar]
- 25.Venton BJ, Troyer KP, Wightman RM. Analytical chemistry. 2002;74:539–546. doi: 10.1021/ac010819a. [DOI] [PubMed] [Google Scholar]
- 26.Schornack PA, Gillies RJ. Neoplasia. 2003;5:135–145. doi: 10.1016/s1476-5586(03)80005-2. [DOI] [PMC free article] [PubMed] [Google Scholar]
- 27.Tawfik VL, Chang SY, Hitti FL, Roberts DW, Leiter JC, Jovanovic S, Lee KH. Neurosurgery. 2010;67:367–375. doi: 10.1227/01.NEU.0000371988.73620.4C. [DOI] [PMC free article] [PubMed] [Google Scholar]
- 28.Halassa MM, Florian C, Fellin T, Munoz JR, Lee SY, Abel T, Haydon PG, Frank MG. Neuron. 2009;61:213–219. doi: 10.1016/j.neuron.2008.11.024. [DOI] [PMC free article] [PubMed] [Google Scholar]


