Abstract
Molecular mechanisms of how energy metabolism affects embryonic stem (ES) cell pluripotency remain unclear. AMP-activated protein kinase (AMPK), a key regulator for controlling energy metabolism, is activated in response to ATP-exhausting stress. We investigated whether cellular energy homeostasis is associated with maintenance of self-renewal and pluripotency in mouse (m) ES cells by utilizing 5-Aminoimidazole-4-carboxyamide ribonucleoside (AICAR) as an activator of AMPK. We demonstrate that AICAR treatment activates the p53/p21 pathway, and markedly inhibits proliferation of R1 mES cells by inducing G1/S phase cell cycle arrest, without influencing apoptosis. Treatment with AICAR also significantly reduces pluripotent stem cell markers, Nanog and SSEA-1, in the presence of LIF, without affecting expression of Oct4. H9 human (h) ES cells also responded to AICAR with induction of p53 activation and repression of Nanog expression. AICAR reduced Nanog mRNA levels in mES cells transiently, an effect not due to expression of miR-134 which can suppress Nanog expression. AICAR induced Nanog degradation, an effect inhibited by MG132, a proteasome-inhibitor. Although AICAR reduced embryoid body (EB) formation from mES cells, it increased expression levels of erythroid cell lineage markers (Ter119, GATA1, Klf1, Hbb-b and Hbb-bh1). While erythroid differentiation was enhanced by AICAR, endothelial lineage populations were remarkably reduced in AICAR-treated cells. Our results suggest that energy metabolism regulated by AMPK activity may control the balance of self-renewal and differentiation of ES cells.
Keywords: mouse embryonic stem cells, proliferation, AICAR, Nanog, p53, erythroid
Introduction
Nutrient metabolism could play a critical role in cell fate decision as an adaptation mechanism to energy requirements [1-6]. Knockdown of metabolic enzymes induces myogenic or erythroid differentiation [1, 4, 7]. Overexpression of glycolytic enzymes is also involved in tumorigenesis or immotalization of fibroblasts [1, 2].
AMP-activated protein kinase (AMPK) is a master metabolic regulator that maintains cellular energy homeostasis to protect cells from an energy shortage environment. AMPK, a heterotrimer composed of a catalytic subunit (α) and two regulatory subunits (β and γ), is activated by elevated intracellular AMP or AMP/ATP ratio caused by metabolic stresses such as glucose deprivation and hypoxia. AMPK is also activated by hormones or cytokines including leptin and IL-6 [3, 8]. Once activated, AMPK phosphorylates downstream target molecules to shut down ATP-consuming anabolic pathways such as synthesis of proteins, glycogens and fatty acids, and simultaneously to switch on ATP-generating catabolic pathways. The AMPK pathway couples metabolic stresses to cell growth, apoptosis, and differentiation by regulating p53, Rb, mTOR and FOXO [2, 3, 8, 9].
Embryonic stem (ES) cells have the ability to undergo either self-renewal or differentiation into the three germ cell layers. Hence, ES cells are considered as a potential cell source for regenerative cell therapy [10, 11]. For ES cell-based regenerative therapy, it is necessary to establish the techniques for efficient propagation of undifferentiated cells and differentiation to specific cell types. High glucose levels in culture medium are favored for proliferation of ES cells, and alteration of glucose concentration affects differentiation of ES cells [12-14]. AMPK activates various downstream signaling pathways to control cellular energy metabolism, including cell cycle checkpoints and apoptosis in response to energy stresses via the p53 tumor suppressor [2, 3, 8, 9] which can repress Nanog gene expression [15].
Nanog, Oct4 and Sox2 are intrinsic core factors for maintaining ES cells and preventing ES cells from spontaneous differentiation. Nanog is considered as a master transcriptional factor for self-renewal and pluripotency of ES cells and confers ES cell pluripotency independent of LIF-STAT3 signaling pathway [15-17]. Nanog expression is down-modulated at a transcriptional level in the cells under differentiation conditions. Binding of FoxD3 and Oct4/Sox2 to the Nanog promoter facilitates Nanog expression, while binding of TCF3 and p53 to the promoter negatively regulates Nanog expression. LIF-STAT3 and BMP-T pathways were also reported to positively regulate Nanog expression [15]. Nanog gene expression in ES cells shows heterogeneous expression. Cells expressing lower levels of Nanog are more preferentially differentiated under differentiation conditions [18, 19]. Recently, Nanog protein stability was found to be regulated by its phosphorylation [20].
The mechanisms by which cellular energy metabolism affects self-renewal and pluripotency in ES cells remain unclear. Thus, we investigated the effects of 5-Aminoimidazole-4-carboxyamide ribonucleoside (AICAR), an activator of AMPK on self-renewal and differentiation of mES cells. We found that AMPK activated by AICAR induced p53/p21 activation, G1/S cell cycle arrest, and suppressed Nanog expression. Moreover, AICAR suppressed Nanog expression in mouse as well as human ES cells and promoted mES cells to differentiate into the erythroid lineage. These results suggest that metabolic energy control systems are closely coupled with cellular growth and differentiation fates of mES cells.
Materials and Methods
mES cells culture and differentiation
R1 mES cells [21] were maintained on mitomycin C-treated mouse embryonic fibroblasts (MEF, Stem cell technology, Vancouver, Canada, http://www.stemcell.com) in Knock-Out Dulbecco’s Modified Eagle’s Medium (KO-DMEM; Invitrogen, Carlsbad, CA, http://www.invitrogen.com) supplemented with 15% fetal calf serum (Thermo scientific, Walth+.am, MA, http://www.thermoscientific.com), 1% glutamine, 1% nonessential amino acids, antibiotics (Stem cell technology), 100 μM 2-mercaptoethanol (2-ME, Sigma-Aldrich, St. Louis, http://www.sigmaaldrich.com), and leukemia inhibitory factor (1,000 U/ml, LIF; Millipore, Billerica, MA, http://www.millipore.com). For experiments, mES cells were cultured on gelatin-coated plates without MEF. mES cells were differentiated to EBs in serum as reported [22]. Briefly, mES cells were trypsinized and replated on non-coated tissue culture plates for 30 min for MEF depletion. Two thousand cells per ml were cultured in differentiation media (IMDM, 15% FCS, 1% glutamine, 450 μM monothioglycerol, 50 μg/ml ascorbic acid (Sigma-Aldrich), 0.2 mg/ml holo-transferrin (Roche, Indianapolis, IN, http://www.roche.com) and 5% PFHM-II (Invitrogen)). AICAR was purchased from Sigma-Aldrich.
For proliferation assay, 5 × 10⁴ mES cells were seeded in 6-well plates. After 12h, cells were treated with AICAR (0.5 mM) for 24h. Viable cell number was determined by trypan blue exclusion using at least 300 cells in each group.
hES cells culture and immunocytochemistry
H9 hES cells were studied according to the research protocol of the WiCell Research Institute (WiCell, Madison, WI, http://www. wicell.org) and maintained as described previously [23]. hESCs were allowed to adhere to gelatin-coated cover glasses, cultured with or without AICAR (0.5 mM) for 1d and then fixed in 2% paraformaldehyde in PBS for 10 min at room temperature. Cells were then re-fixed with cold 70% ethanol for 2 h at −20°C. Cells were stained with anti-Ki-67-FITC Ab (clone B56; BD Biosciences, San Jose, CA, http://www.bd.com) and anti-phospho-Histone H3 Ab (9701) (Ser10; Cell signaling, Beverly, MA, http://www.cellsignal.com) followed by anti–rabbit Alexa555 (Molecular Probes). Slides were mounted with ProLong Gold antifade reagent containing DAPI (Invitrogen, Eugene, OR). Fluorescence images were captured with a Olympus FV1000-MPE confocal/multiphoton microscope (Olympus, Center Valley, PA) at 200× magnification.
RNA extraction and quantitative quantitative reverse transcription PCR (qRT-PCR)
Total RNA was extracted with the QIAGEN RNAeasy Mini Kit (Valencia, CA, http://www.qiagen.com) according to the manufacturer’s instructions. Total RNA was reverse-transcribed into cDNA using TAKARA BluePrin RT Reagent Kit (Mountain View, CA, http://www.takara-bio.us/am), according to the manufacturer’s instructions. ). qPCR reactions were performed on an Agilent (Santa Clara, CA, http://www.genomics.agilent.com) MX3005P qPCR system with SYBR Green PCR Master Mix (SA Bioscience). Levels of mRNA expression were normalized to β-tubulin (F: 5′-CTGGGAGGTGATAAG-CGATGA-3′, R: 5′-CGCTGTCACCGTGGTAGGT-3′) [24] or HPRT1 mRNA levels. qPCR primers except β-tubulin were purchased from SA Biosciences (Frederick, MD, http://www.sabiosciences.com). miRNA expression was quantified using the RT2 miRNA qPCR Assays (SA Biosciences), normalizing with Rnu6 (RNA, U6 small nuclear 1) small RNA level. qRT-PCR was done in triplicate. Expression levels of target mRNAs or miRNAs were calculated by the ΔCT method [25].
Flow Cytomerty Analysis
Cells were incubated with Fc Block antibody, and then stained with anti-SSEA-1 (FAB2155P, R&D Systems, Minneapolis, MN, http:// www.RnDSystems.com), anti-CD45 (30-F11), anti-CD11b (M1/70) (BD Biosciences, San Jose, CA, http://www.bd.com), anti-CD31 (390), anti-CD144 (eBioBV13), anti-Tie-2 (TEK4) or anti-Ter119 (TER119) (eBiosciences, San Diego, CA, http://www.ebiosciences.com). Apoptosis was measured by Annexin V/ 7-Aminoactinomycin D (7AAD) staining (BD Biosciences) according to manufacturer’s instructions. Cell cycle analysis was processed by bromodeoxyuridine (BrdU) incorporation and 7AAD staining using FITC BrdU Flow Kit (BD Biosciences). Briefly, Cells were subjected to a pulse with 10 μM BrdU for 15 min at 37°C, trypsinized, washed with PBS and fixed. Following permeabilization, re-fixation, and DNase treatment, cells were stained with fluorescein isothiocyanate (FITC)-labeled anti-BrdU antibody. After washing, DNA was stained with 7AAD. Flow cytometry data of stained cells were acquired by a LSRII using FacsDiva (BD Biosciences). Flow cytometry data was analyzed using CellQuest software (BD Biosciences) or FCS Express 3 (De Novo Software, Los Angeles, CA, http://www.denovosoftware.com).
Immunoblotting
Cells were harvested and lysed in ice-cold Mg2+ lysis/wash buffer (Millipore) containing protease and phosphatase inhibitors (1 mM Na3VO4, 10 mM NaF, Complete protease inhibitors (Roche)). 20 μg total protein was separated on a 12% SDS polyacrylamide gel, and transferred to PVDF membranes. Proteins were detected with specific antibodies. The following antibodies were used in western blot analyses at 1:1000 dilution: anti-phospho-p53 (Ser15; mouse Ser18) (16G8), anti-phospho-p53 (Ser392; mouse Ser389) (9281), anti-ACC (C83B10), anti-phospho-ACC (3661), anti-phospho-STAT3 (Y705;9131), anti-GATA-1 (D52H6), anti-Nanog (D73G4) (Cell Signaling Technology, Beverly, MA, http://www.cellsignal.com); anti-β-actin (AC-15, Sigma-Aldrich, St Louis, MO); anti-p21 (F-5), anti-p53 (FL393), anti-hemoglobin β (M-19) ( Santa Cruz Biotechnology, Santa Cruz, CA, http://www.scbt.com); anti-β-tubulin (TBN06, Thermo scientific); anti-Nanog (AB5731, Millipore). Primary antibodies were detected with horseradish peroxidase-conjugated goat anti-mouse or goat anti-rabbit (1:3000 dilution; Cell Signaling Technology) with enhanced chemiluminescence detection.
p53/p21Knock-down
Lentiviral vectors expressing p53 (TRCN0000012359) and p21 shRNA (TRCN0000042583) were purchased from Sigma-Aldrich. VSV-G pseudotyped lentiviral particles were produced by transient transfection of HEK293T cells by calcium phosphate transfection method. mES cells were infected twice with lentivirus in HEK293T cell supernatant on Retronectin (Takara Bio). Infected mES cells were selected by culturing with puromycin (Sigma-Aldrich) at 2 μg/mL for at least 2 days.
Statistical analysis
Data was presented as mean ± standard deviation (SD). Statistical significances were determined by unpaired student t-test comparisons for at least 3 experiments. Values of p < 0.05 were considered significant.
Results
AICAR treatment induces the p53/p21 pathway
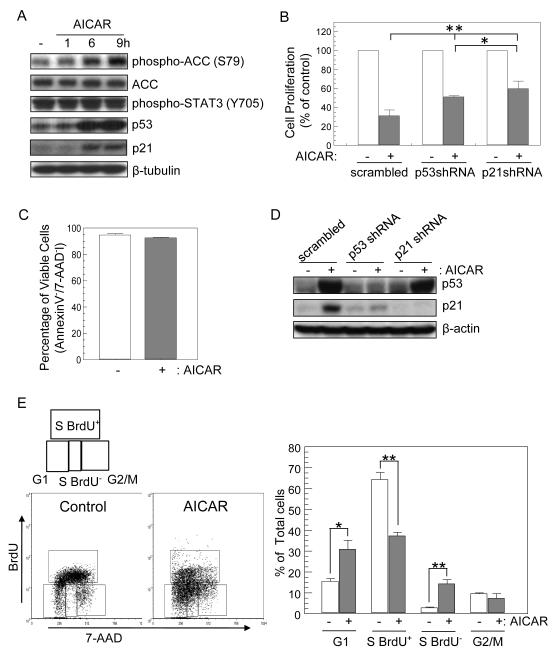
AMPK is a key regulator of cellular metabolism in response to extracellular nutrients and cellular energy status. AICAR, an AMPK activator, regulates proliferation and cell death in several cell types [3, 8, 26]. As mES cells are sensitive to extracellular glucose levels in culture media [12-14], and decreases in glucose in culture media activate AMPK in mammalian cells types [3, 8, 26], we examined the role of AMPK in self-renewal and differentiation of mES cells. Since AMPK phosphorylates acetyl-CoA carboxylase (ACC) at Ser79 to inhibit biosynthesis of fatty acids [3], we first examined whether AICAR activated AMPK in mES cells by examining ACC phosphorylation. ACC phosphorylation at Ser 79 was observed after 6h AICAR treatment in the presence of LIF and glucose (Fig. 1A).
Figure 1.
AICAR treatment leads to cell cycle arrest by p53/p21 induction, without effects on apoptosis. (A) AICAR activates p53/p21 pathway in R1 mES cells. Cells were treated with 0.5mM AICAR for 1, 6, or 9 h, and then cell lysates were prepared. Total lysates were analyzed by immunoblotting for phospho-ACC, ACC, phospho-STAT3, p53 and p21 expression. Anti-β-tubulin antibodies were used as loading controls. A representative blots of at least three different experiments is shown. (B) AICAR inhibits proliferation of mES cells via p53/p21 pathway. Proliferation of mES cells expressing scrambled shRNA, p53 shRNA or p21 shRNA 1d after AICAR treatment (0.5 mM). 5 × 10⁴ cells were seeded in 6-well plates. After 12h, cells were cultured with or without AICAR (0.5 mM) for 1 day and viable cell number was measured by Tryphan blue exclusion and results displayed as % of numbers of control cells which were expressing corresponding shRNA, but were not treated with AICAR. (C) AICAR does not affect mES cell viability. Cells were treated with or without AICAR (0.5 mM, 24 h), and cell viability was assessed by AnnexinV/7-AAD staining. (D) Knock-down of p53 and p21 expression. mES cells were infected by scrambled shRNA-, p53 shRNA-, or p21 shRNA-expressing lentiviruses. Expression of p53 and p21was analyzed by immunoblotting using the cells treated with or without AICAR for 9h. (E) AICAR induces cell cycle arrest of mES cells. Cells were treated with AICAR (0.5 mM) for 1 day. Cells were subsequently incubated with BrdU for 15 min, fixed, stained with anti-BrdU-FITC Ab and 7-AAD. Bivariate analysis of total DNA content and BrdU incorporation was performed by flow cytometry. Plots are representative of three or more experiments with similar results. Data represent % cell populations residing at each cell cycle stage determined by DNA content and BrdU incorporation, and is expressed as mean ± SD (n=3). * p<0.05, ** p<0.01.
Activated AMPK enhances generation of ATP and inhibits consumption of ATP simultaneously. Lactate dehydrogenase (LDH) expression was examined after AICAR treatment. LDH has two isoforms, LDHA and LDHB. LDHA is a heterotetramer of M-LDH which favors conversion of pyruvate to lactate, while LDH-B is a homotetramer of HLDH which favors conversion of lactate to pyruvate [27]. As expected, LDHB expression was enhanced in AICAR-treated mES cells (0.5 mM, 24h; 2.6 ± 0.4 fold, n=3, p<0.01). AMPK plays a critical role not only in cellular energy regulation, but also in cell cycle checkpoints through modulating p53 activation [3, 8]. Levels of p53 and its downstream effector protein p21 were elevated in AICAR-treated cells (Fig. 1A). However, AICAR did not affect LIF-mediated STAT3 phosphorylation [28](Fig. 1A). SIRT1 down-regulates AMPK through deacetylating the serine-threonine kinase liver kinase B1 (LKB1), and antagonizes p53 activation by deacetylation [29, 30]. AMPK increases SIRT1 activity by enhancing cellular NAD+ levels [31]. However, SIRT1-deficiency did not influence AICAR-induced phosphorylation and acetylation of p53 (Data not shown).
G1/S arrest by AICAR treatment
It is not clear whether cellular energy metabolism contributes to cell cycle control of mES cells. As the p53/p21 pathway is involved in cell cycle arrest and apoptosis [32, 33], we investigated whether AICAR inhibited proliferation and survival of mES cells. Cell proliferation was significantly inhibited in AICAR –treated cells in the presence of LIF (Fig. 1B) without influencing apoptosis (Fig. 1C). Cell cycle checkpoints tightly regulate cellular proliferation. Activation of p53/p21reduces cell proliferation by inducing a halt to cell cycle progression [32]. To test whether p53/p21 pathway was required for AICAR-induced suppression of mES cell proliferation, expression of p53 and p21was knocked-down with specific shRNAs (Fig. 1D). p53-knock-down significantly reduced expression of p21, its downstream target (Fig. 1D). As shown in Figure 1B, knock-down of p53 and p21significantly blocked the suppressive effect of AICAR on proliferation. However, p53-knock-down alone was not sufficient to restore proliferation suppressed by AICAR as much as p21-knock-down (Fig. 1B & D), because p53-knocked-down cells still maintained expression of p21 at minimal levels. These results suggest that AICAR-induced suppression of proliferation in mES cells requires expression of both p53 and p21.
G1/S progression is regulated by cyclin D/CDK4, 6 or cyclin E/CDK2 complexes, and these CDK complexes are inhibited by p21 [32]. We hypothesized that AICAR-induced p53/p21 might inhibit these CDK complexes to induce cell cycle arrest in G1/S phase. To assess the effect of AICAR on the cell cycle progression, cells were double-stained with BrdU and 7-AAD after AICAR treatment, and cycle distribution of cells were analyzed by flow cytometry. Since mES cells grow very fast with a remarkablely short doubling-time (around 8h) [34], BrdU-positive cycling cells constituted 65% of mES cells (Fig. 1E). As expected, AICAR markedly decreased the percent cycling S phase of mESC cell population from 64% to 38% as assessed by BrdU incorporation (Fig. 1E). This result is consistent with that obtained by cell counting (Fig. 1B). Instead, AICAR increased the cell population at G1 phase by 15%. AICAR also increased the cell population at non-cycling S phase (S BrdU−) by 5 fold (2.8% in control vs 14.3% in AICAR treated cells, Fig. 1E). This indicates that AICAR inhibits cell proliferation by inducing cell cycle arrest at G1 as well as S phase.
Suppression of Nanog and SSEA-1 expression by AICAR
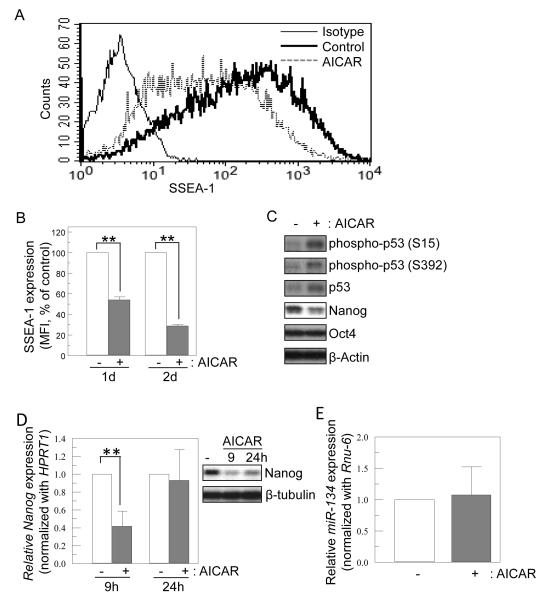
Next, we examined whether AICAR affected the undifferentiated status of mES cells. First we examined expression level of cell surface markers of undifferentiated mES cells, SSEA-1 by flow cytometry. SSEA-1 expression was substantially lower in AICAR-treated cells than non-treated control cells in the presence of LIF (Fig. 2A & B). We next addressed expression levels of Oct4-Nanog transcription factors which play a critical role in maintaining self-renewal of ES cells [15, 35]. Downregulation of Nanog mRNA expression correlates with phosphorylation of p53 [15, 36]. AICAR induced phosphorylation of p53 at Ser 15 and 392 in mES cells (Fig. 2C). Consistent with this, when mES cells were treated with AICAR, Nanog protein expression level was down-regulated (56 ± 7% of control, n=3; Fig. 2C). However, the level of Oct4 protein was not affected by AICAR. We examined whether AICAR could suppress Nanog mRNA levels. Nanog mRNA levels were significantly reduced in cells after 9h AICAR treatment, but recovered at 24h (Fig. 2D). However, Nanog protein expression remained low even at 24h post AICAR treatment (67 ± 5% of control, n=3; Fig. 2D). Nanog expression has been reported to be regulated by miRNAs [37, 38]. However, AICAR did not induce the expression of miR-134 which suppresses Nanog expression (Fig. 2E). Another Nanog-suppressing miRNA, miR-296 was not detected even in AICAR-treated cells (Data not shown).
Figure 2.
Expression of Nanog and SSEA-1 is down-regulated by AICAR treatment. (A, B) Representative flow cytometric profile of SSEA-1 expression on mES cells. R1 mES cells were treated with AICAR (0.5 mM, 24h), and then cells were collected and analyzed for cell surface expression of SSEA-1 by flow cytometry. The graph shows relative expression levels of SSEA-1 in R1 mES cells treated with or without AICAR (0.5 mM, 1d or 2d). Values represent mean ± SD (n=3). (C) AICAR treatment induces p53 phosphorylation and represses Nanog protein level. Cells were cultured with or without AICAR (0.5 mM) for 1 day. Total lysates were immunoblotted for phospho-p53, p53, Nanog, Oct4 and with β-actin as a loading control. A representative blot of at least three different experiments is shown. (D) AICAR treatment transiently represses nanog mRNA level, (E) but does not affect the expression of miR-134. (D) R1 cells were cultured with AICAR (0.5mM) for 9h or 24h and followed by qPCR for examining nanog mRNA and immunoblotting for Nanog protein. Relative expression levels of nanog mRNA are shown as mean ± SD (n=4). (E) R1 cells treated with AICAR for 9h were analyzed for the expression miR-134. Relative expression levels of mIR-134 are shown as mean ± SD (n=3). ** p<0.01.
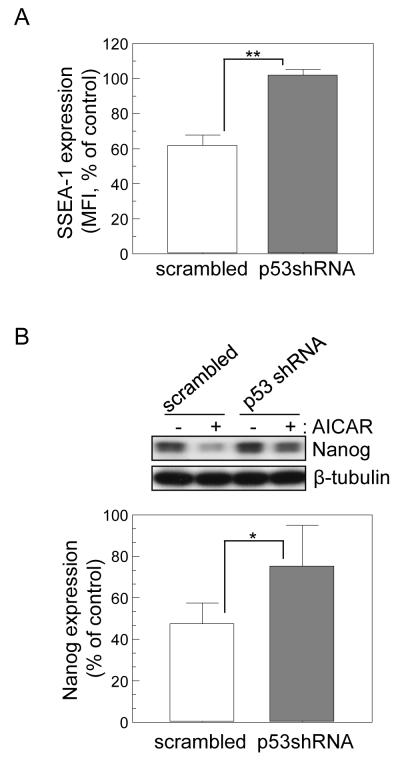
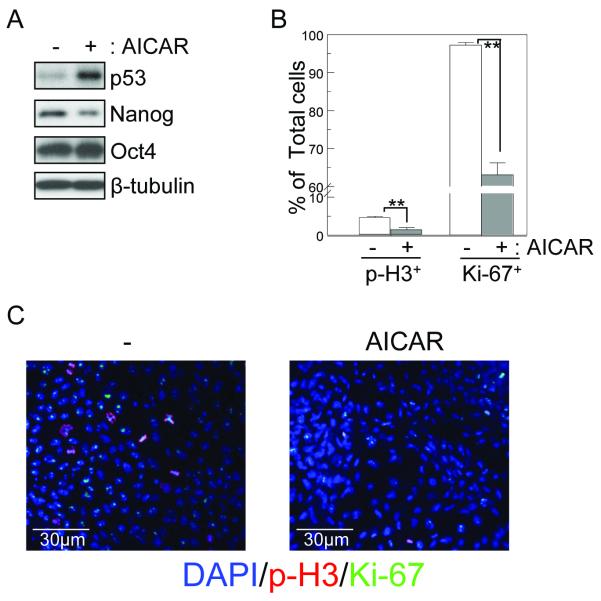
Since p53 induces differentiation of mES cells by suppressing Nanog expression [15, 36], we investigated whether p53 also mediates the AICAR-induced suppression of Nanog and SSEA-1 expression. We found that suppression of SSEA-1 and Nanog induced by AICAR was abolished by p53 knock-down. (Fig. 3A and 3B). These data suggest that AICAR-induced suppression of Nanog and SSEA-1 expression is mediated by p53. AICAR, up to 0.1 mM, had no significant effect on p53, expression (Fig, S1). Furthermore, up to 0.1 mM of AICAR did not suppress expression of Nanog and SSEA-1, paralleling the activation of p53 (Fig. S1). We also investigated whether hES cells would respond to AICAR similarly to mouse ES cells by induction of p53 and inhibition of Nanog expression. Expression of p53 was induced and Nanog suppressed in H9 hES cells upon AICAR treatment in a fashion similar to that seen in mES cells (Fig. 4A). To examine the effect of AICAR on proliferation hES cells, we performed immunofluorescence staining assays with Ki-67 (a proliferation cell marker) and phospho-Histone H3 (p-H3, a mitotic cell marker). AICAR treatment significantly decreased p-H3 and Ki-67 labeling, which reflects an inhibitory effect of AICAR on proliferation of hES cells (Fig. 4B & C).
Figure 3.
p53 plays a critical role in AICAR-induced suppression of Nanog and SSEA-1 expression in ES cells. mES cells expressing scrambled shRNA or p53 shRNA were treated with AICAR (0.5 mM) for 24 hr and then analyzed for SSEA-1expression by flow cytometry. Data are represented as mean values ± SD (n=3). ** p<0.01. (B) shRNA-expressing mES cells were treated with AICAR (0.5 mM) for 9h, and then expression levels of Nanog were compared by immunoblotting. The graph shows relative protein expression levels of Nanog in R1 mES cells treated with AICAR. Data are shown as mean values ± SD (n=5). * p<0.05.
Figure 4.
AICAR suppresses Nanog expression in and proliferation of H9 hES cells. (A) H9 hES cells were treated with or without AICAR (0.5 mM) for 1d. Cell lysates were analyzed for p53, Nanog, Oct4, and with β-tubulin as a loading control, by immunoblotting. A representative blot of at least three independent experiments is shown. (B, C) H9 hES cells treated with AICAR for 1d were analyzed for Ki-67 and phospho-histone H3 (p-H3) expression as markers for proliferating cells. % marker-positive cells are shown as mean ± SD (n=3). ** p<0.01.
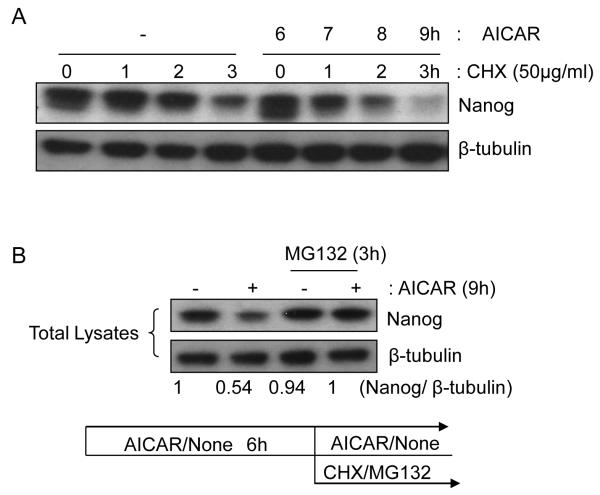
Recently, Moretto-Zito et al. reported that Nanog proteins can be stabilized by phosphorylation and interaction with Pin1 [20]. We extended our study to investigate whether AICAR increased the degradation rate of Nanog protein by measuring the half-life of Nanog protein following treatment of mouse ES cells with cycloheximide, a protein synthesis inhibitor. Our data indicated that the half-life of Nanog protein was shortened by AICAR (2.5h to 1.5h; Fig. 5A). Furthermore, MG132, a proteosome-inhibitor, recovered the Nanog protein level from the AICAR-induced degradation (Fig. 5B). These results indicate that AICAR suppresses Nanog expression via activating proteosome-dependent degradation of Nanog protein as well as p53-mediated inhibition of Nanog mRNA expression.
Figure 5.
AICAR treatment down-regulates stability of Nanog protein. (A) R1 mES cells were preincubated with or without AICAR (0.5 mM) for 6h, and then cycloheximide (CHX, 50mg/ml) for indicated hours. Lysates were analyzed by immunoblotting for Nanog and β-tubulin (loading control). (B) Proteosome inhibitor (MG132) protects Nanog from AICAR treatment. After 6h culture with or without AICAR (0.5 mM), cells were treated with MG132 (30μM) or vehicle for 3h. Cells were harvested and lysed, and then Nanog and β-tubulin levels were analyzed. A representative blot of at three different experiments is shown. A diagram shows the experimental scheme.
Effects of AICAR on erythroid developmental potential
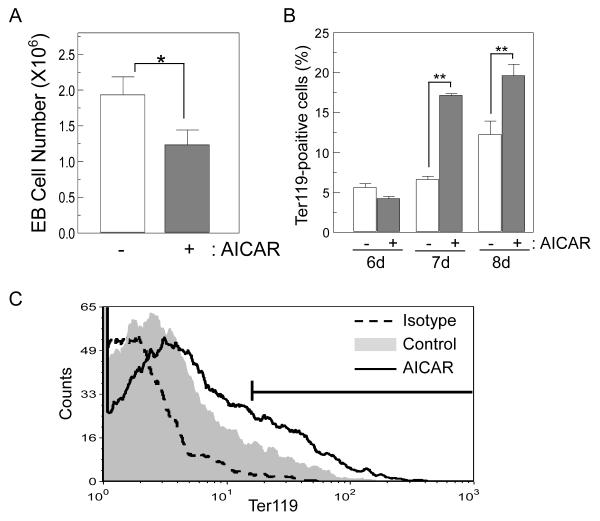
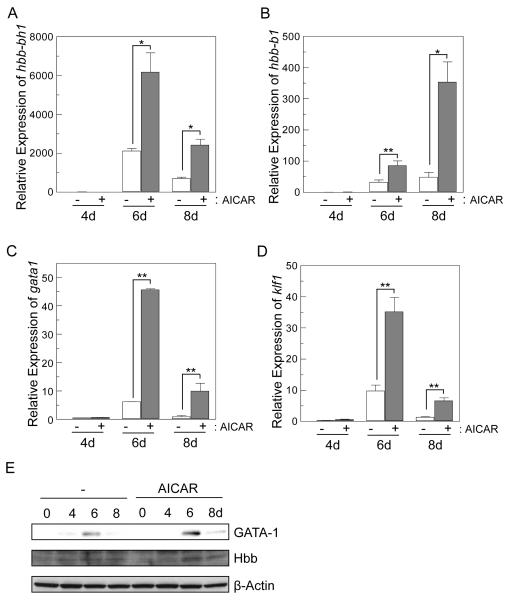
We next investigated pluripotency of mES cells upon treatment of cells with AICAR. To evaluate the effect of AICAR on the differentiation potential of mES cells, we compared EBs derived from AICAR-treated cells with those derived from control cells. mES cells can differentiate into a variety of specialized cell lineages in EBs [22, 39]. To induce differentiation of mES cells into EBs, mES cells were cultured in suspension without LIF. As shown in Fig. 6A, AICAR treatment significantly inhibited EB formation, though both EBs derived from control and AICAR-treated mES cells were similar in size. However, EBs derived from AICAR-treated cells contained more red hemoglobinized cells compared with EBs from non-treated cells (Fig. S2). To determine whether AICAR enhanced erythroid cell formation in EBs, Ter119+ populations were measured by flow cytometry. The proportions of Ter119+ cells were increased for days 7 and 8 EBs derived from AICAR-treated cells (Fig. 6B & C). Given the enhanced erythroid differentiation potential of AICAR-treated mES cells, quantitative RT-PCR was performed to analyze the expression of erythroid-specific genes in EBs. During EB development, primitive and definitive erythroid cells are generated. These two different stages of erythroid cells can be distinguishable based on the expression of different types of globin genes. Primitive erythroid cells express embryonic-specific globins (hbb-bh1), wheras Definitive erythroid cells express adult-specific globins (hbb-b1) [40]. Expression levels of both embryonic (hbb-bh1) and adult globin (hbb-b1) genes were markedly enhanced in EBs derived from AICAR-treated cells (Fig. 7A & B). GATA1 and EKLF are transcriptional factors that play a critical role in erythroid differentiation [40]. mRNA expression levels of gata1 and eklf were also substantially higher in EBs derived from AICAR-treated cells (Fig. 7C & D). To confirm expression of Hemoglobinβ (Hbb) and GATA-1, we undertook immunoblotting assays. Significantly higher levels of Hbb and GATA-1 protein were detected in EBs derived from AICAR-treated mES cells compared to those from control cells (Fig. 7E). Taken together, these results suggest that AICAR enhances specifically erythroid lineage developmental potential in EBs although it reduces numbers of EBs formed.
Figure 6.
AICAR treatment affects embryoid body (EB) formation and erythroid differentiation. (A) AICAR treatment inhibits EB formation. mES cells were cultured with or without AICAR (0.5 mM) for 1 day, and 20,000 cells were induced to form EB. Viable cells were counted at day 6 EB by Tryphan blue exclusion. (B) Enhancement of EB differentiation into erythroid lineage. Cells were differentiated as described in (A). Cell surface expression of Ter119 was analyzed at EB day 6, 7 and 8. Percentage of Ter119+ cells was measured by flow cytometry. Representative flow cytometric plot of day 7 EB is shown in (C). Data are graphed as mean ± SD (n=3). * p<0.05, ** p<0.01.
Figure 7.
Expression of erythroid transcription factors is enhanced in EB cells derived from AICAR-treated mES cells. After culture with or without AICAR (0.5 mM) for 1 day, mES cells were induced to form EB. EBs were harvested at days 4, 6 and 8. Equal amounts of RNA from mES cells or from EB-derived cells. Relative mRNA expression of embryonic globin (hbb-bh1, A), adult globin (hbb-b1, B), gata1 (C) and klf1(D) genes from days 4, 6 and 8 EBs by qRT-PCR. Expression of genes was normalized against β-tubulin expression level. Relative expression levels are presented as fold induction above expression levels in non-treated mES cells. Values are indicated as mean ± SD (n=3). * p<0.05, ** p<0.01. Expression levels of GATA-1, Hbb and β-actin were analyzed by immunoblotting (E). A representative blot of at least three independent experiments is shown.
AICAR represses endothelial developmental potential
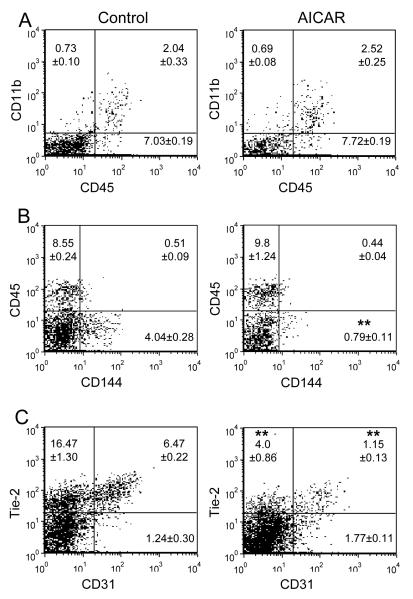
To further analyze the hematopoietic and endothelial differentiating potential of mES cells-derived EBs, we assessed cell surface markers by flow cytometry. CD45 is a marker for definitive multi-lineage hematopoietic cells and CD11b is for myeloid hematopoietic cells. The percentages of CD45+ or CD11b+ cells in day 8 EBs were not affected by AICAR treatment (Fig. 8 A), while percentages of Ter119+ primitive and definitive erythroid cells were enhanced by AICAR (Fig. 6B & 7). Endothelial populations were analyzed using CD144, CD31 and Tie-2 as markers for endothelial cells. As shown in Fig. 8 B & C, endothelial cell populations were remarkably reduced in EBs derived from AICAR-treated cells. These data indicate that erythroid developmental potential was enhanced, whereas endothelial potential was decreased in EBs derived from AICAR-treated mES cells.
Figure 8.
Flow cytometry analysis of EB-derived cells demonstrating decrease in endothelial lineage-specific markers from AICAR-treated mES cells. mES cells were induced to EB formation as described in Fig. 5. Day 8 EBs were harvested, and analyzed for the surface expression of CD11b/CD45 (A), CD45/CD144 (B) and Tie-2/CD31 (C). Flow cytometric profiles represent one out of three independent experiments. Values are shown as as mean ± SD (n=3). ** p<0.01.
Discussion
There are increasing reports showing that metabolism is closely coupled with cell cycle progression and differentiation [1-7]. Mechanisms by which cellular energy metabolism controls self-renewal and pluripotency of ES cells have not been fully explained. Understanding effects of energy metabolism on ES cell identity could provide us better tools for efficient control of propagation and directed differentiation of ES cells for regenerative therapy. We examined effects of AICAR, an AMPK activator, on proliferation, stemness and subsequent differentiation potential of mES cells. Notably, AICAR treatment represses Nanog expression at both transcriptional and post-translational levels. These alternations in ES cells enhance erythroid differentiation, whereas general EB differentiation and endothelial lineage cell formation are suppressed. Thus, we report here that AMPK, a master regulator of energy metabolism [3], plays a critical role in the self-renewal and differentiation of ES cells.
Our data showed that AICAR activated p53/p21 signaling, concurrently induction of cell cycle arrest of mES cells at G1 and S phases, with no noticeable effects on apoptosis. AMPK also has the ability to control proliferation and apoptosis in response to metabolic stresses directly or indirectly by regulating other key regulators such as p53 and mTOR [2, 3, 8, 9]. Upon glucose deprivation, AMPK phosphorylates p53 at Ser15 and activates the p53-dependent cell cycle checkpoint to induce cell cycle arrest that allows cells to survive under metabolic stress. mES cells lack a G1 checkpoint in response to DNA-damaging stress, which allows cells with damaged DNA to progress into S phase to exacerbate DNA damage, resulting in inducing apoptosis. This G1 checkpoint missing is important for rapid proliferation and removing mutated genome to preserve genomic integrity [41]. However, mES cells have the ability to be arrested at the G0/G1 phase upon serum starvation and these arrested cells have even higher capacity to differentiate into functional neuronal cells [42]. Serum starvation has been reported to activate the AMPK-p53-p21 pathway [43]. Our data suggests that the AMPK-p53-p21 pathway can be activated to induce cell cycle arrest at G1/S, likely in order to protect ES cells from metabolic stress.
Nanog and Oct4 are crucial factors for self-renewal and pluripotency of ES cells and they are cross-regulated [15]. Interestingly, AICAR inhibited expression of Nanog but not Oct4 proteins. It is reported that Nanog-silencing by siRNA does not reduce Oct4 expression in mES cells [44]. Given that Oct4 is essential for antiapoptosis of ES cells in response to stress [45], sustained Oct4 expression might protect mES cells upon AICAR treatment. Nanog mRNA was also down-regulated transiently after AICAR treatment. Nanog mRNA expression is positively controlled by LIF-STAT3, Oct4/Sox2 and FoxD3, whereas p53 negatively regulates Nanog transcription [15]. AICAR enhanced phosphorylation and protein levels of p53, suggesting that AICAR-activated p53 might directly repress Nanog mRNA expression. Even though Nanog mRNA level was recovered at 24 h after AICAR treatment, Nanog protein levels were still lower up to 24h. There are two possible mechanisms to explain this discrepancy, miRNAs and protein stability. miRNAs are post-transcriptional regulators that repress mRNA translation or modulate mRNA decay in a sequence-dependent manner. Nanog mRNA translation can also be inhibited by miRNAs [37, 38]. Our data show that expression of Nanog inhibitory miRNAs, miRNA-134 and 296, was not enhanced by AICAR. AICAR activated proteasome-dependent degradation of Nanog protein. Nanog protein is stabilized by phosphorylation (Serine 52 and 65)-dependent association with Pin1 prolyl isomerase, suppressing ubiquitination of Nanog [20]. As Nanog protein has the AMPK recognition motif for phosphorylation at Serine 104 and 267 [46], AMPK might directly control degradation of Nanog protein by phosphorylation. p53-knock-down significantly abrogated AICAR-induced suppression of Nanog expression. p53 regulates proteasomal degradation of Cdc6 and Topo I by transcriptional control of protein degradational machinery or modulation of CDK kinase activity [47, 48]. Taken together with previous reports, our data indicate that AICAR represses Nanog expression by increasing proteasome-dependent degradation of Nanog protein and suppression of Nanog mRNA expression in a p53-dependent manner. p53-p21pathway suppresses induced pluripotent stem (iPS) cells generation and the suppression of p53 enhances the efficiency of iPS cell generation [49]. Moreover, Δ40p53, a dominant-negative transactivation-deficient isoform of p53, is highly expressed in ES cells and plays a key role in maintaining the ES cells by up-regulating Nanog and SSEA-1 expression [50]. Suppression of SSEA-1 expression in AICAR-treated mES cells was restored by p53-knock-down. Thus, our data suggest that the AMPK-p53-p21 pathway plays a role in the maintenance of pluripotency of ES cells in response to energy stress.
Energy metabolism is tightly coupled with cellular fate-decisions. Knockdown of three metabolic enzymes, phosphoglycerate kinase, hexose-6-phosphate dehydrogenase and ATP citrate lyase (Acl) induces differentiation of C2C12 myoblasts to skeletal muscle. Moreover, Acl knockdown also induces erythroid differentiation of the K562 leukemia cell line [4, 7]. Overexpression of glycolytic enzymes, phosphoglycerate mutase and glucosephosphate isomerase facilitates immortalization of MEFs [1]. Glucose metabolism is also crucial in embryogenesis. Metabolism is changed from pyruvate oxidation to glycolysis-based metabolism in blastocysts during the late cleavage stage [51]. Cardiac differentiation from ES cells requires metabolic switch from anaerobic glycolysis to mitochondrial oxidative metabolism [52]. Though high glucose levels are usually used for maintenance of ES cell culture, the differentiation potential of mES cells can modulated by changing the glucose level in culture medium [12-14]. AMPK activity is also closely related with myoblast [53], osteoblast [54] and adipocyte differentiation [55].
Nanog is a core transcriptional factor for controlling self-renewal and pluripotency of ES cells. Over-expression of Nanog can maintain the undifferentiated status of mES cells without LIF [16, 17]. Therefore, ES cell differentiation requires down-regulation of Nanog expression. Nanog-deleted or down-regulated ES cells are susceptible to differentiation [56]. Notably, Nanog functions as a regulator of fate-decision of ES cells in a dose-dependent manner. While Nanog heterozygote (+/−) ES cells expressing half the amount of Nanog proteins can differentiate to endodermal, mesodermal, and ectodermal cells in the presence of LIF, complete knock-down of Nanog expression leads to exclusive differentiation to extraembryonic endoderm [17, 56, 57]. The ES cell population is heterogeneous in terms of Nanog expression, with a distribution of Nanog-high and Nanog-low populations. Nanog-high ES cells show high proliferation rate and are more resistant to spontaneous differentiation. Nanog-low ES cells are unstable and can be easily differentiated [18, 19]. Inhibition of Nanog-stabilizing protein Pin1 reduces Nanog protein level, which also results in suppressing self-renewal and teratoma formation of ES cells [20]. Our data demonstrate that erythroid developmental potential was enhanced, whereas endothelial potential was impaired in EBs derived from AICAR-treated mES cells, implicating energy metabolism controlled by AMPK signaling in developmental fate decision during mES cell differentiation.
Supplementary Material
Acknowledgments
We are grateful to Dr. Andras Nagy (Samuel Lunenfeld Research Institute) for providing R1 mES cells. We thank Young-June Kim for helpful comments and discussion on the manuscript. These studies were supported by Public Health Service grants R01 HL56416 and R01 HL67384 from the National Institutes of Health to H.E.B.
Footnotes
Conflict-of-interest disclosure: The authors have no conflicts of interest to disclose.
References
- 1.Kondoh H, Lleonart ME, Gil J, et al. Glycolytic enzymes can modulate cellular life span. Cancer Res. 2005;65:177–185. [PubMed] [Google Scholar]
- 2.Cairns RA, Harris IS, Mak TW. Regulation of cancer cell metabolism. Nat Rev Cancer. 2011;11:85–95. doi: 10.1038/nrc2981. [DOI] [PubMed] [Google Scholar]
- 3.Luo Z, Zang M, Guo W. AMPK as a metabolic tumor suppressor: control of metabolism and cell growth. Future Oncol. 2010;6:457–470. doi: 10.2217/fon.09.174. [DOI] [PMC free article] [PubMed] [Google Scholar]
- 4.McGraw TE, Mittal V. Stem cells: Metabolism regulates differentiation. Nat Chem Biol. 2010;6:176–177. doi: 10.1038/nchembio.324. [DOI] [PubMed] [Google Scholar]
- 5.Rappolee DA. Impact of transient stress and stress enzymes on development. Dev Biol. 2007;304:1–8. doi: 10.1016/j.ydbio.2006.12.032. [DOI] [PubMed] [Google Scholar]
- 6.Schieke SM, Ma M, Cao L, et al. Mitochondrial metabolism modulates differentiation and teratoma formation capacity in mouse embryonic stem cells. J Biol Chem. 2008;283:28506–28512. doi: 10.1074/jbc.M802763200. [DOI] [PMC free article] [PubMed] [Google Scholar]
- 7.Bracha AL, Ramanathan A, Huang S, et al. Carbon metabolism-mediated myogenic differentiation. Nat Chem Biol. 2010;6:202–204. doi: 10.1038/nchembio.301. [DOI] [PMC free article] [PubMed] [Google Scholar]
- 8.Jones RG, Plas DR, Kubek S, et al. AMP-activated protein kinase induces a p53-dependent metabolic checkpoint. Mol Cell. 2005;18:283–293. doi: 10.1016/j.molcel.2005.03.027. [DOI] [PubMed] [Google Scholar]
- 9.Dasgupta B, Milbrandt J. AMP-activated protein kinase phosphorylates retinoblastoma protein to control mammalian brain development. Dev Cell. 2009;16:256–270. doi: 10.1016/j.devcel.2009.01.005. [DOI] [PMC free article] [PubMed] [Google Scholar]
- 10.Biswas A, Hutchins R. Embryonic stem cells. Stem Cells Dev. 2007;16:213–222. doi: 10.1089/scd.2006.0081. [DOI] [PubMed] [Google Scholar]
- 11.Nishikawa S, Jakt LM, Era T. Embryonic stem-cell culture as a tool for developmental cell biology. Nat Rev Mol Cell Biol. 2007;8:502–507. doi: 10.1038/nrm2189. [DOI] [PubMed] [Google Scholar]
- 12.Kim YH, Heo JS, Han HJ. High glucose increase cell cycle regulatory proteins level of mouse embryonic stem cells via PI3-K/Akt and MAPKs signal pathways. J Cell Physiol. 2006;209:94–102. doi: 10.1002/jcp.20706. [DOI] [PubMed] [Google Scholar]
- 13.Crespo FL, Sobrado VR, Gomez L, et al. Mitochondrial reactive oxygen species mediate cardiomyocyte formation from embryonic stem cells in high glucose. Stem Cells. 2010;28:1132–1142. doi: 10.1002/stem.441. [DOI] [PubMed] [Google Scholar]
- 14.Khoo MLM, McQuade LR, Smith MSR, et al. Growth and Differentiation of Embryoid Bodies Derived from Human Embryonic Stem Cells: Effect of Glucose and Basic Fibroblast Growth Factor. Biology of Reproduction. 2005;73:1147–1156. doi: 10.1095/biolreprod.104.036673. [DOI] [PubMed] [Google Scholar]
- 15.Pan G, Thomson JA. Nanog and transcriptional networks in embryonic stem cell pluripotency. Cell Res. 2007;17:42–49. doi: 10.1038/sj.cr.7310125. [DOI] [PubMed] [Google Scholar]
- 16.Chambers I, Colby D, Robertson M, et al. Functional expression cloning of Nanog, a pluripotency sustaining factor in embryonic stem cells. Cell. 2003;113:643–655. doi: 10.1016/s0092-8674(03)00392-1. [DOI] [PubMed] [Google Scholar]
- 17.Mitsui K, Tokuzawa Y, Itoh H, et al. The homeoprotein Nanog is required for maintenance of pluripotency in mouse epiblast and ES cells. Cell. 2003;113:631–642. doi: 10.1016/s0092-8674(03)00393-3. [DOI] [PubMed] [Google Scholar]
- 18.Kalmar T, Lim C, Hayward P, et al. Regulated fluctuations in nanog expression mediate cell fate decisions in embryonic stem cells. PLoS Biol. 2009;7:e1000149. doi: 10.1371/journal.pbio.1000149. [DOI] [PMC free article] [PubMed] [Google Scholar]
- 19.Singh AM, Hamazaki T, Hankowski KE, et al. A heterogeneous expression pattern for Nanog in embryonic stem cells. Stem Cells. 2007;25:2534–2542. doi: 10.1634/stemcells.2007-0126. [DOI] [PubMed] [Google Scholar]
- 20.Moretto-Zita M, Jin H, Shen Z, et al. Phosphorylation stabilizes Nanog by promoting its interaction with Pin1. Proc Natl Acad Sci U S A. 2010;107:13312–13317. doi: 10.1073/pnas.1005847107. [DOI] [PMC free article] [PubMed] [Google Scholar]
- 21.Nagy A, Rossant J, Nagy R, et al. Derivation of completely cell culture-derived mice from early-passage embryonic stem cells. Proc Natl Acad Sci U S A. 1993;90:8424–8428. doi: 10.1073/pnas.90.18.8424. [DOI] [PMC free article] [PubMed] [Google Scholar]
- 22.Ma YD, Lugus JJ, Park C, et al. Differentiation of mouse embryonic stem cells into blood. Curr Protoc Stem Cell Biol. 2008 doi: 10.1002/9780470151808.sc01f04s6. Chapter 1:Unit 1F 4. [DOI] [PMC free article] [PubMed] [Google Scholar]
- 23.Lee MR, Kim JS, Kim K-S. miR-124a Is Important for Migratory Cell Fate Transition During Gastrulation of Human Embryonic Stem Cells. Stem Cells. 2010;28:1550–1559. doi: 10.1002/stem.490. [DOI] [PubMed] [Google Scholar]
- 24.Mondal A, Sawant D, Dent AL. Transcriptional Repressor BCL6 Controls Th17 Responses by Controlling Gene Expression in Both T Cells and Macrophages. The Journal of Immunology. 2010;184:4123–4132. doi: 10.4049/jimmunol.0901242. [DOI] [PubMed] [Google Scholar]
- 25.Livak KJ, Schmittgen TD. Analysis of Relative Gene Expression Data Using Real-Time Quantitative PCR and the 2-[Delta][Delta]CT Method. Methods. 2001;25:402–408. doi: 10.1006/meth.2001.1262. [DOI] [PubMed] [Google Scholar]
- 26.Salt IP, Johnson G, Ashcroft SJ, et al. AMP-activated protein kinase is activated by low glucose in cell lines derived from pancreatic beta cells, and may regulate insulin release. Biochem J. 1998;335(Pt 3):533–539. doi: 10.1042/bj3350533. [DOI] [PMC free article] [PubMed] [Google Scholar]
- 27.Xie H, Valera VA, Merino MJ, et al. LDH-A inhibition, a therapeutic strategy for treatment of hereditary leiomyomatosis and renal cell cancer. Molecular Cancer Therapeutics. 2009;8:626–635. doi: 10.1158/1535-7163.MCT-08-1049. [DOI] [PMC free article] [PubMed] [Google Scholar]
- 28.Boiani M, Scholer HR. Regulatory networks in embryo-derived pluripotent stem cells. Nat Rev Mol Cell Biol. 2005;6:872–884. doi: 10.1038/nrm1744. [DOI] [PubMed] [Google Scholar]
- 29.Wang Y, Liang Y, Vanhoutte PM. SIRT1 and AMPK in regulating mammalian senescence: A critical review and a working model. FEBS Letters. 2011;585:986–994. doi: 10.1016/j.febslet.2010.11.047. [DOI] [PubMed] [Google Scholar]
- 30.Chae H-D, Broxmeyer HE. SIRT1 Deficiency Downregulates PTEN/JNK/FOXO1 Pathway to Block ROS-Induced Apoptosis in Mouse Embryonic Stem Cells. Stem Cells and Development. 2011 doi: 10.1089/scd.2010.0465. 0:null. [DOI] [PMC free article] [PubMed] [Google Scholar]
- 31.Canto C, Gerhart-Hines Z, Feige JN, et al. AMPK regulates energy expenditure by modulating NAD+ metabolism and SIRT1 activity. Nature. 2009;458:1056–1060. doi: 10.1038/nature07813. [DOI] [PMC free article] [PubMed] [Google Scholar]
- 32.Malumbres M, Barbacid M. Mammalian cyclin-dependent kinases. Trends in Biochemical Sciences. 2005;30:630–641. doi: 10.1016/j.tibs.2005.09.005. [DOI] [PubMed] [Google Scholar]
- 33.Zhao T, Xu Y. p53 and stem cells: new developments and new concerns. Trends Cell Biol. 2010;20:170–175. doi: 10.1016/j.tcb.2009.12.004. [DOI] [PubMed] [Google Scholar]
- 34.Savatier P, Huang S, Szekely L, et al. Contrasting patterns of retinoblastoma protein expression in mouse embryonic stem cells and embryonic fibroblasts. Oncogene. 1994;9:809–818. [PubMed] [Google Scholar]
- 35.Macarthur BD, Ma’ayan A, Lemischka IR. Systems biology of stem cell fate and cellular reprogramming. Nat Rev Mol Cell Biol. 2009;10:672–681. doi: 10.1038/nrm2766. [DOI] [PMC free article] [PubMed] [Google Scholar]
- 36.Lin T, Chao C, Saito S, et al. p53 induces differentiation of mouse embryonic stem cells by suppressing Nanog expression. Nat Cell Biol. 2005;7:165–171. doi: 10.1038/ncb1211. [DOI] [PubMed] [Google Scholar]
- 37.Tay Y, Zhang J, Thomson AM, et al. MicroRNAs to Nanog, Oct4 and Sox2 coding regions modulate embryonic stem cell differentiation. Nature. 2008;455:1124–1128. doi: 10.1038/nature07299. [DOI] [PubMed] [Google Scholar]
- 38.Tay YM, Tam WL, Ang YS, et al. MicroRNA-134 modulates the differentiation of mouse embryonic stem cells, where it causes post-transcriptional attenuation of Nanog and LRH1. Stem Cells. 2008;26:17–29. doi: 10.1634/stemcells.2007-0295. [DOI] [PubMed] [Google Scholar]
- 39.Wiese C, Kania G, Rolletschek A, et al. Pluripotency: capacity for in vitro differentiation of undifferentiated embryonic stem cells. Methods Mol Biol. 2006;325:181–205. doi: 10.1385/1-59745-005-7:181. [DOI] [PubMed] [Google Scholar]
- 40.Tsiftsoglou AS, Vizirianakis IS, Strouboulis J. Erythropoiesis: model systems, molecular regulators, and developmental programs. IUBMB Life. 2009;61:800–830. doi: 10.1002/iub.226. [DOI] [PubMed] [Google Scholar]
- 41.Stambrook PJ, Tichy ED. Preservation of genomic integrity in mouse embryonic stem cells. Adv Exp Med Biol. 2010;695:59–75. doi: 10.1007/978-1-4419-7037-4_5. [DOI] [PMC free article] [PubMed] [Google Scholar]
- 42.Zhang E, Li X, Zhang S, et al. Cell cycle synchronization of embryonic stem cells: effect of serum deprivation on the differentiation of embryonic bodies in vitro. Biochem Biophys Res Commun. 2005;333:1171–1177. doi: 10.1016/j.bbrc.2005.05.200. [DOI] [PubMed] [Google Scholar]
- 43.Ching JK, Rajguru P, Marupudi N, et al. A role for AMPK in increased insulin action after serum starvation. American Journal of Physiology - Cell Physiology. 2010;299:C1171–C1179. doi: 10.1152/ajpcell.00514.2009. [DOI] [PMC free article] [PubMed] [Google Scholar]
- 44.Liu N, Feng X, Fang Z, et al. Identification of genes regulated by nanog which is involved in ES cells pluripotency and early differentiation. J Cell Biochem. 2008;104:2348–2362. doi: 10.1002/jcb.21795. [DOI] [PubMed] [Google Scholar]
- 45.Guo Y, Mantel C, Hromas RA, et al. Oct-4 Is Critical for Survival/Antiapoptosis of Murine Embryonic Stem Cells Subjected to Stress: Effects Associated with Stat3/Survivin. Stem Cells. 2008;26:30–34. doi: 10.1634/stemcells.2007-0401. [DOI] [PMC free article] [PubMed] [Google Scholar]
- 46.Obenauer JC, Cantley LC, Yaffe MB. Scansite 2.0: proteome-wide prediction of cell signaling interactions using short sequence motifs. Nucleic Acids Research. 2003;31:3635–3641. doi: 10.1093/nar/gkg584. [DOI] [PMC free article] [PubMed] [Google Scholar]
- 47.Duursma A, Agami R. p53-Dependent Regulation of Cdc6 Protein Stability Controls Cellular Proliferation. Mol. Cell. Biol. 2005;25:6937–6947. doi: 10.1128/MCB.25.16.6937-6947.2005. [DOI] [PMC free article] [PubMed] [Google Scholar]
- 48.Tomicic MT, Christmann M, Kaina B. Topotecan-Triggered Degradation of Topoisomerase I Is p53-Dependent and Impacts Cell Survival. Cancer Research. 2005;65:8920–8926. doi: 10.1158/0008-5472.CAN-05-0266. [DOI] [PubMed] [Google Scholar]
- 49.Hong H, Takahashi K, Ichisaka T, et al. Suppression of induced pluripotent stem cell generation by the p53–p21 pathway. Nature. 2009;460:1132–1135. doi: 10.1038/nature08235. [DOI] [PMC free article] [PubMed] [Google Scholar]
- 50.Ungewitter E, Scrable H. Δ40p53 controls the switch from pluripotency to differentiation by regulating IGF signaling in ESCs. Genes & Development. 2010;24:2408–2419. doi: 10.1101/gad.1987810. [DOI] [PMC free article] [PubMed] [Google Scholar]
- 51.Dumollard R, Ward Z, Carroll J, et al. Regulation of redox metabolism in the mouse oocyte and embryo. Development. 2007;134:455–465. doi: 10.1242/dev.02744. [DOI] [PubMed] [Google Scholar]
- 52.Chung S, Dzeja PP, Faustino RS, et al. Mitochondrial oxidative metabolism is required for the cardiac differentiation of stem cells. Nat Clin Pract Cardiovasc Med. 2007;4:S60–S67. doi: 10.1038/ncpcardio0766. [DOI] [PMC free article] [PubMed] [Google Scholar]
- 53.Williamson DL, Butler DC, Alway SE. AMPK inhibits myoblast differentiation through a PGC-1alpha-dependent mechanism. Am J Physiol Endocrinol Metab. 2009;297:E304–314. doi: 10.1152/ajpendo.91007.2008. [DOI] [PMC free article] [PubMed] [Google Scholar]
- 54.Kasai T, Bandow K, Suzuki H, et al. Osteoblast differentiation is functionally associated with decreased AMP kinase activity. J Cell Physiol. 2009;221:740–749. doi: 10.1002/jcp.21917. [DOI] [PubMed] [Google Scholar]
- 55.Giri S, Rattan R, Haq E, et al. AICAR inhibits adipocyte differentiation in 3T3L1 and restores metabolic alterations in diet-induced obesity mice model. Nutr Metab (Lond) 2006;3:31. doi: 10.1186/1743-7075-3-31. [DOI] [PMC free article] [PubMed] [Google Scholar]
- 56.Bourillot P-Y, Aksoy I, Schreiber V, et al. Novel STAT3 Target Genes Exert Distinct Roles in the Inhibition of Mesoderm and Endoderm Differentiation in Cooperation with Nanog. Stem Cells. 2009;27:1760–1771. doi: 10.1002/stem.110. [DOI] [PubMed] [Google Scholar]
- 57.Hatano S-y, Tada M, Kimura H, et al. Pluripotential competence of cells associated with Nanog activity. Mechanisms of Development. 2005;122:67–79. doi: 10.1016/j.mod.2004.08.008. [DOI] [PubMed] [Google Scholar]
Associated Data
This section collects any data citations, data availability statements, or supplementary materials included in this article.


