Abstract
We have demonstrated previously that overactivity of the renin-angiotensin system (RAS) is associated with whole body and skeletal muscle insulin resistance in obese Zucker (fa/fa) rats. Moreover, this obesity-associated insulin resistance is reduced by treatment with angiotensin-converting enzyme inhibitors or angiotensin receptor (type 1) blockers. However, it is currently unknown whether specific inhibition of renin itself, the rate-limiting step in RAS functionality, improves insulin action in obesity-associated insulin resistance. Therefore, the present study assessed the effect of chronic, selective renin inhibition using aliskiren on glucose tolerance, whole body insulin sensitivity, and insulin action on the glucose transport system in skeletal muscle of obese Zucker rats. Obese Zucker rats were treated for 21 days with either vehicle or aliskiren (50 mg/kg body wt ip). Renin inhibition was associated with a significant lowering (10%, P < 0.05) of resting systolic blood pressure and induced reductions in fasting plasma glucose (11%) and free fatty acids (46%) and homeostatic model assessment for insulin resistance (13%). Glucose tolerance (glucose area under the curve) and whole body insulin sensitivity (inverse of the glucose-insulin index) during an oral glucose tolerance test were improved by 15% and 16%, respectively, following chronic renin inhibition. Moreover, insulin-stimulated glucose transport activity in isolated soleus muscle of renin inhibitor-treated animals was increased by 36% and was associated with a 2.2-fold greater Akt Ser473 phosphorylation. These data provide evidence that chronic selective inhibition of renin activity leads to improvements in glucose tolerance and whole body insulin sensitivity in the insulin-resistant obese Zucker rat. Importantly, chronic renin inhibition is associated with upregulation of insulin action on skeletal muscle glucose transport, and it may involve improved Akt signaling. These data support the strategy of targeting the RAS to improve both blood pressure regulation and insulin action in conditions of insulin resistance.
Keywords: renin-angiotensin system, insulin resistance, glucose transport activity, obesity, insulin signaling
insulin resistance of skeletal muscle glucose transport is a core defect in the metabolic syndrome, and, as such, it is often accompanied by essential hypertension, hyperinsulinemia, glucose intolerance, visceral obesity, dyslipidemia, and inflammation (3, 13). Insulin is the primary regulator of glucose disposal, and skeletal muscle is the major tissue responsible for insulin-stimulated glucose uptake (26). Insulin resistance develops when normal insulin levels do not mediate the required disposal of blood glucose by skeletal muscle. Insulin resistance increases the risk for the development of type 2 diabetes and cardiovascular disease (25). The prevalence of diabetes and obesity is increasing in the U.S. population. The Centers for Disease Control and Prevention estimate that in 2011, 25.8 million individuals in the United States have diabetes, and an additional 79 million are in a prediabetic state with established insulin resistance (1). Furthermore, it is estimated that 68% of the population in the United States is considered overweight (BMI ≥ 25) or obese (BMI ≥ 30) (8). It is, therefore, critical to understand the etiology of skeletal muscle insulin resistance and to develop appropriate interventions to lessen the impact of diabetes and obesity on the population.
Hypertension is an independent risk factor for the development of insulin resistance. The renin-angiotensin system (RAS) is critical for normal blood pressure regulation. In this system, prorenin in the kidney is transformed into renin and released into circulation. Renin is a peptidase, and its action represents the rate-limiting step in the RAS cascade (11, 29). Renin converts angiotensinogen into ANG I, which is then acted upon by angiotensin-converting enzyme (ACE) to produce the potent vasoconstrictor, ANG II (14, 19). ANG II has been shown to negatively affect insulin action in skeletal muscle (4, 14, 24). A proposed mechanism for the deleterious action of ANG II is through the production of reactive oxygen species (ROS), causing defects in the insulin-signaling pathway (4, 20). In this way, RAS overactivity can increase the risk of both hypertension and insulin resistance.
ACE inhibitors and ANG II receptor blockers (ARBs) are commonly prescribed as antihypertensive agents, and these compounds have been used to demonstrate the critical role of the RAS in the regulation of blood pressure and insulin action. In previous investigations, preventing the formation or action of ANG II by ACE inhibitors or ARBs has been shown to improve insulin action (5). As renin is required for production of ANG I and ANG II, renin inhibition can be differentiated from ACE inhibition and ARB treatment as an antihypertensive intervention (29).
Aliskiren is a potent and selective inhibitor of renin (32), the enzyme considered to be the rate-limiting step in the RAS (11). Previous studies involving renin inhibition have been performed in the insulin-resistant state (11, 18), but none have involved a model of obesity. The obese Zucker rat, which features a defect in the gene for the leptin receptor, is a widely used model of obesity-associated insulin resistance (14, 21). The purpose of the present study was to test the hypothesis that chronic (21 days) in vivo inhibition of renin by aliskiren will lower blood pressure and improve glucose tolerance, whole-body insulin action, and skeletal muscle glucose transport activity in obese Zucker rats.
MATERIALS AND METHODS
Animals and treatments.
Female obese Zucker (fa/fa) rats (Harlan, Indianapolis, IN) were received at 7 or 8 wk of age. Animals were housed in a temperature-controlled room (20–22°C) at the Arizona Health Sciences Center Animal Care Facility of the University of Arizona with a 12:12-h light-dark cycle (lights on from 7 AM to 7 PM). The animals had free access to chow (Purina, St Louis, MO) and water. All procedures were approved by the University of Arizona Animal Use and Care Committee.
Starting at 8–9 wk of age (weighing 270 to 300 g), animals were randomly assigned to one of two groups: a vehicle-treated control group or an aliskiren-treated group. Animals were weighed and received 50 mg/kg body wt of either vehicle (0.9% saline) or aliskiren by intraperitoneal injection for 21 consecutive days.
Blood pressure and heart rate measurements.
Systolic blood pressure (SBP), diastolic blood pressure (DBP), and heart rate were measured noninvasively by tail-cuff plethysmography (NIBP-8 noninvasive blood pressure monitor; Columbus Instruments, Columbus, OH). The unanesthetized rats were placed in acrylic glass holding tubes for the blood pressure measurements. They were acclimatized by placing them in these tubes daily and having the tail-cuff positioned at the base of the tail and inflated during the week leading up to the initiation of the study. Baseline blood pressure measurements were obtained on the first day of dosing, and subsequently on days 7, 14, and 19.
Determination of glucose tolerance and insulin sensitivity.
All animals were restricted from food (4 g of chow given at 5 PM) the evening before the oral glucose tolerance test (OGTT). Between 8:00 and 10:00 AM on day 16 of the study, ∼12 h after the most recent treatment, rats were administered a 1 g/kg body wt glucose feeding by gavage. Blood was drawn from a cut at the tip of the tail before (time 0) and at 15, 30, 60, and 120 min after the glucose feeding. Whole blood was thoroughly mixed with EDTA (18 mM final concentration) and centrifuged at 13,000 g to separate the plasma. Plasma samples were stored at −80°C and subsequently analyzed for glucose (Fisher, Houston, TX), insulin (Linco, St. Charles, MO), and free fatty acids (FFA) (Wako, Richmond, VA). Fasting whole-body insulin sensitivity was estimated using the homeostasis model assessment of insulin resistance (HOMA-IR) by using the formula: [fasting plasma glucose (mg/dl) × fasting plasma insulin (μU/ml)]/405 (22). The glucose-insulin index is an inverse measure of whole-body insulin sensitivity during the OGTT and is defined as the product of the glucose area under the curve (AUC) and insulin AUC (2). Immediately after completion of the OGTT, all animals received 2.5 ml of sterile 0.9% saline subcutaneously to compensate for plasma loss. Vehicle or aliskiren treatments were recommenced the following day for five further days.
Assessment of glucose transport activity.
On day 21, animals were food-restricted as described above before the OGTT. Between 8:00 and 10:00 AM, ∼12 h after the final chronic aliskiren treatment, animals were deeply anesthetized by intraperitoneal injection of pentobarbital sodium (50 mg/kg ip body wt Nembutal; Abbott Laboratories, North Chicago, IL). Both soleus muscles were surgically removed and prepared for in vitro incubation. Muscles were split into two paired strips (∼30–40 mg). The muscles were incubated for 1 h at 37°C in 3 ml oxygenated (95% O2-5% CO2) Krebs-Henseleit buffer (KHB) containing 8 mM glucose, 32 mM mannitol, and 0.1% BSA (radioimmunoassay grade; Sigma Chemical, St. Louis, MO). One soleus strip of the pair was incubated in the absence of insulin, and the other strip was incubated in the presence of insulin (5 mU/ml; Humulin R, Indianapolis, IN). Following the initial incubation, one set of soleus muscles were removed and prepared for use in the assay of signaling proteins. These strips were trimmed of connective tissue, quickly frozen in liquid nitrogen, weighed, and stored at −80°C. The other set of soleus muscles were transferred for 10 min into 3 ml of an oxygenated 37°C KHB rinse containing 40 mM mannitol, 0.1% BSA, and insulin, if present previously. Afterward, the muscles were transferred to 2 ml oxygenated KHB containing 1 mM 2-deoxy[1,2-3H]glucose (300 mCi/mmol; Sigma Chemical), 39 mM [U-14C]mannitol (0.8 mCi/mmol; ICN Radiochemicals, Irvine, CA), 0.1% BSA, and insulin, if present previously, for 20 min. Following this final incubation, the muscles were trimmed of connective tissue, frozen in liquid nitrogen, weighed, and dissolved in 0.5 ml of 0.5 N NaOH at 60°C. After the muscle was completely dissolved, 5 ml of scintillation cocktail were added, and the intracellular accumulation of the glucose analog 2-DG was measured as described previously (6, 15). This method for assessing glucose transport activity in isolated muscle has been validated (10, 12).
Functionality of insulin-signaling proteins.
Frozen muscle was homogenized in 8 vol of cold lysis buffer (50 mM HEPES, 150 mM NaCl, 20 mM sodium pyrophosphate, 20 mM β-glycerophosphate, 10 mM NaF, 2 mM Na3VO4, 2 mM EDTA, 1% Triton X-100, 10% glycerol, 1 mM MgCl2, 1 mM CaCl2, 10 g/ml aprotinin, 10 g/ml leupeptin, 0.5 g/ml pepstatin, and 2 mM phenylmethylsulfonyl fluoride). Homogenates were placed on ice and then centrifuged at 13,000 g at 4°C. Total protein assay was performed by the BCA method (Sigma Chemical). Akt Ser473 and GSK-3β Ser9 phosphorylation was determined by immunoblotting with commercially available antibodies [no. 9271 for Akt Ser467, no. 9272 for total Akt, and no. 9331 for GSK3β Ser21/9 (Cell Signaling Technology, Danvers, MA) and no. 05–412 for total GSK-3 (Upstate Biotechnology, Lake Placid, NY)], as described previously (6). GLUT-4 protein levels in plantaris muscle were also determined by immunoblotting (no. ab654; Abcam, Cambridge, MA).
Statistical analysis.
All values are expressed as means ± SE. The significance of differences between vehicle-treated and aliskiren-treated groups was assessed by one-way ANOVA with a post hoc Dunnett test using SPSS computer software (version 16.0; Chicago, IL) or by an unpaired Student's t-test, as appropriate. A level of P < 0.05 was set for statistical significance.
RESULTS
Body weight and blood pressure.
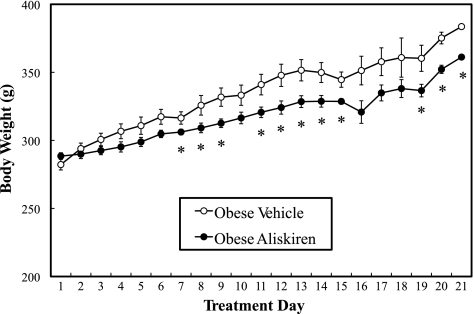
The initial average body weight of the vehicle-treated obese animals (282 ± 4 g) did not differ from that of the aliskiren-treated animals (288 ± 3 g). At most time points after day 6, the average body weight of the aliskiren-treated animals was slightly, but significantly (P < 0.05), lower compared with the corresponding vehicle-treated controls (Fig. 1). Moreover, the final body weight of the aliskiren-treated animals (337 ± 10 g) (P < 0.05) was significantly less than that of the vehicle-treated animals (360 ± 5 g), indicating a potential role of renin inhibition in body weight regulation, as observed previously in the TG(mREN2)27 rat (11).
Fig. 1.
Effect of chronic aliskiren treatment on animal body weights. Values are expressed as means ± SE for 4 or 5 animals per group. *P < 0.05, aliskiren vs. vehicle.
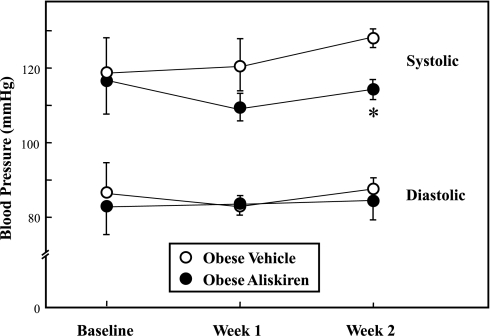
Baseline blood pressure measurements showed no significant differences between the obese vehicle-treated and aliskiren-treated Zucker rat groups (Fig. 2). By the second week, SBP in the aliskiren-treated group was significantly (10%, P < 0.05) lower compared with the vehicle-treated group. There were no differences in DBP (Fig. 2) or heart rate (data not shown) between the two groups. The absolute heart weight in the chronic aliskiren-treated animals (669 ± 14 mg) tended (P = 0.074) to be lower than that of the vehicle-treated control group (699 ± 3 mg), but this difference did not reach statistical significance. The ratio of heart weight to body weight did not differ between the vehicle-treated control group (1.95 ± 0.07 g/g) and the chronic aliskiren-treated group (1.98 ± 0.05 g/g).
Fig. 2.
Effect of chronic aliskiren treatment on systolic and diastolic blood pressure. Values are expressed as means ± SE for 4 or 5 animals per group. *P < 0.05, aliskiren vs. vehicle.
Plasma glucose, insulin, and FFAs.
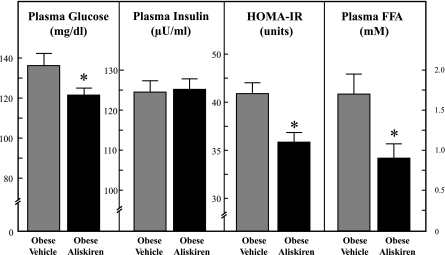
Aliskiren treatment induced a significant reduction (11%, P < 0.05) in fasting plasma glucose compared with the vehicle-treated animals (Fig. 3). Chronic renin inhibition did not affect fasting plasma insulin. HOMA-IR, an index of fasting insulin resistance, was 13% less (P < 0.05) in the aliskiren-treated group than in the vehicle-treated group. In addition, chronic renin inhibition reduced fasting plasma FFA levels by 46% (P < 0.05) compared with control.
Fig. 3.
Effect of chronic aliskiren treatment on fasting plasma glucose, insulin, and FFAs. HOMA-IR is inversely related to fasting whole body insulin sensitivity. Values are expressed as means ± SE for 4 or 5 animals per group. *P < 0.05, aliskiren vs. vehicle.
Glucose tolerance and insulin sensitivity.
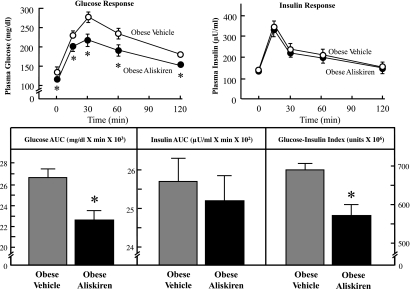
Chronic treatment with aliskiren led to a significantly lesser (11%, 10%, 19%, 15%, and 13%) glucose response during the OGTT at the respective time points (0, 15, 30, 60, and 120 min) compared with the vehicle-treated group (Fig. 4). The total integrated AUC for glucose during the OGTT was reduced by 15% (P < 0.05) in the aliskiren-treated group. In contrast, aliskiren treatment had no effect on the insulin response during the OGTT. Chronic renin inhibition significantly lowered the glucose-insulin index by 16% (P < 0.05) compared with control, reflecting a significant enhancement of whole body insulin sensitivity.
Fig. 4.
Effect of chronic aliskiren treatment on glucose tolerance and whole body insulin sensitivity. Values are expressed as means ± SE for 4 or 5 animals per group. *P < 0.05, aliskiren vs. vehicle.
Glucose transport activity and insulin signaling in skeletal muscle.
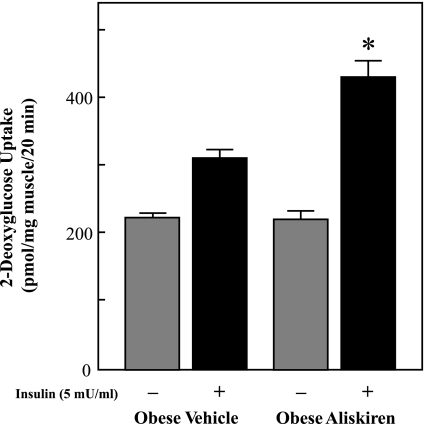
Insulin-stimulated glucose transport activity was assessed in isolated soleus muscle strips to determine the cellular locus for the enhancement of insulin action (Fig. 5). Rates of 2-DG uptake in the absence of insulin were not significantly different between the aliskiren-treated and vehicle-treated groups. Insulin-stimulated glucose transport activity was enhanced by 36% (P < 0.05) in skeletal muscle from the aliskiren-treated animals compared with controls.
Fig. 5.
Effect of chronic aliskiren treatment on insulin-stimulated glucose transport activity in soleus muscle. Values are expressed as means ± SE for 4 or 5 animals per group. *P < 0.05, aliskiren vs. vehicle.
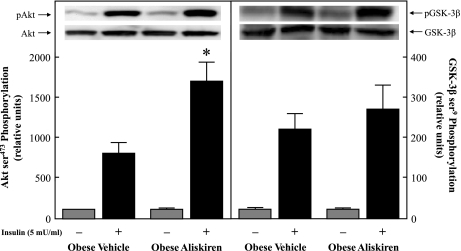
The functionality of two critical distal elements of the insulin-signaling pathway in isolated soleus muscle was determined (Fig. 6). Phosphorylation of Akt Ser473 in the presence of insulin was significantly enhanced by more than twofold (P < 0.05) in the chronic aliskiren-treated group compared with the vehicle-treated group (Fig. 6, left). However, Ser9 phosphorylation of GSK-3β in the presence of insulin did not differ between groups (Fig. 6, right). In addition, although GLUT-4 protein expression was not measured in soleus muscle, it was assessed in plantaris muscle from these animals. There was no difference in plantaris GLUT-4 protein levels between the two groups (data not shown).
Fig. 6.
Effect of chronic aliskiren treatment on basal and insulin-stimulated Akt Ser473 phosphorylation (left) and GSK-3β Ser9 phosphorylation (right). Values are expressed as means ± SE for 4 or 5 animals per group. *P < 0.05, aliskiren vs. vehicle.
DISCUSSION
The RAS is an important and well-characterized regulator of cardiovascular function and is gaining appreciation for its potential role as a modulator of systemic and tissue insulin sensitivity, likely via actions mediated by the vasoconstrictive peptide ANG II (5). In the present study, we have investigated the potential impact of aliskiren, the first renin inhibitor to be approved by the U.S. Food and Drug Administration for the treatment of hypertension (29), on relevant glucoregulatory parameters in the obese Zucker rat, a model of obesity-associated insulin resistance that is characterized by marked hyperinsulinemia, glucose intolerance, dyslipidemia, and central adiposity (13, 21). We have demonstrated for the first time that chronic renin inhibition with aliskiren leads to a reduction in SBP (Fig. 2) and to improvements in glucose tolerance and whole body insulin sensitivity (Fig. 4) in this model of obesity-associated insulin resistance. The chronic aliskiren treatment of the obese Zucker rats was also associated with an overall reduced body weight gain over the 21-day treatment period, and this could have impacted the metabolic improvements in the chronic aliskiren-treated animals. However, it is important to note that the average rate of body weight gain over the final 7 days of treatment, when all of the assessments of metabolic parameters were made, did not differ between the groups (4.8 ± 0.5 g/day in the controls and 4.7 ± 0.6 g/day in the aliskiren-treated group) (Fig. 1). Nevertheless, the potential influence of reduced nutrient intake by the aliskiren-treated group during the first half of the treatment period on the relevant metabolic parameters should be considered in future investigations.
This enhancement of whole body insulin sensitivity due to selective renin inhibition in the obese Zucker rat is similar to that observed by Habibi et al. (11) and Lastra et al. (18) in aliskiren-treated TG(mREN2)27 rats, a lean model of hypertension linked to renin overexpression (23). However, it should be noted that the improvement in insulin sensitivity in the aliskiren-treated TG(mREN2)27 rat was associated primarily with a reduced insulin response (smaller insulin AUC) during the glucose tolerance test (18), whereas in the aliskiren-treated obese Zucker rat, the enhanced insulin sensitivity was associated with improved glucose disposal (smaller glucose AUC) and not with an altered insulin response during the glucose tolerance test (Fig. 4). These findings indicate a different mode of action of renin inhibition in lean vs. obese models of glucose dysregulation and insulin resistance.
Importantly, we also made the novel observation that these aliskiren-induced improvements in glucose tolerance and whole body insulin sensitivity in the obese Zucker rat were associated with an increase in insulin action on skeletal muscle glucose transport activity (Fig. 5). Moreover, this upregulation of insulin action on glucose transport activity in skeletal muscle of the aliskiren-treated animals can likely be attributed to an increase in insulin-stimulated Akt Ser473 phosphorylation (Fig. 6). This effect of selective renin inhibition on insulin-dependent skeletal muscle glucose transport was similar to that reported in the TG(mREN2)27 rat (18). In addition, the renin inhibition in the TG(mREN2)27 rat caused a small, but significant, increase in insulin-stimulated Akt Thr308 phosphorylation (18).
An important observation in the present study was the ability of chronic renin inhibition in the obese Zucker rat to significantly reduce both fasting plasma glucose and the HOMA-IR (Fig. 3), indicating that one action of renin inhibition could be to lower basal hepatic glucose production. Moreover, the chronic treatment with aliskiren caused a reduction in fasting plasma FFA levels (Fig. 3). Elevated levels of plasma FFA are associated with insulin resistance and decreased glucose transport activity in skeletal muscle (7, 9, 32; and recently reviewed in Ref. 28). The possibility exists that this diminution of circulating FFAs following chronic renin inhibition may be mechanistically connected with both the improvements in glucose tolerance and whole body insulin sensitivity and the enhanced insulin-stimulated glucose transport in skeletal muscle.
Inhibitors that modulate downstream components of the RAS, such as ACE inhibitors and ARBs, represent a first-line pharmaceutical intervention for hypertensive patients with type 2 diabetes, as these antihypertensive compounds also mediate improvements in whole body and skeletal muscle insulin action (14, 17). Our laboratory has previously demonstrated that these RAS inhibitors, including the ACE inhibitors captopril and trandolapril and the ARB irbestartan (15, 16, 27), improve glucose tolerance, whole body insulin sensitivity, and insulin-dependent glucose transport activity in skeletal muscle of the obese Zucker rat. Moreover, our research group has recently shown in mammalian skeletal muscle that ANG II, a distal component of the RAS, can directly reduce insulin-stimulated glucose transport activity in skeletal muscle secondary to impairments of the phosphorylation of Akt and GSK-3β and due, at least in part, to a mechanism involving ROS (4), similar to what had been reported previously in the L6 muscle cell line (30). Collectively, these findings underscore the importance of the RAS in the regulation of vascular function, as well as in the modulation of insulin action on whole body glucoregulation and skeletal muscle glucose transport activity.
In conclusion, chronic treatment of the obese Zucker rat with the renin inhibitor aliskiren not only lowers blood pressure, but importantly also reduces whole body and skeletal muscle insulin resistance, and may involve enhanced Akt signaling. The present study provides further support for targeting the RAS as a point of intervention to improve both blood pressure regulation and insulin action in conditions of obesity-associated insulin resistance.
GRANTS
This study was supported by a grant-in-aid from Novartis Pharmaceuticals to E. J. Henriksen. E. M. Marchionne was supported by the University of Arizona Undergraduate Biology Research Program, which is funded by the Howard Hughes Medical Institute, and M. K. Diamond-Stanic was supported by Grant T32 HL07249 from the National Institutes of Health.
DISCLOSURES
Erik J. Henriksen has received financial support for the study from Novartis Pharmaceuticals.
REFERENCES
- 1. Centers for Disease Control, and Prevention National diabetes fact sheet: national estimates and general information on diabetes and prediabetes in the United States, 2011. Atlanta, GA: U.S. Department of Health and Human Services, Centers for Disease Control and Prevention, 2011 [Google Scholar]
- 2. Cortez MY, Torgan CE, Brozinick JT, Ivy JL. Insulin resistance of obese Zucker rats exercise trained at two different intensities. Am J Physiol Endocrinol Metab 261: E613–E619, 1991 [DOI] [PubMed] [Google Scholar]
- 3. DeFronzo RA, Ferrannini E. Insulin resistance: a multifaceted syndrome responsible for NIDDM, obesity, hypertension, dyslipidemia, and atherosclerotic cardiovascular disease. Diabetes Care 14: 173–194, 1991 [DOI] [PubMed] [Google Scholar]
- 4. Diamond-Stanic MK, Henriksen EJ. Direct inhibition by angiotensin II of insulin-dependent glucose transport activity in mammalian skeletal muscle involves a ROS-dependent mechanism. Arch Physiol Biochem 116: 88–95, 2010 [DOI] [PMC free article] [PubMed] [Google Scholar]
- 5. Dietze GJ, Henriksen EJ. Angiotensin I-converting enzyme in skeletal muscle: sentinel of blood pressure control and glucose homeostasis. J Renin Angiotensin Aldosterone Syst 9: 75–88, 2008 [DOI] [PubMed] [Google Scholar]
- 6. Dokken BB, Sloniger JA, Henriksen EJ. Acute selective glycogen synthase kinase-3 inhibition enhances insulin signaling in pre-diabetic insulin-resistant rat skeletal muscle. Am J Physiol Endocrinol Metab 288: E1188–E1194, 2005 [DOI] [PubMed] [Google Scholar]
- 7. Dresner A, Laurent D, Marcucci M, Griffin ME, Dufour S, Cline GW, Slezak LA, Andersen DK, Hundal RS, Rothman DL, Petersen KF, Shulman GI. Effects of free fatty acids on glucose transport and IRS-1-associated phosphatidylinositol 3-kinase activity. J Clin Invest 103: 253–259, 1999 [DOI] [PMC free article] [PubMed] [Google Scholar]
- 8. Flegal KM, Carroll MD, Ogden CL, Curtin LR. Prevalence and trends in obesity among U.S. adults, 1999–2008. JAMA 303: 235–241, 2010 [DOI] [PubMed] [Google Scholar]
- 9. Griffin ME, Marcucci MJ, Cline GW, Bell K, Barucci N, Lee D, Goodyear LJ, Kraegen EW, White MF, Shulman GI. Free fatty acid-induced insulin resistance is associated with activation of protein kinase C theta and alterations in the insulin signaling cascade. Diabetes 48: 1270–1274, 1999 [DOI] [PubMed] [Google Scholar]
- 10. Gulve EA, Henriksen EJ, Rodnick KJ, Youn JH, Holloszy JO. Glucose transporters and glucose transport in skeletal muscles of 1 to 25 month old rats. Am J Physiol Endocrinol Metab 264: E319–E327, 1993 [DOI] [PubMed] [Google Scholar]
- 11. Habibi J, Whaley-Connell A, Hayden MR, DeMarco VG, Schneider R, Sowers SD, Karuparthi P, Ferrario CM, Sowers JR. Renin inhibition attenuates insulin resistance, oxidative stress, and pancreatic remodeling in the transgenic Ren2 rat. Endocrinology 149: 5643–5653, 2008 [DOI] [PMC free article] [PubMed] [Google Scholar]
- 12. Hansen PA, Gulve EA, Holloszy JO. Suitability of 2-deoxyglucose for in vitro measurement of glucose transport activity in skeletal muscle. J Appl Physiol 76: 979–985, 1994 [DOI] [PubMed] [Google Scholar]
- 13. Henriksen EJ. Effects of acute exercise and exercise training on insulin resistance. J Appl Physiol 93: 788–796, 2002 [DOI] [PubMed] [Google Scholar]
- 14. Henriksen EJ. Improvement of insulin sensitivity by antagonism of the renin-angiotensin system. Am J Physiol Regul Integr Comp Physiol 293: R974–R980, 2007 [DOI] [PubMed] [Google Scholar]
- 15. Henriksen EJ, Jacob S. Effects of captopril on glucose transport activity in skeletal muscle of obese Zucker rats. Metabolism 44: 267–272, 1995 [DOI] [PubMed] [Google Scholar]
- 16. Henriksen EJ, Jacob S, Kinnick TR, Teachey MK, Krekler M. Selective angiotensin II receptor receptor antagonism reduces insulin resistance in obese Zucker rats. Hypertension 38: 884–890, 2001 [DOI] [PubMed] [Google Scholar]
- 17. Ismail H, Mitchell R, Samy MI. Pleiotropic effects of inhibitors of the RAAS in the diabeteic population: Above and beyond blood pressure lowering. Curr Diab Rep 10: 32–36, 2010 [DOI] [PubMed] [Google Scholar]
- 18. Lastra G, Habibi J, Whaley-Connell AT, Manrique C, Hayden MR, Rehmer J, Patel K, Ferrario C, Sowers JR. Direct renin inhibition improves systemic insulin resistance and skeletal muscle glucose transport in a transgenic rodent model of tissue renin overexpression. Endocrinology 150: 2561–2568, 2009 [DOI] [PMC free article] [PubMed] [Google Scholar]
- 19. Lavoie JL, Sigmund CD. Minireview: overview of the renin-angiotensin system—an endocrine and paracrine system. Endocrinology 144: 2179–2183, 2003 [DOI] [PubMed] [Google Scholar]
- 20. Manrique C, Lastra G, Gardner M, Sowers JR. The renin angiotensin aldosterone system in hypertension: roles of insulin resistance and oxidative stress. Med Clin North Am 93: 569–582, 2009 [DOI] [PMC free article] [PubMed] [Google Scholar]
- 21. Mathé D. Dyslipidemia and diabetes: animal models. Diabete Metab 21: 106–111, 1995 [PubMed] [Google Scholar]
- 22. Matthews DR, Hosker JP, Rudenski AS, Naylor BA, Treacher DF, Turner RC. Homeostasis model assessment: insulin resistance and beta-cell function from fasting plasma glucose and insulin concentrations in man. Diabetologia 28: 412–419, 1985 [DOI] [PubMed] [Google Scholar]
- 23. Mullins JJ, Peters J, Ganten D. Fulminant hypertension in transgenic rats harboring the Ren-2 gene. Nature 344: 541–544, 1990 [DOI] [PubMed] [Google Scholar]
- 24. Ogihara T, Asano T, Katsuyuki A, Chiba Y, Sakoda H, Anai M, Shojima N, Ono J, Onishi Y, Fujishiro M, Katagiri H, Fukushima Y, Kikuchi M, Noguchi N, Aburatani H, Komuro I, Fujita T. Angiotensin II-induced insulin resistance is associated with enhanced insulin signaling. Hypertension 40: 872–879, 2002 [DOI] [PubMed] [Google Scholar]
- 25. Reddy KJ, Singh M, Bangit JR, Batsell RR. The role of insulin resistance in the pathogenesis of atherosclerotic cardiovascular disease: an updated review. J Cardiovasc Med 11: 633–647, 2010 [DOI] [PubMed] [Google Scholar]
- 26. Shepherd PR, Kahn BB. Glucose transporters and insulin action—implications for insulin resistance and diabetes mellitus. N Engl J Med 341: 248–257, 1999 [DOI] [PubMed] [Google Scholar]
- 27. Steen MS, Foianini KR, Youngblood EB, Kinnick TR, Jacob S, Henriksen EJ. Interactions of exercise training and ACE inhibition on insulin action in obese Zucker rats. J Appl Physiol 86: 2044–2051, 1999 [DOI] [PubMed] [Google Scholar]
- 28. Taube A, Eckardt K, Eckel J. Role of lipid-derived mediators in skeletal muscle in insulin resistance. Am J Physiol Endocrinol Metab 297: E1004–E1012, 2009 [DOI] [PubMed] [Google Scholar]
- 29. Van den Meiracker AH, Jan Danser AH. Aliskiren: the first direct renin inhibitor for hypertension. Curr Cardiol Rep 9: 470–476, 2007 [DOI] [PubMed] [Google Scholar]
- 30. Wei Y, Sowers JR, Nistala R, Gong H, Uptergrove GM, Clark SE, Morris EM, Szary N, Manrique C, Stump CS. Angiotensin II-induced NADPH oxidase activation impairs insulin signaling in skeletal muscle cells. J Biol Chem 281: 35137–35146, 2006 [DOI] [PubMed] [Google Scholar]
- 31. Wood JM, Schnell CR, Cumin F, Menard J, Webb RL. Aliskiren, a novel, orally effective renin inhibitor, lowers blood pressure in marmosets and spontaneously hypertensive rats. J Hypertens 23: 417–426, 2005 [DOI] [PubMed] [Google Scholar]
- 32. Yu C, Chen Y, Cline GW, Zhang D, Zong H, Wang Y, Bergeron R, Kim JK, Cushman SW, Cooney GJ, Atcheson B, White MF, Kraegen EW, Shulman GI. Mechanism by which fatty acids inhibit insulin activation of insulin receptor substrate-1 (IRS-1)-associated phosphatidylinositol 3-kinase activity in muscle. J Biol Chem 277: 50230–50236, 2002 [DOI] [PubMed] [Google Scholar]


