

Abstract
Objective
Pain is a subjectively complex and universal experience. We examine research investigating ethnic group differences in experimental pain response, and factors contributing to group differences.
Method
We conducted a systematic literature review and analysis of studies using experimental pain stimuli to assess pain sensitivity across multiple ethnic groups. Our search covered the period from 1944-2011, and utilized the PUBMED bibliographic database; a reference source containing over 17 million citations. We calculated effect sizes, identified ethnic/racial group categories, pain stimuli and measures, and examined findings regarding biopsychosociocultural factors contributing to ethnic/racial group differences.
Results
We found 472 studies investigating ethnic group differences and pain. Twenty-six of these met our review inclusion criteria of investigating ethnic group differences in experimental pain. The majority of studies included comparisons between African Americans (AA) and non-Hispanic Whites (NHW). There were consistently moderate to large effect sizes for pain tolerance across multiple stimulus modalities; African Americans demonstrated lower pain tolerance. For pain threshold, findings were generally in the same direction, but effect sizes were small to moderate across ethnic groups. Limited data were available for suprathreshold pain ratings. A subset of studies comparing NHW and other ethnic groups showed a variable range of effect sizes for pain threshold and tolerance.
Conclusion
There are potentially important ethnic/racial group differences in experimental pain perception. Elucidating ethnic group differences, has translational merit for culturally-competent clinical care and for addressing and reducing pain treatment disparities among ethnically/racially diverse groups.
Keywords: ethnicity/race differences, experimental pain, pain disparities, pain threshold/tolerance, pain treatment
Introduction
The experience of pain is characterized by immense inter-individual and group variability (1, 2) with one likely contributing factor being ethnicity; a subjective construct infused with definitional debate. Synergistically, pain and ethnicity are multidimensional, malleable and shaped by culture (3). Although there is no consensus regarding the underlying mechanisms, ethnic group differences inevitably reflect a holistic influence of biological, social, cultural, and psychological factors; the biopsychosocio-cultural model of pain. To elucidate these mystifying, yet integrated mechanisms, researchers have undertaken both clinical and experimental pain studies to document the pain experience. For example, evidence exists for ethnic group differences in clinical pain, with African Americans demonstrating greater severity of clinical pain and higher levels of pain-related disability (4,5). Similarly, ethnic group differences have also been reported in experimental pain studies (6-7), with a majority of these studies (8-11) examining variability among African Americans and non-Hispanic Whites (Figures 1-4). A handful of other studies (Table 2) have included comparisons of different ethnic groups). Take for example, studies that have included Hispanics, African Americans and non-Hispanic Whites (6, 7). Other studies (12) have included a broader range of study participants such as African Americans, Caucasians, Indian, Asians and Hispanics. Still other investigations have examined group differences among Danish Whites and South Indians (13); across Chinese, Malay and Indians (14); and among Alaskan Indian, Eskimo and non-Hispanic Whites (15), and Nepalese porters and Occidentals (16). Many of these experimental pain studies, reporting ethnic group differences, have used laboratory pain modalities such as thermal, cold pressor, ischemic, mechanical, and electrical stimuli (Figure 2), and have included measures such as pain threshold, tolerance, and ratings of the intensity and unpleasantness suprathreshold stimuli.
Figure 1.

Effect Sizes for Ethnic Group Differences in Heat Pain Responses for studies Comparing African American (AA) to non-Hispanic White (NHW) Subjects. Bars reflect Cohen’s d. Bars greater in length to the left indicate greater values for NHW compared to AA, while bars increasing in length to the right indicate greater values of that measure for AA vs. NHW. Greater values for pain threshold and pain tolerance reflect lower pain sensitivity, while greater values for pain ratings indicate higher pain sensitivity. * The Edwards and Fillingim effect sizes are difficult to interpret as these values reflect differences in the slope of the stimulus response function, rather than differences in heat pain ratings. (Unpl)=unpleasantness ratings; (Int)=intensity ratings.
Figure 4.

Effect Sizes for Ethnic Group Differences in Electrical and Mechanical Pain Responses for studies Comparing African American (AA) to non-Hispanic White (NHW) Subjects. Bars reflect Cohen’s d. Bars greater in length to the left indicate greater values for NHW compared to AA, while bars increasing in length to the right indicate greater values of that measure for AA vs. NHW. Greater values for pain threshold and pain tolerance reflect lower pain sensitivity, while greater values for pain ratings indicate higher pain sensitivity. (PPT-T)=Pressure Pain Threshold-Trapezius; (PPT-M)=Pressure Pain Threshold-Masseter.
Table 2.
| a. Ethnic Differences in Thermal Pain Sensitivity | non-Hispanic White vs Other Ethnic Groups | |||||
|---|---|---|---|---|---|---|
| Author/Year | Sample Size | Age Range (Mean) | “Whites” Mean (SD) | Other Group Mean (SD) | Effect Size≠ | |
| Threshold | ||||||
| Meehan et al., 1954 | NHW 32 (4F, 28M) | Indian 26 (3F, 23M) | Indian 12-78b | 274 (44) | 273 (40) | -0.02 |
| Meehan et al., 1954 | NHW 32 (4F, 28M) | Eskimo 37(15F, 22M) | Eskimo 10-70b | 274 (44) | 319 (45) | 1.01 |
| Rahim-Williams et al., 2007 | NHW 82 (32F, 50M) | Hispanic 61 (34F, 24M) | 18-53 | 41.7 (3.2) | 41.4 (3.5) | -0.09 |
| Watson et al., 2005 | White British 20M | South Asian 20M | 28-40 | 45.2 (3.5) | 41.7 (4.02) | -0.92 |
| Mean effect for thermal threshold - Unweighted | -0.01 | |||||
| Mean effect for thermal threshold - Weighted | 0.06 | |||||
| Tolerance | ||||||
| Rahim-Williams et al., 2007 | NHW 82 (32F, 50M) | Hispanic 61(34F, 24M) | 18-53 | 47.6 (2.5) | 46.1 (3.0) | -0.59 |
| Mean effect for thermal tolerance | -0.59 | |||||
| b. Ethnic Differences in Cold Pain Sensitivity | non-Hispanic White vs Other Ethnic Groups | |||||
| Author/Year | Sample Size | Age Range (Mean) | “Whites” Mean (SD) | Other Group Mean (SD) | Effect Size≠ | |
| Threshold | ||||||
| Hsieh et al, 2010 | European Canadian 80 (41F, 39M) | Chinese 80 (42F, 38M) | 17-27 | 11.3 (13.0) | 12.5 (11.3) | 0.10 |
| Rahim-Williams et al., 2007 | NHW 82 (32F, 50M) | Hispanic 61(34F, 24M) | 18-53 | 19.8 (15.1) | 20.5 (36.5) | 0.02 |
| Watson et al., 2005* | White British 20M | South Asian 20M | 28-40 | 11.9 (5.4) | 15.8 (7.1) | -0.62 |
| Mean effect for cold threshold - Unweighted | -0.17 | |||||
| Mean effect for cold threshold - Weighted | -0.02 | |||||
| Tolerance | ||||||
| Hsieh et al, 2010 | European Canadian 80 (41F, 39M) | Chinese 80 (42F, 38M) | 17-27 | 111.5 (62.7) | 71.4 (61.5) | -0.64 |
| Rahim-Williams et al., 2007 | NHW 82 (32F, 50M) | Hispanic 61(34F, 24M) | 18-53 | 133.1 (120.3) | 73.3 (97.1) | -0.54 |
| Nayak et al., 2000 | United States 107(54F, 53M) | Indian 119 (59F,60M) | 18-24 | 60.9 (57.4) | 81.9 (68.0) | 0.33 |
| Mean effect for cold tolerance - Unweighted | -0.28 | |||||
| Mean effect for cold tolerance - Weighted | -0.20 | |||||
| c. Ethnic Differences in Ischemic Pain Sensitivity | non-Hispanic White vs Other Ethnic Groups | |||||
| Author/Year | Sample Size | Age Range (Mean) | “Whites” Mean (SD) | Other Group Mean (SD) | Effect Size≠ | |
| Threshold | ||||||
| Rahim-Williams et al., 2007 | NHW 82 (32F, 50M) | Hispanic 61(34F, 24M) | 18-53 | 185.3 (162.9) | 175.5 (158.5) | -0.06 |
| Mean effect for ischemic threshold | -0.06 | |||||
| Tolerance | ||||||
| Rahim-Williams et al., 2007 | NHW 82 (32F, 50M) | Hispanic 61(34F, 24M) | 18-53 | 550.0 (268.3) | 463.4 (277.1) | -0.31 |
| Mean effect for ischemic tolerance | -0.31 | |||||
| d. Ethnic Differences in Mechanical Pain Sensitivity | non-Hispanic White vs Other Ethnic Groups | |||||
| Author/Year | Sample Size | Age Range (Mean) | “Whites” Mean (SD) | Other Group Mean (SD) | Effect Size≠ | |
| Pressure Pain Threshold | ||||||
| Rahim-Williams et al., 2007Masseter | NHW 82 (32F, 50M) | Hispanic 61(34F, 24M) | 18-53 | 3.2 (1.4) | 3.2 (1.5) | 0.00 |
| Rahim-Williams et al., 2007Trapezius | NHW 82 (32F,50M) | Hispanic 61(34F, 24M) | 18-53 | 6.7 (2.5) | 6.0 (2.2) | -0.29 |
| Komiyama et al., 2007Masseter | Belgian 44 (22F, 22M) | Japanese 44(22F, 22M) | 20-31 | 169.1 (51.0) | 164.3 (45.0) | -0.10 |
| Komiyama et al., 2007Thenar | Belgian 44 (22F, 22M) | Japanese 44(22F, 22M) | 20-31 | 324.3 (106.8) | 308.3 (76.5) | -0.17 |
| Komiyama et al., 2009Masseter | Belgian Caucasian 28 (14F, 14M) | Japanese 28 (14F, 14M) | 20-35 | 169.0 (60.2) | 169.7 (46.3) | 0.01 |
| Komiyama et al., 2009Thenar | Belgian Caucasian 28 (14F, 14M) | Japanese 28 (14F, 14M) | 20-35 | 347.4 (77.9) | 335.4 (71.8) | -0.16 |
| Merskey & Spear, 1964 | White (28M) | Afro-Asian (11M) | 18-30 | 3.75 (0.82) | 3.84 (1.01) | 0.10 |
| Gazerani & Arendt-Nielsen, 2005Right Frontalis muscle | Danish Caucasian 16M | South Indians 16M | 19-42 | 222.9 (30.3) | 205.2 (23.0) | -0.66 |
| Gazerani & Arendt-Nielsen, 2005Left Frontalis muscle | Danish Caucasian 16M | South Indians 16M | 19-42 | 225.3 (35.7) | 219.3 (45.0) | -0.15 |
| Mean effect for pressure pain threshold - Unweighted | -0.16 | |||||
| Mean effect for pressure pain threshold - Weighted | -0.13 | |||||
| Filament Pin-Prick Threshold | ||||||
| Komiyama et al., 2007Thenar | Belgium 44(22F, 22M) | Japanese 44(22F, 22M) | 20-31 | 5.66 (0.4) | 5.3 (0.5) | -0.82 |
| Komiyama et al., 2007Tongue tip | Belgium 44(22F, 22M) | Japanese 44(22F, 22M) | 20-31 | 5.04 (0.25) | 4.77 (0.35) | -0.92 |
| Komiyama et al., 2007Maxillary gingiva | Belgium 44(22F, 22M) | Japanese 44(22F, 22M) | 20-31 | 5.34 (0.26) | 5.28 (0.25) | -0.23 |
| Komiyama et al., 2007Cheek skin | Belgium 44(22F, 22M) | Japanese 44(22F, 22M) | 20-31 | 5.54 (0.38) | 5.12 (0.37) | -1.18 |
| Mean effect for mechanical pin prick threshold | -0.79 | |||||
| Pressure Pain Tolerance | ||||||
| Merskey & Spear, 1964 | White 28M | Afro-Asian 11M | 18-30 | 6.0 (1.2) | 5.8 (1.3) | -0.14 |
| Woodrow et al., 1972 | NHW 34,077 (19,471F, 14,606M) | Oriental 1649 (900F,749M) | 20-70 | 22.6 (8.1) | 19.4 (7.1) | -0.37 |
| Komiyama et al., 2007masseter | Belgium 44 (22F, 22M) | Japanese 44 (22F, 22M) | 20-31 | 367.6 (82.7) | 333.4 (72.1) | -0.44 |
| Mean effect for mechanical tolerance - Unweighted | -0.32 | |||||
| Mean effect for mechanical tolerance - Weighted | -0.37 | |||||
| e. Ethnic Differences in Electrical Pain Sensitivity | non-Hispanic White vs Other Ethnic Groups | |||||
| Author/Year | Sample Size | Age Range (Mean) | “Whites” Mean (SD) | Other Group Mean (SD) | Effect Size≠ | |
| Threshold | ||||||
| Chapman et al., 1982 | American 20 (10F, 10M) | Japanese 20 (10F, 10M) | 18-36 | 12.0 (6.5) | 9.0 (4.8) | -0.53 |
| Clark & Clark, 1980a | Occidental 5 | Nepalese 6 | Occidental, 30-68 Nepalese, 23-42 | 35 (11.9) | 64.5 (12.5) | 2.42 |
| Komiyama et al., 2009 | Belgian Caucasian 28 (14F, 14M) | Japanese 28 (14F, 14M) | 20-35 | 17.1 (4.1) | 14.8 (3.7) | -0.59 |
| Mean effect for electrical threshold - Unweighted | 0.43 | |||||
| Mean effect for electrical threshold - Weighted | 0.20 | |||||
| Tolerance | ||||||
| Clark & Clark, 1980 | Occidental 5 | Nepalese 6 | Occidental, 30-68 Nepalese, 23-42 | 58.8 (12.1) | 82.8 (12.7) | 1.93 |
| Mean effect for electrical tolerance | 1.93 | |||||
Data for gender/sex by ethnicity/race unavailable.
Age data not provided for the NHW group.
Effect size calculated such that a negative number reflects a higher threshold or tolerance for the White group.
The effect size value was reversed for this study, because the cold threshold was measured in °C, such that a lower threshold reflects lower sensitivity
Figure 2.

Effect Sizes for Ethnic Group Differences in Cold Pain Responses for studies Comparing African American (AA) to non-Hispanic White (NHW) Subjects. Bars reflect Cohen’s d. Bars greater in length to the left indicate greater values for NHW compared to AA, while bars increasing in length to the right indicate greater values of that measure for AA vs. NHW. Greater values for pain threshold and pain tolerance reflect lower pain sensitivity, while greater values for pain ratings indicate higher pain sensitivity.
Although, experimental pain does not fully duplicate the sensory and affective qualities that characterize clinical pain, ethnic differences in experimental pain sensitivity may contribute to ethnic differences in the experience of clinical pain (1-5). Therefore, evaluating ethnic differences in experimental pain models may not only provide information about underlying mechanisms, but may also predict or explain group differences in clinical pain (5, 13). If such findings continue to be scientifically supported, laboratory results applied to ethnic differences in the experience of clinical pain may have translational merit. The aim of this structured review and analysis was to examine published, peer-reviewed studies that investigated ethnic group differences in experimental pain responses and mechanisms reported to contribute to these differences.
Methods
Database search
The systematic review of literature on experimental pain and ethnicity/race was conducted using the PUBMED bibliographic database; a reference source containing over 17 million citations with access to full text for biomedical articles. Our broad-based, keyword search strategy included terms such as experimental pain; ethnic group differences and pain sensitivity/perception; culture and experimental pain; ethnicity and experimental pain; culture, ethnicity and pain, ethnic group differences and experimental pain, and covered the period from 1944-2011. The last search of the PubMed database was performed in October 2011, and identified 472 studies investigating ethnic group differences and pain. We narrowed and focused our review on twenty-five (25) studies specifically investigating ethnic/racial group differences and experimental pain. Experimental, or laboratory pain testing, uses several methodologies (See Table 3) to artificially introduce pain as a means of examining, identifying and understanding pain variations.
Table 3.
| a. List of Review Studies: Experimental Pain | ||||
|---|---|---|---|---|
| PRIMARY GROUP COMPARISONS | ||||
| Researchers | Ethnic/Racial Groups Studied | Pain Testing Procedures | Pain Induction Method | Test Area |
| Forsythe et al., 2011 | AA, nHW | Cold (TOL) | Container with ice & water, 0-2°C (~36°F) | Non-dominant forearm |
| Wang et al., 2010 | AA, nHW | Thermal (THR) | Contact thermode, 12cm2 Capsaicin | Left/right volar forearm |
| Grewen et al., 2008 | AA, nHW | Thermal (THR, TOL, Int, Unpl) | Contact thermode, 1cm diameter | Volar forearm |
| Cold (THR, TOL) | Container with ice & water, 4°C (~39°F) | Hand up to wrist | ||
| Ischemic (THR, TOL) | Tourniquet cuff | Forearm | ||
| Rahim-Williams et al., 2007 | AA, nHW | Thermal (THR, TOL) | Contact thermode, 1cm diameter | Ventral forearm |
| Cold (TH, TOL) | Refrigeration unit, 5°C | Left hand up to wrist | ||
| Ischemic (THR, TOL) | Tourniquet cuff | Left forearm | ||
| Campbell et al., 2007 | AA, nHW | Electrical (electromyographic) | Electrode | Biceps femoris muscle of left leg; lateral epicondyle of femur |
| Campbell et al., 2005 | AA, nHW | Thermal (THR, TOL, Int, Unpl) | Contact thermode | Left ventral forearm |
| Cold (THR, TOL, Int, Unpl) | Refrigeration unit, 5°C | Left hand up to wrist | ||
| Ischemic (THR, TOL, Int, Unpl) | Tourniquet cuff | Left arm | ||
| Researchers | Ethnic/Racial Groups Studied | Pain Testing Procedures Threshold (TH)/Tolerance (TOL) | Pain Induction Method | Administration Site |
| Mechlin et al., 2005 | AA, nHW | Thermal (THR, TOL) | Contact thermode, 1cm diameter | Left volar forearm |
| Cold (THR, TOL) | Container with ice & water, 4°C | Hand up to wrist | ||
| Ischemic (THR, TOL) | Tourniquet cuff | Arm | ||
| Weisse et al., 2005 | AA, nHW | Cold (TOL, Intensity & Unpl) | Styrofoam bucket with ice water; 0-2°C | Arm up to the elbow |
| Kim et al., 2004 | AA, nHW | Heat (THR, TOL, Intensity) | Thermode probe, 1cm diameter | Volar forearm |
| Cold (THR, TOL, Intensity) | Insulated bucket filled with iced water; 2°C to 4°C | Hand up to the wrist | ||
| Campbell et al., 2004 | AA, nHW | Ischemic (Intensity & Unpl) | Blood pressure cuff | Dominant upper arm |
| Edwards et al., 2001 | AA, nHW | Ischemic (TOL) | Blood pressure cuff/Tourniquet | Dominant arm |
| Sheffield et al., 2000 | AA, nHW | Thermal (Intensity & unpleasantness) | 9.3-mm square probe | Right volar forearm |
| Edwards & Fillingim, 1999 | AA, nHW | Thermal (THR, TOL, Intensity, Unpl) | 9-cm2 contact probe | Left volar forearm |
| Woodrow et al., 1972 | AA, nHW | Mechanical (TOL) | Two motor-driven rods with ¼” & ⅛” tip. | Ankle tendon |
| Chapman & Jones, 1944 | AA, nHW | Thermal (THR, TOL) | 1000 watt tungsten filament lamp (intensities of light) | Forehead |
| b. List of Review Studies: Experimental Pain | ||||
| SECONDARY GROUP COMPARISONS | ||||
| Researchers | Ethnic/Racial Groups Studied | Pain Testing Procedures Threshold (THR)/Tolerance (TOL) | Pain Induction Method | Administration Site |
| Hsieh et al., 2010 | Chinese, European Canadian | Cold (THR/TOL, Intensity) | Cold pressure machine: double-bucket with built-in refrigeration unit; 2 to 3°C | Non-dominant arm up to elbow |
| Komiyama et al., 2009 | Japanese, Belgian Caucasian | Mechanical (THR) | Pressure algometer, 1 cm probe diameter | Masseter muscles |
| Electrical (THR, Intensity) | Filament-prick; Surface stimulation electrodes | Left cheek skin overlying masseter muscles; tip of tongue | ||
| Komiyama et al., 2007 | Japanese, Belgian White | Mechanical (THR, TOL) | Pressure algometer, 1 cm probe diameter | Masseter muscles |
| Gazerani & Arendt-Nielsen, 2005 | Danish Whites, South Indians | Mechanical (THR, Intensity) | Hand-held electrical algometer; 1-cm diameter | Frontalis muscles bilaterally |
| Watson et al., 2005 | White British, South Asian | Heat (THR, Intensity, Unpl) | Contact thermode | Volar surface of forearm |
| Cold (THR, Intensity, Unpl) | Contact thermode | |||
| Nayak et al., 2000 | U.S., India | Cold (TOL, Intensity) | Bucket of ice water at room temperature | Non-dominant hand up to wrist |
| Chapman et al., 1982 | American, Japanese | Electrical (THR, Intensity) | Conductive rubber disc electrode (cathode); 3.5 mm | Unfilled central incisor |
| Clark & Clark, 1980 | Occidentals, Napalese | Electrical (THR) | Carbon Electrodes | Left wrist over median nerve, and left forearm |
| Merskey & Spear, 1964 | Afro-Asian, White | Mechanical (THR, TOL) | Algometer; 0.5 cm diameter | Forehead and Tibia shin |
| Meehan et al., 1954 | Indian, non-Hispanic White | Thermal (THR) | Radiometer/dolorimeter | Back of hand |
THR: Threshold, TOL: Tolerance, Inst: Intensity, Unpl: Unplesantness, AA: African American, nHW: non-Hispanic White, U.S.: United States
Inclusion and exclusion criteria
We included studies for this structured review and analysis if they focused specifically on comparing racial/ethnic groups, and if experimental pain stimuli (e.g. thermal, cold, ischemic, mechanical, electrical) were used. While gender represents another important demographic variable related to pain, given the availability of numerous recent reviews on this topic, (17-19), we elected to focus exclusively on ethnic group differences in the present analysis. Of the 472 studies we identified, twenty-five (25) articles met our specific inclusion criteria. Studies investigating only gender and pain, clinical pain studies, and/or studies without a mention of ethnic group comparisons were not included. Fifteen of the twenty-five articles had a primary objective of comparing experimental pain responses among African Americans and non-Hispanic Whites. The remaining 10 studies evaluated experimental pain responses for various racial/ ethnic groups; African Americans and Hispanics; Hispanics and non-Hispanic Whites; Alaskan Indian; Eskimos and Whites; Danish Whites and South Indians; White British individuals and South Asians; Japanese and Belgium participants; Afro-Asians and White, Nepalese and Occidentals; Japanese and Americans and European Canadian and Chinese.
Our review identified two additional studies (14,20) investigating intra-ethnic group differences and experimental pain that we did not include. First, the study by Yosipovitch (14), investigated thermal pain among Asian participants (Chinese, Malay and Indians). The study did not provide the standard deviation data required for calculating effect sizes included in Tables 1 and 2; articles comparing African Americans and non-Hispanic Whites and non-Hispanic Whites and other ethnic groups. The second intra-ethnic group study, by Awad and colleagues (20), investigated irritable bowel syndrome using electronic barostat and included only Hispanics.
Table 1.
| a. Ethnic Differences in Thermal Pain Sensitivity: Studies comparing African Americans with Whites | ||||||
|---|---|---|---|---|---|---|
| Author/Year | Sample size | Age Range (Mean) | Mean (SD) | Effect Size≠ | ||
| Threshold | AA | NHW | AA | NHW | ||
| Grewen et al., 2008 | 25 (25F) | 23 (23F) | (27) | 43.2 (3.3) | 42.7 (2.6) | 0.16 |
| Rahim-Williams et al., 2007 | 63 (42F, 21M) | 82 (32F, 50M) | 18-53 | 42.1 (3.2) | 41.7 (3.2) | 0.12 |
| Campbell et al., 2005 | 62 (41F, 21M) | 58 (24F, 34M) | (20) | 42.3 (4.2) | 43.1 (4.8) | -0.18 |
| Chapman & Jones, 1944 | 18a | 18a | 18-44 | 0.27 (0.02) | 0.32 (0.04) | -1.75 |
| Edwards & Fillingim, 1999b | 18 (10F, 8M) | 30 (16F, 14M) | 18-47 | 44.8 (5.1) | 46.2 (1.6) | -0.48 |
| Mechlin et al., 2005b | 50 (26F, 24M) | 44 (23F, 21M) | (26) | 43.1 (3.3) | 43.6 (2.8) | -0.17 |
| Wang et al., 2010 | 10 (5F, 5M) | 10 (5F, 5M) | 19-47 | 45.0 (3.5) | 45.8 (1.9) | -0.30 |
| Mean effect for thermal threshold - Unweighted | -0.37 | |||||
| Mean effect for thermal threshold - Weighted | -0.24 | |||||
| Tolerance | AA | NHW | AA | NHW | ||
| Rahim-Williams et al., 2007 | 63 (42F, 21M) | 82 (32F, 50M) | 18-53 | 46.2 (2.5) | 47.6 (2.5) | -0.56 |
| Campbell et al., 2005 | 62 (41F, 21M) | 58 (24F, 34M) | (20) | 46.6 (3.3) | 48.1 (3.7) | -0.43 |
| Chapman & Jones, 1944 | 18a | 18a | 18-44 | 0.30 (0.03) | 0.38 (0.05) | -2.13 |
| Edwards & Fillingim, 1999b | 18 (10F, 8M) | 30 (16F, 14M) | 18-47 | 47.1 (5.5) | 49.6 (2.2) | -1.14 |
| Grewen et al., 2008 | 25 (25F) | 23 (23F) | (27) | 47.1 (2.5) | 48.2 (1.8) | -0.50 |
| Mechlin et al., 2005b | 50 (26F, 24M) | 44 (23F, 21M) | (26) | 47.6 (3.0) | 49.1 (2.2) | -0.61 |
| Mean effect for thermal tolerance - Unweighted | -0.83 | |||||
| Mean effect for thermal tolerance - Weighted | -0.72 | |||||
| b. Ethnic Differences in Thermal Pain Ratings: Studies comparing African Americans with Whites | ||||||
| Author/Year | Sample size | Age Range (Mean) | Mean (SD) | Effect Size≠ | ||
| Intensity Ratings | AA | NHW | AA | NHW | ||
| Kim et al., 2004 (43°C-49°C) | 130 a | 344 a | 16-66 | 35.1 (22.7) | 36.0 (21.0) | -0.03 |
| Sheffield et al., 2000 (45°C-49°C) | 24 (12F, 12M) | 27 (13F, 14M) | 20-73 | 92.4 (13.4) | 72.6 (13.5) | 1.45 |
| Campbell et al., 2005 (49°C) | 61 (40F, 21M) | 58 (24F, 34M) | (20) | 13.3 (5.0) | 10.7 (4.8) | 0.53 |
| Campbell et al., 2005 (52°C) | 60 (40F, 20M) | 58 (24F, 34M) | (20) | 16.7 (4.8) | 13.3 (4.6) | 0.72 |
| Edwards & Fillingim (1999)b | 18 (10F, 8M) | 30 (16F, 14 M) | 18-47 | 29.9 (17.6) | 26.3 (18.3) | 0.20 |
| Mean effect for thermal intensity - Unweighted | 0.57 | |||||
| Mean effect for thermal intensity - Weighted | 0.28 | |||||
| Unpleasantness Ratings | AA | NHW | AA | NHW | ||
| Edwards & Fillingim (1999)b | 18 (10F, 8M) | 30 (16F, 14M) | 18-47 | 32.1 (19.6) | 24.1 (17.7) | 0.44 |
| Campbell et al., 2005 (49°C) | 61 (40F, 21M) | 58 (24F, 34M) | (20) | 13.3 (5.0) | 10.7 (4.8) | 0.58 |
| Campbell et al., 2005 (52°C) | 60 (40F, 20M) | 58 (24F, 34M) | (20) | 15.5 (5.3) | 12.2 (5.1) | 0.64 |
| Mean effect for thermal intensity - Unweighted | 0.55 | |||||
| Mean effect for thermal intensity - Weighted | 0.58 | |||||
| c. Ethnic Differences in Cold Pain Sensitivity: Studies comparing African Americans with Whites | ||||||
| Author/Year | Sample size | Age Range (Mean) | Mean (SD) | Effect Size≠ | ||
| Threshold | AA | NHW | AA | NHW | ||
| Grewen et al., 2008 | 25 (25F) | 23 (23F) | (27) | 6.4 (2.8) | 9.1 (7.9) | -0.52 |
| Rahim-Williams et al., 2007 | 63 (42F, 21M) | 82 (32F, 50M) | 18-53 | 14.0 (11.0) | 20.0 (15.1) | -0.46 |
| Campbell et al., 2005 | 62 (41F, 21M) | 58 (24F, 34M) | (20) | 9.8 (6.3) | 11.9 (6.4) | -0.33 |
| Mechlin et al., 2005b | 51 (27F, 24M) | 44 (23F, 21M) | (26) | 10.0 (8.0) | 15.0 (19.0) | -0.38 |
| Mean effect for cold threshold - Unweighted | -0.42 | |||||
| Mean effect for cold threshold - Weighted | -0.41 | |||||
| Tolerance | AA | NHW | AA | NHW | ||
| Forsythe et al., 2011 | 60 a | 95 a | (19.5) | 64.8 (78.8) | 115.9 (105.8) | -0.53 |
| Rahim-Williams et al., 2007 | 63 (42F, 21M) | 82 (32F, 50M) | 18-53 | 43.0 (54.0) | 133.1 (120.3) | -0.98 |
| Campbell et al., 2005 | 62 (41F, 21M) | 58 (24F, 34M) | (20) | 21.0 (15.0) | 68.1 (53.0) | -0.92 |
| Mechlin et al., 2005b | 51 (27F, 24M) | 44 (23F, 21M) | (26) | 25.0 (42.0) | 79.0 (107.0) | -0.74 |
| Grewen et al., 2008 | 25 (25F) | 23 (23F) | (27) | 13.8 (7.0) | 45.8 (71.1) | -0.84 |
| Kim et al 2004 | 130 a | 344a | 16-66 | 39.7 (42.6) | 86.5 (63.5) | -0.81 |
| Mean effect for cold tolerance - Unweighted | -0.80 | |||||
| Mean effect for cold tolerance - Weighted | -0.79 | |||||
| Cold Pain Intensity Ratings | AA | NHW | AA | NHW | ||
| Kim, et al., 2004 | 130 a | 344 a | 16-66 | 75.4 (23.3) | 64.4 (24.1) | 0.46 |
| Weisse, et al., 2005 | 97 a | 193 a | 17-43 | 17.0 (3.96) | 15.5 (3.9) | 0.39 |
| Mean effect for cold pain intensity - Unweighted | 0.43 | |||||
| Mean effect for cold pain intensity - Weighted | 0.43 | |||||
| d. Ethnic Differences in Ischemic Pain Sensitivity: Studies comparing African Americans with Whites | ||||||
| Author/Year | Sample size | Age Range (Mean) | Mean (SD) | Effect Size≠ | ||
| Threshold | AA | NHW | AA | NHW | ||
| Grewen, et al., 2008 | 25 (25F) | 23 (23F) | (27) | 187.3 (127.5) | 195.3 (148.2) | -0.05 |
| Rahim-Williams et al., 2007 | 63 (42F, 21M) | 82 (32F, 50M) | 18-53 | 208.3 (186.2) | 185.3 (163.0) | 0.13 |
| Campbell et al., 2005 | 62 (41F, 21M) | 58 (24F, 34M) | (20) | 149.2 (144.0) | 117.0 (160.3) | 0.21 |
| Mechlin et al., 2005b | 49 (25F, 24M) | 42 (21F, 21M) | 18-47 | 333 (324) | 297 (265) | 0.12 |
| Mean effect for ischemic threshold - Unweighted | 0.10 | |||||
| Mean effect for ischemic threshold - Weighted | 0.13 | |||||
| Tolerance | AA | NHW | AA | NHW | ||
| Rahim-Williams et al., 2007 | 63 (42F, 21M) | 82 (32F, 50M) | 18-53 | 446.4 (276.0) | 550.0 (268.3) | -0.38 |
| Campbell et al., 2005 | 62 (41F, 21M) | 58 (24F, 34M) | (20) | 356.0 (290.0) | 469.0 (352.2) | -0.36 |
| Edwards et al., 2001* | 68 (33F, 35M) | 269 (100F, 69M) | 16-66 | 296.0 (194.3) | 525.0 (332.0) | -0.75 |
| Mechlin et al., 2005b | 51 (25F, 24M) | 42 (21F, 21M) | 18-47 | 452.0 (356.0) | 653.0 (397.0) | -0.53 |
| Grewen et al., 2008 | 25 (25F) | 23 (23F) | (27) | 281.4 (199) | 479.8 (332.0) | -0.75 |
| Mean effect for ischemic tolerance - Unweighted | -0.55 | |||||
| Mean effect for ischemic tolerance - Weighted | -0.59 | |||||
| Ischemic Pain Ratings | AA | NHW | AA | NHW | ||
| Campbell, et al., 2004-Unpl | 72 (38F, 34M) | 63 (21F, 42M) | 25-45 | 6.2 (2.9) | 5.3 (2.1) | 0.33 |
| Campbell, et al., 2004-Intens | 72 (38F, 34M) | 63 (21F, 42M) | 25-45 | 10.1 (2.3) | 8.8 (2.4) | 0.54 |
| Mean effect for ischemic ratings | 0.44 | |||||
| e. Ethnic Differences in Mechanical and Electrical Pain Sensitivity: Studies comparing African Americans with Whites | ||||||
| Author/Year | Sample size | Age Range (Mean) | Mean (SD) | Effect Size≠ | ||
| Pressure Pain Threshold | AA | NHW | AA | NHW | ||
| Rahim-Williams et al., 2007 | ||||||
| Pressure Pain-Masseter | 63 (42F, 21M) | 82 (32F, 50M) | 18-53 | 2.9 (1.1) | 3.2 (1.4) | -0.24 |
| Pressure Pain-Trapezius | 63 (42F, 21M) | 82 (32F, 50M) | 18-53 | 5.9 (2.2) | 6.7 (2.5) | -0.33 |
| Mean effect for pressure pain threshold | -0.29 | |||||
| Pressure Pain Tolerance | AA | NHW | AA | NHW | ||
| Woodrow et al., 1972 | 5393 (3336F, 2057M) | 34,077 (19,471F, 14,606M) | 20-70 | 21.0 (7.1) | 23.0 (8.1) | -0.20 |
| Mean effect for pressure pain tolerance | -0.20 | |||||
| Electrical Pain Threshold | AA | NHW | AA | NHW | ||
| Campbell et al., 2007 | 26 (13F, 13M) | 27 (14F, 13M) | 20-36 | 14.99 (8.98) | 20.95 (10.45) | -0.61 |
| Mean effect for electrical pain threshold | -0.61 | |||||
Data for gender/sex by ethnicity/race unavailable.
Means provided by author.
Effect size calculated such that a negative number reflects higher values for threshold, tolerance and pain ratings for the NHW group.
Data are from a clinical sample.
Table 3 identifies the total twenty-five articles dating from 1944 to October 2011 we included in the review.
Scope of the Studies Reviewed
Review of the studies included the following:
racial/ethnic group(s) identification
identification of the type of experimental pain stimuli/measures used
pain protocol procedures used
age and sex/gender of participants
sample size
mean/standard deviation
factors affecting differential pain response
Analysis
As in our previous meta-analysis of sex differences in experimental pain (19), we followed the guidelines for meta-analysis as reported by Wolf (21). We calculated effect sizes (Cohen’s d) for each pain measure compared across ethnic groups within each study. Each effect size was computed individually as the difference between the mean for African Americans and non-Hispanic Whites, and for non-Hispanic Whites and the secondary ethnic groups, divided by the pooled standard deviation (e.g. d = [μ African Americans - μ non-Hispanic Whites]/Pooled standard deviation) to provide quantitative information regarding ethnic group differences in experimental pain responses. Effect sizes were computed by subtracting the mean for non-Hispanic whites from the mean for African Americans (or other non-white ethnic groups), such that negative effect sizes indicate a lower value for the pain measure in African Americans. For measures of threshold and tolerance, negative effect sizes indicate greater sensitivity among AA, while for pain ratings, positive values indicate greater sensitivity for AA. The majority of the studies provided means and standard deviations (SD) or standard errors, and we used these data to calculate a pooled SD for each study separately. When these data were not available, we called or emailed the author to obtain the means and standard deviations. When the study author was unavailable, where possible we measured figures to estimate means and standard error bars. For comparisons of pain ratings, we only included studies that reported pain ratings in response to a standardized pain stimulus. Studies that collected pain ratings at the time of pain tolerance were not included in the analysis, as this approach fails to standardize the pain stimulus across individuals. Effect size values represented small (0.2 and below.), moderate (0.3-0.5) and large (0.6 and above). Sample sizes (n) ranged from quite small (e.g. n=5-6 per group) as in the study by Clark and Clark (16 to extremely large (n=37,470) as in the study by Woodrow et al., (22). Tables 1 and 2 provide data on sample sizes, means, standard deviations and effect sizes. For each subset of studies reviewed, we also computed both unweighted and weighted mean effect sizes. Unweighted mean effect sizes reflect the simple arithmetic mean of the effect sizes observed for a given subset of studies. Weighted mean effect sizes take study sample size into account, weighting larger studies more heavily than smaller ones. To compute weighted mean effect sizes, we applied the method proposed by Hedges (23-24).
3. Results
The studies in this review reported threshold, tolerance, intensity, unpleasantness, and/or suprathreshold ratings for thermal, cold, ischemic, mechanical/pressure or electrical stimuli. Several studies reported more than one measure within a stimulus modality (e.g. heat pain threshold and heat pain tolerance), and some studies included multiple stimuli (e.g. thermal and pressure pain, thermal and cold pain, heat, cold and pressure pain, or thermal, cold and ischemic). This structured review begins with findings by stimulus modality comparing our primary group comparisons; African Americans and non-Hispanic Whites. We follow with findings by stimulus modality from our secondary group of studies comparing non-Hispanic Whites and various ethnic groups. We next discuss the findings for our primary and secondary group of studies, and report on biological, psychological, socio- cultural and methodological factors affecting study outcomes.
3.1 African Americans and non-Hispanic Whites: Experimental pain effects
Thermal Pain Stimuli
Threshold and Tolerance
Seven studies comparing African Americans and non-Hispanic Whites reported heat pain threshold and six reported heat pain tolerance. The overall mean effect size was moderate for heat pain threshold for the seven studies providing means and standard deviations for effect size calculations (Table 1a). However, the study by Chapman and Jones (25) produced an unusually large effect relative to others. With the Chapman and Jones (25) study, the unweighted mean effect for threshold was moderate (-0.37) and the weighted mean effect size was small (-0.24). The Chapman and Jones (25) study was conducted more than 60 years ago, and used vastly different technology to induce thermal pain; a “1,000-watt tungsten filament lamp, focused by two 4-inch plano-convex lenses through an aperture 2.5 cm.” Researchers focused this heat radiating equipment on the middle of the participants’ forehead. They found that there were “narrow margins” in which variations occurred between participants in pain threshold and tolerance. Thus, they acknowledged a possible significant effect of age and ethnicity.
For heat pain tolerance, a total of six studies (6,8,12,25,26,27) produced a large mean effect. As found with thermal threshold, the Chapman and Jones (25) study again produced an unusually large effect size (-2.12). The unweighted mean effect size was large (-0.83), and the weighted effect size was only slightly smaller (-0.72). Thus, evidence indicates the existence of small ethnic group differences in thermal pain threshold but large differences in thermal pain tolerance.
Suprathreshold Ratings
Four studies (8, 11, 27,28) reported suprathreshold intensity and/or unpleasantness ratings for thermal pain, and produced effect sizes ranging from small to large (Table 1b). First, in the study by Edwards and Fillingim (27) that included healthy college-aged adults, effect sizes were small for ratings of intensity and moderate for pain unpleasantness. both Sheffield and colleagues (11) found that compared to non-Hispanic white individuals, African Americans rated heat pain as more unpleasant and more intense. These studies produced consistently large effect sizes across most temperatures tested. Campbell et al (8) used a temporal summation protocol for inducing suprathreshold heat pain, which involved brief, repetitive heat pulses in contrast to the more sustained and intermittent heat stimuli used by other authors. Based on this approach, effect sizes were generally moderate, with AA reporting greater pain intensity and unpleasantness than NHW. Lastly, the suprathreshold study by Kim and colleagues (28), reported consistently small effect sizes across all temperatures (43-49°), and found no significant differences for thermal stimuli. Taken together, ethnic group differences in intensity ratings showed a moderate unweighted mean effect size, but a small weighted effect size, while moderate unweighted and weighted effects sizes emerged for pain unpleasantness.
Cold Stimuli
Threshold and Tolerance
Four studies (6, 8, 12, 26) comparing African Americans and non-Hispanic Whites reported cold pain threshold, while six studies (6,8,12,26,28,29) reported tolerance (Table 1c). Overall, moderate unweighted (-0.42) and weighted (-0.41) effect sizes emerged for cold pain threshold and large effect sizess for cold pain tolerance (-0.80 unweighted, -0.79 weighted). Across the four studies, African Americans demonstrated lower thresholds and tolerances to cold stimuli compared to non-Hispanic White individuals.
Suprathreshold
Two studies (28,31) reported suprathreshold ratings for cold pain comparing African Americans and non-Hispanic Whites (Table 1c). Kim and colleagues (28) conducted a study consisting of 130 African Americans and 344 non-Hispanic Whites. For ratings of suprathreshold intensity, both studies produced a moderate effect, with African Americans reporting higher cold pain intensity. Weisse et al (30) also reported findings of similar magnitude for pain unpleasantness (data not shown). Overall, cold pain studies yielded large effects for tolerance, and moderate effects for cold threshold and suprathreshold ratings.
Ischemic Stimuli
Threshold and Tolerance
Four studies (6,8,12,26) reported ischemic pain threshold and five (6,8,10,12,26) reported ischemic tolerance. Table 1d lists the four studies producing small effect sizes for ischemic pain threshold. Three of these four studies reported higher pain thresholds in African Americans compared to non-Hispanic Whites. Studies assessing ischemic pain tolerance produced moderate to large effect sizes,), with African Americans showing lower tolerance. Of note, the study by Edwards et al (10) used a sample of chronic pain patients for experimental testing.
Suprathreshold
Only one study (31) reported suprathreshold ratings for unpleasantness and intensity for ischemic pain. Suprathreshold ratings yielded a small effect size for unpleasantness and a moderate effect size for intensity.
Across the majority of the studies reporting ischemic pain, we noted a small mean effect for threshold, and moderate effects for tolerance and suprathreshold ratings. On average, African Americans demonstrated higher pain threshold and suprathreshold ratings, and lower ischemic pain tolerance than non-Hispanic Whites.
Mechanical Pressure Stimuli
Threshold and Tolerance
Two studies (6, 22) comparing African Americans and non-Hispanic Whites reported mechanical pain using different pain induction procedures and measures (Table 1e). Rahim-Williams et al (6) reported pressure pain threshold on the left upper trapezius and left masseter using a hand held algometer having a 1 cm diameter tip. Woodrow et al (22) assessed pressure pain tolerance at the Achilles heel (ankle tendon) using a custom-built, motor-driven instrument that measured pounds per square inch. Results revealed that African Americans demonstrated lower pressure pain threshold and tolerance relative to non-Hispanic Whites, although the effect sizes were small.
Electrical Stimuli
Threshold
Campbell et al (32) was the only study investigating the nociceptive flexion reflex (NFR), a pain-related spinal muscle reflex, comparing African Americans and Whites (Table 1e). Participants included 29 African Americans and 28 non-Hispanic White individuals. The authors found significant ethnic group differences with African Americans demonstrating lower NFR thresholds compared to non-Hispanic Whites. Study results yielded a moderate effect size.
Studies comparing non-Hispanic Whites and Other Ethnic Groups: Experimental Pain Effects
Several studies have investigated experimental pain responses across a variety other ethnic groups. Given the multiple ethnic groups that have been studied and the resultant number of potential comparisons, it is difficult to produce meaningful effect sizes for all possible group differences. However, given that the most frequent group comparisons involved non-Hispanic Whites (in North America or Europe) compared to another ethnic group, we have computed effects sizes for these comparisons (i.e. White vs. non-White) across the pain modalities included in the studies.
Thermal Stimuli
Threshold and Tolerance
Three studies (6,15,33) expanded investigations of ethnic group differences in thermal pain sensitivity (Table 2a). For example, Rahim-Williams et al (6) compared Hispanics and non-Hispanic Whites and a moderate effect size emerged for pain threshold, while a small to moderate effect was observed for pain tolerance. Lower thresholds and tolerances were observed among Hispanic Whites. Meehan et al (15) used radiant heat in comparing Indians and Eskimos to non-Hispanic Whites. The study reported that Eskimos had higher pain thresholds compared to Whites. The study produced a large effect. On the other hand, using the same methodology, Indians and Whites demonstrated almost identical pain thresholds (small effect). In a study conducted in the United Kingdom (UK), Watson et al (33) compared heat pain threshold among Whites and South Asians in the UK and found a large effect, with higher thresholds among Whites. Thus, for White compared to non-White groups, these three studies evidenced an overall small mean effect size for threshold (unweighted, -0.01, weighted, 0.06) and a moderate effect from one study of tolerance (-0.59).
Cold Stimuli
Threshold and Tolerance
Three studies (6,33,34) expanded investigations of ethnic group differences in cold pain sensitivity (Table 2b). The Rahim-Williams et al (6) study compared Hispanics and non-Hispanic Whites, reporting a small (0.02) effect size for cold threshold, but a moderate (-0.54) effect size for tolerance, with Hispanics having lower values for both measures. Nayak et al (34) found a small to moderate (0.33) effect size for cold pain tolerance, with Whites tested in the United States showing lower tolerance compared with Indians tested in India. In contrast, the Watson team (33) found a large (0.62) effect size for cold threshold comparing White British and South Asians, with Whites showing lower thresholds, which reflect lower sensitivity (i.e. Whites required a lower temperature to elicit cold pain). Overall, the studies averaged a small effect size for threshold (unweighted, 0.18; weighted, 0.04) and tolerance (unweighted, -0.28; weighted,-0.20).
Ischemic Stimuli
Threshold and Tolerance
Rahim-Williams et al. and colleagues (6) compared ischemic pain threshold and tolerance in Hispanics and non-Hispanic Whites. These researchers demonstrated small (0.06-0.31) mean effect sizes for both measures with Hispanics showing lower pain threshold and tolerance than non-Hispanic Whites (Table 2c).
Mechanical Stimuli
Threshold
Five studies (6,13,35,36,37) investigating pressure pain threshold together produced variable results with a small (-0.40) mean effect size. The Rahim-Williams et al (6) research compared non-Hispanic White and Hispanic, college-aged adults, and applied pressure to the masseter and trapezius muscles. The study yielded small effect sizes (0.0 and -0.29). The Gazerani and Arendt-Nielsen (13) study compared Danish Caucasians and South Indians participants who ranged in age from 19-42.
Researchers applied pressure to the right and left frontalis muscles. Results revealed that pain threshold was lower in South Indians compared to Danish Whites, and effect sizes ranged from small to moderate (-0.15 to -0.59) depending on the test site. The third study by Merskey and Spear (35) compared Afro-Asians and non-Hispanic White medical students under the age of 30. Students were tested on the forehead and over the tibia. Alone, this study produced a small effect size (0.10). Next, the Komiyama et al (36) study, comparing Belgian Whites and Japanese, assessed tolerance for mechanical pressure pain using an algometer pressed onto the masseter muscle. The study produced a very small effect for pressure pain threshold. However, a later study by Komiyama (37) using the same populations and same testing procedures produced no effect (Table 2d). These investigators also compared pin-prick mechanical thresholds in these ethnic groups using monofilaments and reported large effect sizes, with Belgian subjects showing higher thresholds (34)
Tolerance
Three studies (27,35,36) assessed mechanical pain tolerance and produced varying effects; small to large (Table 2d). The Merskey and Spear (35) study of Afro-Asians and non-Hispanic Whites produced a small effect using mechanical pressure applied to the forehead and tibia. The study reported that Afro-Asians demonstrated a lower tolerance to mechanical pressure compared to White individuals. Woodrow et al (22) compared pressure pain tolerance in Orientals to non-Hispanic Whites, reporting moderate effects (-0.37). Notably, this study included a very large sample size of several thousand participants. Komiyama and colleagues (36) included a much smaller sample size but produced a similar effect size for pressure pain tolerance (-0.44). Effects were in the direction of higher mechanical pain tolerance for Belgian Whites compared to Japanese participants.
Electrical Stimuli
Three studies investigated electrical threshold and tolerance among multi-ethnic groups (Table 2e). Clark and Clark (16) compared “Occidentals” (of European designation) to Nepalese porters in Nepal, finding a large effect for pain threshold (5.68) and tolerance (4.53), such that Nepalese porters had higher threshold and tolerance than Occidentals. Chapman et al (38) used electrical acupuncture comparing American and Japanese individuals, and found a moderate (-0.53) effect size for electrical threshold, with higher threshold among Americans (Whites). Komiyama (37) comparing Belgian Whites and Japanese assessed electrical pain threshold in the trigeminal region and found. lower thresholds among Japanese participants compared to Belgian Whites, and the study produced a moderate effect size.
Results Summary
Our review of ethnic group differences in experimental pain indicates generally consistent evidence regarding ethnic group differences in experimental pain responses, especially for studies comparing African Americans and non-Hispanic Whites. African Americans reported more robust perceptual responses to painful stimuli, particularly lower pain tolerance and higher ratings of suprathreshold stimuli. However, evidence is less clear regarding the mechanisms underlying these differences. That ethnic differences emerge across all stimulus modalities argues against peripheral mechanisms, and several studies point to both psychosocial variables as well as endogenous pain inhibitory responses as important contributors. Our discussion highlights potential mechanisms believed to affect ethnic group differences in experimental pain outcomes.
4. Discussion
The studies reviewed spanned a period of approximately 67 years, (1944-2011) and examined experimental pain responses across multiple ethic groups, with the majority comparing African Americans and non-Hispanic Whites. We organized the studies into two main categories, African Americans compared to non-Hispanic Whites (primary comparison groups), and non-Hispanic Whites compared to other groups of varying ethnicities (secondary category).
The Reviewed Ethnic Group Studies: Methodological Considerations
Evidence from our review of fifteen studies comparing African Americans and non-Hispanic Whites provides support for ethnic group differences in pain sensitivity. These diverse studies measured pain stimuli across multiple modalities (thermal, cold, ischemic, electrical and/or mechanical), and while the direction of group differences was consistent, the magnitude of group differences varied substantially across stimulus modalities and pain measures. We also examined studies comparing non-Hispanic Whites to other ethnic groups (e.g. Japanese, Nepalese, Asian, Eskimo, Alaskan, Hispanic, etc). Given the wide range of ethnic groups included, these studies similarly revealed variation in pain response.
Ethnic group differences in response to experimental pain perception/sensitivity may be influenced by several methodological considerations, including: sample characteristics (sample size, age, gender, etc…), geographical location of testing, pain induction methods, site of pain stimulation, and experimenter characteristics. For example, in their study comparing electrical pain responses in Nepalese porters to Occidentals, Clark and Clark (16) stated; “…the six Nepalese did not speak English, had little schooling, were devout Buddhists, and some were illiterate… were accustomed to carrying 77-pound packs at high altitudes wearing only light clothing, even at freezing temperatures.” This example embodies the fact that ethnic group represents a proxy for a typically unknown and varied set of individual difference characteristics that extend well beyond biogeographical ancestry, including language, education, religious and cultural beliefs, and life experiences. In this study of Nepalese porters, stoicism may have been an important contributing factor, such that pain may be experienced but not reported (16).
Although our review focused on inter-ethnic group differences between non-Hispanic Whites and other “minority” ethnic groups, other studies have investigated intra-group differences in pain perception. For example, Yosipovitch and colleagues (14) found no significant between- group differences in thermal pain thresholds among Asian subgroups (Chinese, Malay and Indian) by race/ethnicity, gender/sex or skin type. However, these researchers do state an influence of age and education on thermal pain threshold outcomes, and recommend that these factors be considered in experimental pain studies. The study by Awad and team (17) assessing sensory pain thresholds in visceral afferent sensation among Hispanic irritable bowel syndrome (IBS) patients and Hispanic healthy controls in Mexico, was a different type study than those included in our review. The Awad team (17) reported results by health status; heightened visceral hypersensitivity for IBS patients compared to healthy controls. In a study of American “housewives” of European descent, Sternbach and Tursky (39) reported lower electrical pain tolerances in “Italians” compared to “Yankees” and “Jews.” Such intra-ethnic group differences reflect the heterogeneity of ethnic categories and should receive further empirical attention in the future.
Another important consideration could be the role of geographic region as a factor contributing to ethnic/racial group differences in experimental pain outcomes. Although most studies tested both ethnic groups in the home country of the non-Hispanic White participants (i.e. Europe or the US), others (16) tested in the home country of the non-White participants, while still other researchers (34,36) tested each ethnic group in its own home country. Examining the data from this perspective, it appears that ethnic group differences may be smaller or even in the opposite direction when non-White groups are tested in their home country. This raises the possibility that being a minority group may be an important determinant of laboratory pain responses, though this is admittedly highly speculative given the small number of studies that have tested non-White groups in their home country.
4.5 Factors Contributing to Ethnic Group Differences in Experimental Pain
Ethnic group differences in experimental pain sensitivity are inevitably determined by multiple mechanisms; sociocultural, psychological, and biological. We highlight these factors in the context of experimental pain testing.
Social and Cultural Factors
Multiple socio-cultural factors could affect pain sensitivity, including: beliefs and attitudes, language and expressiveness, gender/ sex, medication practices and beliefs, spirituality, social roles and expectations, cultural group membership, socialization of pain expression, perceived discrimination, socioeconomic status, acculturation, age and environmental factors (9,28,40-51). More than half a century ago Zborowski (50) suggested that a knowledge of group attitudes toward pain is extremely important for understanding individual reactions because members in different cultures may assume differing attitudes (e.g. pain expectancy and pain acceptance) towards various types of pain. Authors such as Morris (3), Lasch (44), and Zborowski (50) provide further discussion regarding multiple sociocultural variables potentially associated with ethnic group differences in clinical pain. Unfortunately, direct analysis of such factors is uncommon in experimental studies.
While all studies included in this analysis reported the race/ethnicity of participants, the majority of studies did not provide specific information as to how ‘race’ or ‘ethnicity’ were assessed. Studies followed two reporting procedures: that participants “self-identified” their race ethnicity or reported the race/ethnicity without stating how race/ethnicity was determined. However, Rahim-Williams et al (6) reported that ethnic identity contributed to group differences in pain response, and included a definition for “ethnic identity.” Ethnic identity is that part of an individual’s self-concept that derives from his or her knowledge of membership in a social group together with the value and emotional significance attached to that membership (3, 52). Ethnic identity is a predictor of locus-of-control coping style, which has been found to influence experimental and acute pain response (46). In the Rahim-Williams, et al (6) study, African Americans and Hispanics who reported stronger identification with their ethnic group, also exhibited greater pain sensitivity.
Given the importance and fluidity of socio-cultural and environmental influences, it is difficult to compare the Chapman and Jones (25) study, conducted more than 60 years ago, to more recent research. Clearly, the cultural context in the United States was dramatically different then, which likely influenced multiple aspects of the research. Such findings suggest a contribution of socio-cultural variables to ethnic differences in pain sensitivity. However, not all researchers agree on the influence of racial and ethnic group differences in discriminating painful stimuli. Perhaps this is due to thoughts that as both a scientific concept and cultural fact, ethnicity is wrought with pitfalls and perils (3). Thus, this continued debate on the influence of ethnicity on pain response and sensitivity suggests relevance for continued research to increase understanding of the variability in ethnicity and pain sensitivity.
Psychological Factors
Psychological factors such as pain coping strategies, mood, and hypervigilance have likewise been found to contribute to ethnic group differences in pain response (8,10,27,53). For example, African Americans have consistently reported higher levels of catastrophizing (43,54) and passive coping (8), which have been associated with greater pain sensitivity (7,55,56). Similarly, Campbell et al (8) found that scores on measures of hypervigilance were higher among African Americans, and while passive coping did not account for the ethnic group differences in experimental pain response, controlling for hypervigilance rendered group differences in heat and ischemic pain sensitivity non-significant. Klatzkin and colleagues (57) found that a history of mood disorder was associated with greater sensitivity to cold pain, but only among African Americans. Moreover, interpersonal influences may influence ethnic differences in pain responses. For instance, Black subjects reported cold pressor pain to be more intense and unpleasant when tested by a female than a male experimenter (30). Thus, multiple psychological processes may contribute to ethnic differences in pain responses.
Biological Factors
From a more biological perspective, ethnic differences in pain sensitivity may be related to alterations in endogenous pain control mechanisms. Mechlin and colleagues (12) reported that stress-induced cardiovascular and neuroendocrine responses were more strongly associated with pain inhibition among Whites than African Americans, providing evidence for ethnic differences in endogenous pain modulation. More recently, Mechlin and colleagues (12) found that Whites had higher oxytocin levels than African Americans, and oxytocin partially accounted for the ethnic group difference in ischemic pain tolerance (26). Moreover, recent evidence suggests a significant genetic contribution to experimental pain responses (58-61) although, the extent of genetic variance in pain sensitivity continues to be uncertain (3,61). For example, Kim et al (28) found that allele frequencies for single nucleotide polymorphisms (SNP) of potential candidate pain genes differed across ethnic groups, and TRPV1 genotype was associated with cold pain withdrawal time only among White females. In addition, the rare allele of the OPRM1 A118G SNP has been associated with reduced pain sensitivity in predominantly White subject samples (59,61) and this allele is substantially less frequent among African Americans than Whites (62,63). These findings suggest that genetic factors may contribute to ethnic group differences in pain perception. But, Nielsen (61) recommends caution in generalizing genetic findings from one pain modality to another (e.g. cold pressor and contact heat pain) because of the distinct phenomena measured by these modalities. Given the paucity of research directly investigating genetic contributions to pain in multi-ethnic samples, more studies are needed addressing the contribution of genetic factors to ethnic differences in pain responses. It is promising that the research on genetics of pain may provide more targeted therapies to improve pain treatment. However, it is important for researchers to stay mindful of the intricate ways in which human pain, no matter the genetic substrate, is shaped, modified and continuously re-shaped by culture (3).
Given the diversity of methodological, socio-cultural, psychological and biological considerations, one definitive and all inclusive explanation for ethnic group differences in experimental pain response is not possible. Yet, from our review, race/ethnicity does contribute significantly to variability in pain responses across most pain stimulus modalities. The most consistent evidence indicates that compared to non-Hispanic whites, ethnic minority groups demonstrate lower pain tolerances, and to a lesser degree higher pain ratings and lower pain thresholds.
In sum, explanations of ethnic group differences in experimental pain are as varied as the researchers conducting the studies, the methods used, and the individuals studied. It is note-worthy that the studies reviewed spanned several decades, and that there was no evidence that the magnitude of the ethnic group differences in pain response has changed systematically over this relatively long time period, despite substantial societal changes. This highly tentative observation suggests that factors in addition to sociocultural influences may contribute to ethnic group differences in pain; however, this speculation requires further empirical confirmation. Given the increasing diversity of most western populations, we believe there is a clear need for continued research and a cross-cultural dialogue to inform our understanding and enliven our discussions regarding the mechanisms underlying ethnic group differences in pain responses.
Limitations
This structured review acknowledges several limitations. First, we found 15 studies focusing on ethnic differences in experimental pain among African Americans and non-Hispanic Whites. Such limited information suggests the need for additional studies investigating ethnic differences in response to experimental pain. Furthermore, although we identified and included studies that investigated ethnic differences among populations such as Hispanics, Asians, Alaskan Indians, Eskimos, Danish, and South Indians, it is difficult to draw general conclusions across these studies not only due to the multiple ethnic groups involved, but also the different pain modalities tested across studies, and because socio-demographics of the compared groups were often not matched, These factors limit the interpretation of findings and may preclude comparisons across studies. Moreover, while our analysis was primarily limited to comparisons of the two main U.S. ethnic groups, (African Americans and non-Hispanic Whites), we are aware that there is great intra-ethnic variation within groups. Also, insufficient numbers of studies available limits meaningful pair-wise comparisons of any other ethnic groups. Furthermore, studies in this analysis included participants who were primarily healthy, young adults. As such, it is not clear whether these results generalize to older or less healthy populations. Also, as with most areas of research, publication bias may favor the reporting of significant ethnic group differences, which may inflate observed effect sizes. Moreover, many of the studies included multiple pain modalities and therefore conducted multiple statistical tests, often with no error correction. Therefore, there is a risk for increased Type 1 error in some studies.
Implications
Although transient experimental pain studied in the laboratory does not replicate many features of clinical pain (e.g. tissue injury, personal relevance, threat to the organism), experimentally-induced pain may have relevance as a useful surrogate measure for clinical pain (28,55). For example, quantitative sensory testing has value for predicting acute procedural pain, has been associated with pain treatment outcomes, and may provide valuable information for formulating mechanism-based diagnostic categories for pain disorders (55). Similarly, diffuse noxious inhibitory controls (DNIC), a laboratory measure of endogenous pain inhibition, predicts risk for developing chronic post-surgical pain (64). Moreover, one recent study reported a reduced DNIC response among African Americans compared to non-Hispanic Whites (32). Thus, experimental pain measures may facilitate identification of biological, psychological and socio-cultural contributions to ethnic differences in pain processing, which we posit can then be applied to elucidate ethnic group differences in clinical pain conditions.
Future directions
Based on our review, we offer the following recommendations to help guide future research regarding ethnic group differences in laboratory pain responses. First, there is a need for translational research investigating the ethnic group differences in both clinical and experimental pain within the same populations, in order to determine the clinical relevance of ethnic group differences in pain sensitivity. Second, future experimental pain studies examining ethnic group differences should assess both threshold and suprathreshold measures of pain perception, as well as include multiple stimulus modalities to assess pain and pain responses. We also recommend that future studies expand their laboratory pain measures to include ethnic group comparisons of endogenous pain inhibitory (e.g. DNIC) and facilitatory (e.g. temporal summation) responses. Third, given that many previous studies have enrolled healthy young samples, there is a need for research comparing ethnic group differences among older, community-dwelling populations, which would be more representative of many clinical populations. Fourth, delineation of ethnic groups for study requires assessing variations in intra-ethnic acculturation and assimilation which can affect group demarcation and may influence pain behavior (65). As such, future studies should report their methods for assessing ethnic group membership and should also identify and reference ethnic sub-group categories and any influence such groups may have upon study outcomes. In identifying and referencing group categories, we recommend a consistency in the use of terms such as race, ethnicity and culture. Anthropological insights may provide a foundation upon which to draw. We also believe that the use of standardized measures of acculturation or ethnic identity is important. We recognize that an interdisciplinary approach is required as research teams are multi-disciplinary. Moreover, extremely limited information is available regarding ethnic group differences in pain treatment outcomes, which represents an important area of future research. Finally, there is a need for a biopsychosocio-cultural model for studying ethnic differences in pain sensitivity, which can guide future studies and offer mechanistic hypotheses to be tested.
5. Conclusion
Our review indicates that biology, psychology, culture and environment (complex interface of biopsychosocio-cultural factors) contribute to ethnic group differences in experimental pain responses. Research that continues to identify and elucidate mechanisms underlying ethnic group differences will lead the way in advancing our knowledge and our science, with the ultimate translational goal of reducing ethnic disparities in pain and improving pain management for all individuals.
Figure 3.
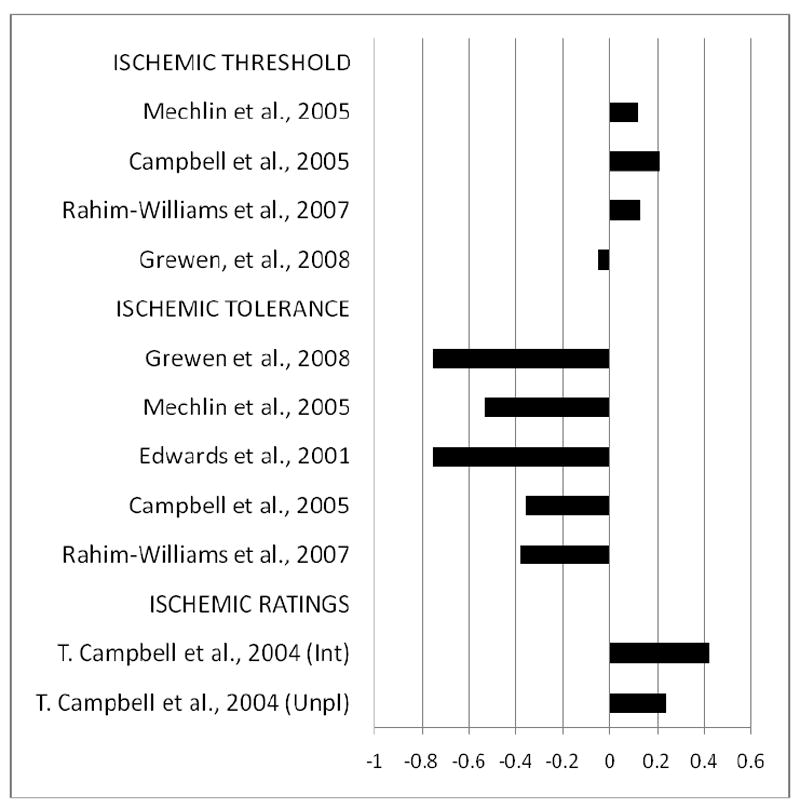
Effect Sizes for Ethnic Group Differences in Ischemic Pain Responses for studies Comparing African American (AA) to non-Hispanic White (NHW) Subjects. Bars reflect Cohen’s d. Bars greater in length to the left indicate greater values for NHW compared to AA, while bars increasing in length to the right indicate greater values of that measure for AA vs. NHW. Greater values for pain threshold and pain tolerance reflect lower pain sensitivity, while greater values for pain ratings indicate higher pain sensitivity. (Unpl)=unpleasantness ratings; (Int)=intensity ratings.
Acknowledgments
This work was supported by NIH/NINDS - Integrative and translational training in pain research Grant NS045551-03, AG033906, and the University of Florida, Claude D. Pepper Older Americans Independence Center, P30-AG028740.
Footnotes
Conflict of Interest/Disclosure: The authors acknowledge there is no conflict of interests or other disclosures to report related to this work.
Contributor Information
Bridgett Rahim-Williams, University of Florida, College of Public Health and Health Professions, Department of Behavioral Science and Community Health, PO Box 100175, Gainesville, FL 32610, Phone: (352) 273-6091, Fax: (352) 273-6048, brwms@phhp.ufl.edu.
Joseph L. Riley, III, University of Florida College of Dentistry, 1329 SW 16th Street, Room 5250, PO Box 103628, Gainesville, FL 32608, jriley@dental.ufl.edu.
Ameenah K.K. Williams, University of Maryland, College Park, 9339 Weathervane Place, Gaithersburg, MD 20886, akkwilliams32@gmail.com.
Roger B. Fillingim, University of Florida College of Dentistry, 1329 SW 16th Street, Room 5250, PO Box 103628, Gainesville, FL 32608, rfilling@ufl.edu.
References
- 1.Fillingim RB. Individual differences in pain responses. Curr Rheumatol Rep. 2005;7:342–347. doi: 10.1007/s11926-005-0018-7. [DOI] [PubMed] [Google Scholar]
- 2.Nielsen CS, Staud R, Price DD. Individual differences in pain sensitivity: measurement, causation, and consequences. J Pain. 2009;10:231–237. doi: 10.1016/j.jpain.2008.09.010. [DOI] [PubMed] [Google Scholar]
- 3.Morris DB. Ethnicity and Pain. Pain Clinical Updates. 2001;9(4):1–8. [Google Scholar]
- 4.Edwards RR, Moric M, Husfeldt B, Buvanendran A, Ivankovich O. Ethnic similarities and differences in the chronic pain experience: a comparison of African American, Hispanic, and White Patients. Pain Medicine. 2001c;6:88–98. doi: 10.1111/j.1526-4637.2005.05007.x. [DOI] [PubMed] [Google Scholar]
- 5.Green CR, Anderson KO, Baker TA, Campbell LC, Decker S, Fillingim RB, Kaloukalani DA, Lasch DE, Myers C, Tait RC, Todd KH, Vallerand AH. The unequal burden of pain: confronting racial and ethnic disparities in pain. Pain Medicine. 2003;4:277–294. doi: 10.1046/j.1526-4637.2003.03034.x. [DOI] [PubMed] [Google Scholar]
- 6.Rahim-Williams FB, Riley JL, III, Herrera D, Hastie BA, Fillingim RB. Ethnic identity predicts experimental pain sensitivity in African Americans and Hispanics. Pain. 2007;129:177–204. doi: 10.1016/j.pain.2006.12.016. [DOI] [PMC free article] [PubMed] [Google Scholar]
- 7.Walsh NE, Schoenfeld L, Ramamurthy S, Hoffman J. Normative model for cold pressor test. American Journal of Physical Medicine, and Rehabilitation. 1989;68:6–11. doi: 10.1097/00002060-198902000-00003. [DOI] [PubMed] [Google Scholar]; Edwards CL, Fillingim RB, Keefe F. Race, ethnicity and pain. Pain. 2001a;94:133–137. doi: 10.1016/S0304-3959(01)00408-0. [DOI] [PubMed] [Google Scholar]
- 8.Campbell CM, Edwards RR, Fillingim RB. Ethnic differences in responses to multiple experimental pain stimuli. Pain. 2005;13:22–26. doi: 10.1016/j.pain.2004.08.013. [DOI] [PubMed] [Google Scholar]
- 9.Edwards CL, Fillingim RB, Keefe F. Race, ethnicity and pain. Pain. 2001a;94:133–137. doi: 10.1016/S0304-3959(01)00408-0. [DOI] [PubMed] [Google Scholar]
- 10.Edwards RR, Doleys DM, Fillingim RB, Lowery D. Ethnic Differences in pain tolerance: clinical implications in chronic pain population. Psychosomatic Medicine. 2001b;63:316–323. doi: 10.1097/00006842-200103000-00018. [DOI] [PubMed] [Google Scholar]
- 11.Sheffield D, Biles PL, Orom H, Maxiner W, Sheps DS. Race and sex differences in cutaneous pain perception. Psychosomatic Medicine. 2000;62:517–523. doi: 10.1097/00006842-200007000-00010. [DOI] [PubMed] [Google Scholar]
- 12.Mechlin B, Morrow AL, Maixner W, Girdler SS. African Americans show alterations in endogenous pain regulatory mechanisms and reduced pain tolerance to experimental pain procedures. Psychosomatic Medicine. 2005;67:948–956. doi: 10.1097/01.psy.0000188466.14546.68. [DOI] [PubMed] [Google Scholar]
- 13.Gazerani P, Arendt-Nielsen L. The impact of ethnic differences in response to capsaicin-induced trigeminal sensitization. Pain. 2005;117:223–229. doi: 10.1016/j.pain.2005.06.010. [DOI] [PubMed] [Google Scholar]
- 14.Yosipovitch G, Meredith G, Chan YH, Goh CL. Do ethnicity and gender have an impact on pain thresholds in minor dermatologic procedures? A study on thermal pain perception thresholds in Asian ethnic groups. Skin Research and Technology. 2004;10:38–42. doi: 10.1111/j.1600-0846.2004.00051.x. [DOI] [PubMed] [Google Scholar]
- 15.Meehan JP, Stoll AM, Hardy JD. Cutaneous pain threshold in the Native Alaskan Indian and Eskimo. Journal Applied Physiology. 1954;6:397–400. doi: 10.1152/jappl.1954.6.7.397. [DOI] [PubMed] [Google Scholar]
- 16.Clark WC, Clark SB. Pain responses in Nepalese porters. Science. 1980;229:410–2. doi: 10.1126/science.7384815. [DOI] [PubMed] [Google Scholar]
- 17.Fillingim RB, King CD, Ribeiro-Dasilva MC, Rahim-Williams B, Riley JL., III Sex, gender, and pain: a review of recent clinical and experimental findings. J Pain. 2009;10:447–485. doi: 10.1016/j.jpain.2008.12.001. [DOI] [PMC free article] [PubMed] [Google Scholar]
- 18.Bernardes SF, Keogh E, Lima ML. Bridging the gap between pain and gender research: a selective literature review. Eur J Pain. 2008;12:427–440. doi: 10.1016/j.ejpain.2007.08.007. [DOI] [PubMed] [Google Scholar]
- 19.Riley JL, Robinson ME, Wise EA, Myers CD, Fillingim RB. Sex differences in the perception of noxious experimental stimuli: a meta-analysis. Pain. 1998;74:181–187. doi: 10.1016/s0304-3959(97)00199-1. [DOI] [PubMed] [Google Scholar]
- 20.Awad RA, Camacho S, Martin J, Rios N. Rectal sensation, pelvic floor function and symptom severity in Hispanic population with irritable bowel syndrome with Constipation. Colorectal Disease. 2006;8:488–493. doi: 10.1111/j.1463-1318.2006.01038.x. [DOI] [PubMed] [Google Scholar]
- 21.Wolf FM. Meta-Analysis: Quantitative methods for research synthesis. Sage Publications; Newbury Park, CA: 1986. [Google Scholar]
- 22.Woodrow KM, Friedman GD, Siegelaub MS, Collen MF. Pain tolerance: Differences according to age, sex and race. Psychosomatic Medicine. 1972;34:548–556. doi: 10.1097/00006842-197211000-00007. [DOI] [PubMed] [Google Scholar]
- 23.Hedges L. Distribution theory for Glass’s estimator of effect size and related estimators. Journal of Educational Statistics. 1981;6:107–128. [Google Scholar]
- 24.Hedges L. Estimation of effect size from a series of independent experiments. Psychological Bulletin. 1982;92:490–99. [Google Scholar]
- 25.Chapman WP, Jones CM. Variations in cutaneous and visceral pain sensitivity in normal subjects. Journal of Clinical Investigation. 1944;23:81–91. doi: 10.1172/JCI101475. [DOI] [PMC free article] [PubMed] [Google Scholar]
- 26.Grewen KM, Light KC, Mechlin B, Girdler SS. Ethnicity is associated with alterations in oxytocin relationships to pain sensitivity in women. Ethn Health. 2008;13:219–241. doi: 10.1080/13557850701837310. [DOI] [PMC free article] [PubMed] [Google Scholar]
- 27.Edwards RR, Fillingim RB. Ethnic differences in thermal pain responses. Psychosomatic Medicine. 1999;61:346–354. doi: 10.1097/00006842-199905000-00014. [DOI] [PubMed] [Google Scholar]
- 28.Kim H, Neubert JK, Rowan JS, Brahim JS, Iadarola MJ, Dionne A. Comparison of experimental and acute clinical pain responses in humans as pain phenotypes. Journal of Pain. 2004;5:377–384. doi: 10.1016/j.jpain.2004.06.003. [DOI] [PubMed] [Google Scholar]
- 29.Forsythe LP, Thorn B, Day M, Shelby G. Race and sex differences in primary appraisals, caastrophizing and experimental pain outcomes. J Pain. 2011;5:563–572. doi: 10.1016/j.jpain.2010.11.003. [DOI] [PubMed] [Google Scholar]
- 30.Weisse CS, Foster KK, Fisher EA. The influence of experimenter gender and race on pain reporting: Does racial or gender concordance matter? Pain Medicine. 2005;6:80–87. doi: 10.1111/j.1526-4637.2005.05004.x. [DOI] [PubMed] [Google Scholar]
- 31.Campbell TS, Hughes JW, Girdler SS, Maixner W, Sherwood A. Relationship of ethnicity, gender, and ambulatory blood pressure to pain sensitivity: effects of individualized pain rating scales. J Pain. 2004;3:183–191. doi: 10.1016/j.jpain.2004.02.305. [DOI] [PubMed] [Google Scholar]
- 32.Campbell CM, France CR, Robinson ME, Logan HL, Geffken GR, Fillingim RB. Ethnic differences in nociceptive flexion reflex. Pain. 2007;134:91–6. doi: 10.1016/j.pain.2007.03.035. [DOI] [PMC free article] [PubMed] [Google Scholar]
- 33.Watson PJ, Latif KR, Rowbotham DJ. Ethnic differences in thermal pain responses: A comparison of South Asian and Whit British healthy males. Pain. 2005;120:194–220. doi: 10.1016/j.pain.2005.08.010. [DOI] [PubMed] [Google Scholar]
- 34.Nayak S, Shiflett SC, Eshun S, Levine FM. Culture and gender effects in pain beliefs and the prediction of pain tolerance. Cross-Cultural Research. 2000;34:135–151. [Google Scholar]
- 35.Merskey H, Spear FG. The reliability of the pressure algometer. Brit J Soc Clin Psychol. 1964;3:130–136. [Google Scholar]
- 36.Komiyama O, Kawara M, De Laat A. Ethnic differences regarding tactile and pain thresholds in the trigeminal region. J Pain. 2007;8:363–369. doi: 10.1016/j.jpain.2006.12.002. [DOI] [PubMed] [Google Scholar]
- 37.Komiyama O, Want K, Svensson P, Arndt-Nielsen L, Kawara M, et al. Ethnic differences regarding sensory, pain and reflex responses in the trigeminal region. Clinical Neurophysiology. 2009;120:384–389. doi: 10.1016/j.clinph.2008.11.010. [DOI] [PubMed] [Google Scholar]
- 38.Chapman AR, Sato T, Martin RW, Tanaka A, Okazaki N, Colpitts YM, Mayeno JK, Gagliardi GJ. Comparative effects of acupuncture in Japan and the United States on dental pain perception. Pain. 1982;12:319–328. doi: 10.1016/0304-3959(82)90177-4. [DOI] [PubMed] [Google Scholar]
- 39.Sternbach RA, Tursky B. Ethnic differences among housewives in psychophysical and skin potential responses to electric shock. Psychophysiology. 1965;1:241–246. doi: 10.1111/j.1469-8986.1965.tb03240.x. [DOI] [PubMed] [Google Scholar]
- 40.Green CR, Hart-Johnson T. The adequacy of chronic pain management prior to presenting at a tertiary care pain center: the role of patient socio-demographic characteristics. J Pain. 2010;11:746–54. doi: 10.1016/j.jpain.2009.11.003. [DOI] [PubMed] [Google Scholar]
- 41.Edwards RR. The association of perceived discrimination with low back pain. J Behav Med. 2008;31:379–389. doi: 10.1007/s10865-008-9160-9. [DOI] [PubMed] [Google Scholar]
- 42.Hobara M. Beliefs about appropriate pain behavior: cross-cultural and sex differences between Japanese and Euro-Americans. European Journal of Pain. 2005;9:389–393. doi: 10.1016/j.ejpain.2004.09.006. [DOI] [PubMed] [Google Scholar]
- 43.Hastie BA, Riley JL, Fillingim RB. Ethnic differences in pain coping: factor structure of the coping strategies questionnaire and coping strategies questionnaire-revised. J Pain. 2004;5:304–16. doi: 10.1016/j.jpain.2004.05.004. [DOI] [PubMed] [Google Scholar]
- 44.Lasch KE. Culture, pain, and culturally sensitive pain care. Pain Manag Nurs. 2000;1(3 Suppl1):16–22. doi: 10.1053/jpmn.2000.9761. [DOI] [PubMed] [Google Scholar]
- 45.Bonham VL. Race, ethnicity, and pain treatment: striving to understand the causes and solutions to the disparities in pain treatment. J Law Med Ethics. 2001;29:52–68. doi: 10.1111/j.1748-720x.2001.tb00039.x. [DOI] [PubMed] [Google Scholar]
- 46.Bates MS, Edwards WT, Anderson KO. Ethnocultural influences on variation in chronic pain perception. Pain. 1993;52:101–112. doi: 10.1016/0304-3959(93)90120-E. [DOI] [PubMed] [Google Scholar]
- 47.Encandela JA. Social science and the study of pain since Zborowski: a need f or a new agenda. Soc Sci Med. 1993;36(6):783–91. doi: 10.1016/0277-9536(93)90039-7. [DOI] [PubMed] [Google Scholar]
- 48.Bates MS. Ethnicity and pain: A biocultural model. Soc Sci Med. 1987;24:47–50. doi: 10.1016/0277-9536(87)90138-9. [DOI] [PubMed] [Google Scholar]
- 49.Lipton JA, Marbach JJ. Ethnicity and the pain experience. Soc Sci Med. 1984;19:1279–1298. doi: 10.1016/0277-9536(84)90015-7. [DOI] [PubMed] [Google Scholar]
- 50.Zborowski M. Cultural components in response to pain. J Soc Issues. 1952;8:16–30. [Google Scholar]
- 51.Gagliese L. What do experimental pain models tell us about aging and clinical pain? Pain Medicine. 2007;8:475–477. doi: 10.1111/j.1526-4637.2007.00360.x. [DOI] [PubMed] [Google Scholar]
- 52.Phinney JS. The multigroup ethnic identity measure: a new scale for use with diverse groups. J Adolescent Research. 1992;7:156–176. [Google Scholar]
- 53.Hsieh AY, Tripp DA, Ji LJ, Sullivan MJL. Comparisions of catastrophizing, pain attitudes, and cold-pressor pain experience between Chinese and European Canadian Young Adults. The Journal of Pain. 2010 Nov;11(11):1187–94. doi: 10.1016/j.jpain.2010.02.015. [DOI] [PubMed] [Google Scholar]
- 54.Ruehlman LS, Karoly P, Newton C. Comparing the experiential and psychosocial dimensions of chronic pain in African Americans and Caucasians: findings from a national community sample. Pain Medicine. 2005;6:49–60. doi: 10.1111/j.1526-4637.2005.05002.x. [DOI] [PMC free article] [PubMed] [Google Scholar]
- 55.Edwards RR, Sarlani E, Wesselmann U, Fillingim RB. Quantitative assessment of experimental pain perception: Multiple domains of clinical relevance. Pain. 2005;114:314–319. doi: 10.1016/j.pain.2005.01.007. [DOI] [PubMed] [Google Scholar]
- 56.Geisser ME, Robinson ME, Pickrin WE. Differences in cognitive coping strategies among pain-sensitive and pain-tolerant individuals on the cold-pressor test. Behavior Therapy. 1992;23:31–42. [Google Scholar]
- 57.Klatzkin RR, Mechlin B, Bunevicius R, Girdler SS. Race and histories of mood disorders modulate experimental pain tolerance in women. J Pain. 2007;8:861–868. doi: 10.1016/j.jpain.2007.06.001. [DOI] [PMC free article] [PubMed] [Google Scholar]
- 58.Wang H, Papoiu ADP, Coghill RC, Wang PN, Yosipovitch G. Ethnic differences in pain, itch and thermal detection in response to topical capsaicin: African Americans display a notably limited hyperalgesia and neurogenic inflammation. British Journal of Dermatology. 2010;162:1023–1029. doi: 10.1111/j.1365-2133.2009.09628.x. [DOI] [PubMed] [Google Scholar]
- 59.Fillingim RB, Kaplan L, Staud R, Ness TJ, Glover TL, Campbell CM, et al. The A118G single nucleotide polymorphism of the mu-opioid receptor gene (OPRM1) is associated with pressure pain sensitivity in humans. J Pain. 2005;6:159–167. doi: 10.1016/j.jpain.2004.11.008. [DOI] [PubMed] [Google Scholar]
- 60.Lotsch J, Stuck B, Hummel T. The human mu-opioid receptor gene polymorphism 118A > G decreases cortical activation in response to specific nociceptive stimulation. Behav Neurosci. 2006;120:1218–1224. doi: 10.1037/0735-7044.120.6.1218. [DOI] [PubMed] [Google Scholar]
- 61.Nielsen CS, Stubhaug A, Price DD, Vassend O, Czajkowski N, Harris JR. Individual differences in pain sensitivity: genetic and environmental contributions. Pain. 2008;136:21–9. doi: 10.1016/j.pain.2007.06.008. [DOI] [PubMed] [Google Scholar]
- 62.Bond C, LaForge KS, Tian M, Melia D, Zhang S, Borg L, et al. Single-nucleotide polymorphism in the human mu opioid receptor gene alters beta-endorphin binding and activity: possible implications for opiate addiction. Proc Natl Acad Sci U S A. 1998;95:9608–9613. doi: 10.1073/pnas.95.16.9608. [DOI] [PMC free article] [PubMed] [Google Scholar]
- 63.Gelernter J, Kranzler H, Cubells J. Genetics of two mu opioid receptor gene (OPRM1) exon I polymorphisms: population studies, and allele frequencies in alcohol- and drug-dependent subjects. Mol Psychiatry. 1999;4:476–483. doi: 10.1038/sj.mp.4000556. [DOI] [PubMed] [Google Scholar]
- 64.Yarnitsky D, Crispel Y, Eisenberg E, Granovsky Y, Ben-Nun A, Sprecher E, et al. Prediction of chronic post-operative pain: pre-operative DNIC testing identifies patients at risk. Pain. 2008;138:22–28. doi: 10.1016/j.pain.2007.10.033. [DOI] [PubMed] [Google Scholar]
- 65.Zatzick D, Dimsdale J. Cultural variations in response to painful stimuli. Psychosomatic Medicine. 1990;52:544–557. doi: 10.1097/00006842-199009000-00007. [DOI] [PubMed] [Google Scholar]