Abstract
Perilipin coats the lipid droplets of adipocytes and is thought to have a role in regulating triacylglycerol hydrolysis. To study the role of perilipin in vivo, we have created a perilipin knockout mouse. Perilipin null (peri−/−) and wild-type (peri+/+) mice consume equal amounts of food, but the adipose tissue mass in the null animals is reduced to ≈30% of that in wild-type animals. Isolated adipocytes of perilipin null mice exhibit elevated basal lipolysis because of the loss of the protective function of perilipin. They also exhibit dramatically attenuated stimulated lipolytic activity, indicating that perilipin is required for maximal lipolytic activity. Plasma leptin concentrations in null animals were greater than expected for the reduced adipose mass. The peri−/− animals have a greater lean body mass and increased metabolic rate but they also show an increased tendency to develop glucose intolerance and peripheral insulin resistance. When fed a high-fat diet, the perilipin null animals are resistant to diet-induced obesity but not to glucose intolerance. The data reveal a major role for perilipin in adipose lipid metabolism and suggest perilipin as a potential target for attacking problems associated with obesity.
The molecular mechanisms by which neutral lipids, primarily triacylglycerols (TAG), are stored and energy in the form of free fatty acids is retrieved from adipose (fat) cells remain unresolved. Intracellular neutral lipid droplets in adipocytes and in steroidogenic cells are encased in a coating of perilipins (peri). Multiple peri isoforms exist as the result of alternative mRNA splicing of a single gene. Peri A is the most abundant isoform in adipocytes and steroidogenic cells; peri B is a minor form in adipocytes, whereas peri C and D are expressed only in steroidogenic cells (1) (X. Lu, J.G.-G., N. G. Copeland, D. J. Gilbert, N. A. Jenkins, C.L. & A.R.K., unpublished work). Peris are phosphorylated at multiple sites by cAMP-dependent protein kinase A (PKA) (2). Because neutral lipid hydrolysis is stimulated by activation of PKA, we have proposed that peri is an active regulator of the lipolytic complex (3). To date, functional data on peris have come from studies with cultured cell lines. When expressed ectopically in fibroblastic 3T3-L1 preadipocytes, peri A targets to intracellular neutral lipid droplets, where it protects TAG against hydrolysis (4). A similar protective effect is observed on expression of peri A in Chinese hamster ovary fibroblasts (J.T.T., K. E. Davis, A. M. Huml, J. M. Jones, K. A. Fraser, D. L. Brasaemle & C.L., unpublished work). In addition, adenovirus-mediated expression of peris protects against tumor necrosis factor-α-stimulated lipolysis in cultured 3T3-L1 adipocytes by maintaining the peri coating around the lipid droplets (5). To explore peri function in animal metabolism, we have introduced a targeted mutation in the peri locus by homologous recombination. In this paper, we described the phenotype of the peri null mouse (see Table 1, which is published as supplemental data on the PNAS web site, www.pnas.org) and compare and contrast our findings with those of a recently reported concurrent and independent study (6).
Experimental Procedures
Generation of peri Null Mice.
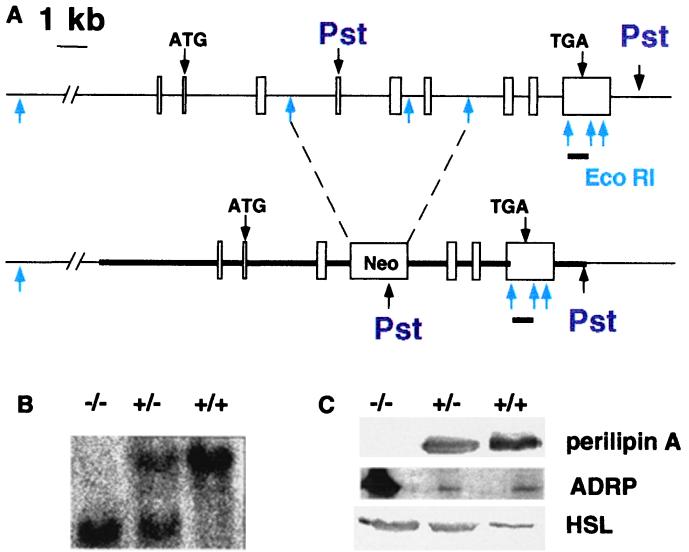
A targeted mutation of the peri gene was introduced as described in Fig. 1 into 129/SvEv Tac embryonic stem cells. Chimeric mice carrying the null allele were crossed to C57BL/6J mice to obtain F1 heterozygotes. Animals used in these studies were F2 generation derived from F1 intercrosses with wild-type (wt) littermates used as controls. Animals were fed either a standard chow diet [9% calories from fat from Ziegler Brothers (Gardner, PA) (Rodent NIH-7 chow)] or a high-fat diet [55% calories from fat (Harlan Teklad, Madison, WI) no. 93075)].
Figure 1.
Generation of the peri null mouse. (A) Targeted mutation of the murine peri gene. Upper diagram indicates the nine exons in boxes of the peri gene, with translation start and stop sites for the predominant Peri A form (3) and EcoRI and PstI sites. Below is the mutated peri gene with the Neomycin resistance cassette inserted into the EcoRI sites of introns 3 and 6. The position of the insertion would disrupt coding of all four peri mRNA species(X. Lu, J.G.-G., N. G. Copeland, D. J. Gilbert, N. A. Jenkins, C.L. & A.R.K., unpublished work). The region used for homologous recombination is indicated by the thick line. The bar below exon 9 represents the position of the downstream probe used to assess homologous recombination within the peri locus in PstI digests for genomic Southern blots. (B) Southern blotting of tail DNA digested with PstI. (C) Immunoblotting of adipose tissue extracts for peri A, ADRP, and HSL. Adipose tissue samples were extracted and proteins solubilized as described under Experimental Procedures. Gel lanes were loaded with the equivalent of proteins extracted from 10 mg of adipose tissue.
Adipocyte Isolation and Lipolysis.
Adipocytes were isolated from epididymal fat pads by collagenase digestion according to the Rodbell method (7), as modified by Honnor et al. (8), in solutions containing 500 nM adenosine. Incubations to measure lipolytic activity contained 1.0 units/ml adenosine deaminase plus 100 nM N6-phenylisopropyladenosine (PIA) for basal activity or plus 10 μM isoproterenol for stimulated activity. Incubations were carried out for 60 min; glycerol released to the medium was determined by a radiometric assay (9) adapted to microtiter plates (10), and fatty acids released to the medium were measured enzymatically with the use of the colorimetric “Half-micro test” (Roche Molecular Biochemicals, no. 1 383 175). Data are normalized to cell number; cells were counted according to Fine and Di Girolamo (11). Cell volumes were calculated by using diameter measurements obtained with a Zeiss LSM5 confocal microscope. Typically, the diameters of at least 100 cells were measured for each cell preparation. Total neutral lipid was measured gravimetrically and cell numbers were calculated accordingly (11).
Immunoblotting.
Adipose tissue samples for immunoblot analysis were homogenized in 10 mM Tris⋅HCl, pH 7.4/1 mM EDTA/10 mM NaF/0.1 mM [4-(2-amminoethyl)-benzenesulfonylfluoride⋅HCl]/20 μ M leupeptin/1 mM benzamidine. Homogenates were extracted for 1 h in ice-cold CHCl3/methanol (2:1) and centrifuged for 15 min. The aqueous and organic phases were discarded, and the remaining protein pellet was suspended in Laemmli sample buffer. Each lane of SDS/PAGE gels was loaded with proteins derived from 10 mg of adipose tissue.
Northern Analysis.
RNA was prepared from isolated adipocytes with the use of Trizol (GIBCO/BRL). Gels were loaded with 10 μg of RNA per lane.
Plasma Chemistry.
Plasma samples were prepared from tail bleeds of either fed or fasted animals, as indicated. Insulin and leptin values were determined by RIA with kits from Linco Research Immunoassay (St. Charles, MO) and CrystalChem (Chicago, IL), respectively. Cholesterol and TAG were measured by the National Institutes of Health Clinical Pathology Department. Glucose was measured with the Bayer Glucometer Elite (Elkhart, IN). For glucose tolerance tests, animals fasted overnight were injected i.p. with 1 g/kg of glucose.
Results and Discussion
The disruption of the peri locus as described in Fig. 1A was confirmed by Southern hybridization (Fig. 1B). Progeny of heterozygous matings were observed in the expected Mendelian ratio: 49:97:54 for peri+/+/peri+/−/peri−/− F2, respectively. Normal fecundity and no abnormal viability or behavior were observed in the perilipin null (peri−/−) animals.
Immunoblot analysis revealed the absence of peri in the adipose tissue of peri null mice (Fig. 1C). Adipose differentiation-related protein/adipophilin (ADRP) is a peri-related lipid droplet-bound protein found in most vertebrate cells (12). Early in the differentiation of 3T3-L1 adipocytes, the lipid droplets are coated with ADRP, but with the onset of peri gene expression, the droplets become coated with peri, and the ADRP protein nearly disappears despite the persistence of high levels of ADRP mRNA (12). Whereas minimal ADRP was detected in wt animal adipose tissue, there was abundant ADRP protein in the adipose tissue of the peri null animals (Fig. 1). Immunocytochemical studies on frozen tissue sections revealed that ADRP coated the lipid droplets in the peri null adipocytes, whereas no ADRP was detected in sections of wt adipocytes (data not shown). It is likely that the presence of ADRP protein reflects the lack of ADRP displacement by peri in the peri null animals.
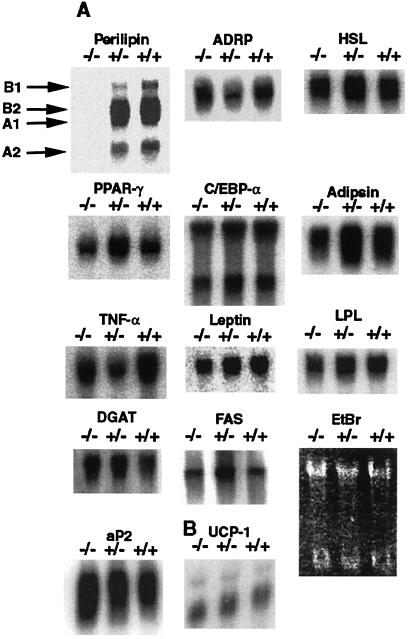
Adipocyte differentiation appears normal in the peri null animals, as evidenced by the relatively normal expression levels of mRNAs for an array of adipocyte genes, notably peroxisome proliferation-activated receptor γ (PPARγ) and CCAAT/enhancer-binding protein α (C/EBPα) (Fig. 2). Moreover, unlike another lean animal model, the sterol response element-binding protein-1c transgenic mouse (13), Northern blotting of mRNA extracted from adipose tissue of peri−/− mice, did not show increased expression of the preadipocyte marker, Pref-1 (data not shown), which would be indicative of cells that did not differentiate into adipocytes.
Figure 2.
Gene expression in peri+/+, peri+/−, and peri−/− mouse white and brown adipocytes. Northern blot analysis of mRNAs in isolated adipocytes from white adipose tissue and total brown adipose tissue. Scanning of blots revealed that apart from peri, there was less than a 2-fold difference between wt and either heterozygous or peri null mice for each message. (A) Total RNA was obtained from isolated adipocytes from three to five mice for each genotype. Ten micrograms of total RNA of each genotype was electrophoresed, transferred to nylon membranes, and probed with the indicated cDNA probe. Various peri messages are identified according to a recent analysis of the perilipilin gene structure by Lu et al. (X. Lu, J.G.-G., N. G. Copeland, D. J. Gilbert, N. A. Jenkins, C.L. & A.R.K., unpublished work). PPAR-γ, peroxisomal proliferation activated receptor-γ; C/EBP-α, CCATT/enhancer-binding protein-α; TNF-α, tumor necrosis factor-α; aP2, adipocyte lipid-binding protein; LPL, lipoprotein lipase; FAS, fatty acid synthase; DGAT, diacylglycerol acyltransferase. EtBr is a photograph of an ethidium bromide-stained gel. (B) Total RNA was obtained from brown adipose tissue from six animals from each genotype. Ten micrograms of total RNA from each pool were analyzed as above. UCP-1, uncoupling protein-1.
When fed a chow diet, the peri null (peri−/−) and wt animals had equivalent body weights (Fig. 3) and food consumption. Over a 7-week period, singly caged wt males consumed 17.1 ± 1.2 kcal/d, and peri null males ate 17.0 ± 1.0 kcal/d (means ± SEM; n = 6). Moreover, identical food consumption was maintained for a 10-week period with females caged in groups of three, and there were no differences in body weights among the genotypes (Fig. 3E). Despite the equal food consumption, the peri null mice contained substantially less adipose tissue than wt mice (Fig. 3). Male and female mice manifested a reduction of 72 and 63%, respectively, in combined weights of reproductive (epididymal or parametrial), retroperitoneal, and inguinal fat pads. Visual inspection also revealed a substantial reduction in s.c. fat of the peri null animals. There was great variability in fat-pad weight of all genotypes, a possible reflection of the mixed genetic backgrounds of the F2 mice. For example, within a single cohort of 16 male mice, epididymal pad weights ranged from 532 to 1,425 mg for peri+/+ mice and from 118 to 469 mg for the peri−/− animals. Occasionally, peri−/− mice contained no visible fat pads, a phenomenon never observed in the other genotypes. Heterozygote (peri+/−) fat pads weighed ≈20% less than wt pads, but this was not statistically significant because of the heterogeneity of pad weights. Visible fat droplets were absent in brown fat cells of peri−/− mice, unlike littermate controls (Fig. 3). The weights of heart, spleen, liver, spleen, adrenal, testes, ovary, kidney, and brown fat did not differ among the genotypes with chow-fed animals (data not shown). No lipid depositions were evident in hematoxylin and eosin-stained sections of liver from peri−/− mice (Fig. 3).
Figure 3.
Gross phenotype of the peri null mouse. (A) Representative photographs of abdominal cavities of wt and null mice. Animals shown were weight-matched littermates. Hemotoxylin and eosin stained sections (B) of white adipose tissue, (C) brown adipose tissue, and (D) liver. (E) Body weights of adult male and female animals. (F) Combined masses of reproductive, inguinal, and retroperitoneal fat pads. Values represent means ± SEM for n = 8 animals of each genotype. For fat-pad weights, differences between wt and peri null animals were at P = 0.002 for males and P = 0.02 for females.
A cohort of wt and perilipin null males were fed a chow diet until 14 weeks of age, after which one-half of the animals were placed on a high-fat diet. When fed a high-fat diet for 7 weeks, the mice exhibited similar growth curves; starting weights were 30.9 ± 1.4 and 29.0 ± 1.4 g for peri+/+ and peri−/− mice, respectively, and final weights were 39.3 ± 2.7 and 35.8 ± 1.6 g (n = 7, P = 0.15). The animals consumed equal amounts of food, 18.75 ± 0.75 and 18.0 ± 0.15 Kcal per day for wt and null animals, respectively. The animals were maintained on their respective diets for an additional 7 weeks, after which fat pads were dissected and weighed. There were dramatic differences in epididymal fat pads [2.17 ± 0.38 and 0.475 ± 0.13 g (P = 0.0008), respectively, for peri+/+ and peri−/− mice] on the high-fat diet. For both genotypes, these values are ≈80% greater than epididymal fat pads for age-matched animals fed a chow diet. The ability of the peri null mouse to accumulate only 25% the adipose tissue amassed in the wt animals indicates that the peri null animals are resistant to diet-induced obesity. The lower adipose pad weight did not protect the animals from glucose intolerance, because both wt and peri null animals fed the high-fat diet exhibited markedly sluggish responses to an injection of glucose (data not shown).
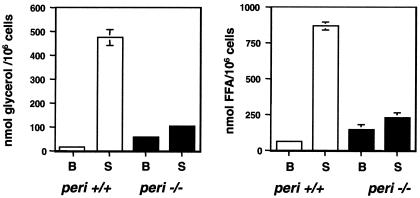
Lipolysis studies with isolated adipocytes demonstrate a major role for peri in both basal and stimulated adipocyte TAG hydrolysis (Fig. 4). When normalized for cell numbers, basal glycerol release was nearly four times greater in peri−/− adipocytes than in peri+/+ cells (56.2 ± 2.9 vs.15.1 ± 1.1 nmol glycerol per 106 cells over 60 min, respectively). By contrast, the absolute activity in stimulated adipocytes from peri null mice was only 30% that of wt cells. Thus, whereas wt cells exhibited a ≈30-fold stimulation, peri nulls showed only a 3-fold increase on stimulation. Similar differences between basal and stimulated values were also evident by measuring free fatty acid released. Comparison of glycerol and fatty acid release data indicates that fatty acid reesterification proceeded at a normal pace in the peri null animals. Given the large variability among fat pad weights, these studies were performed on small and large pads that contained, accordingly, smaller and larger adipocytes, and differences between lipolytic patterns of wt and peri null adipocytes depicted in Fig. 4 were found to be independent of cell size and TAG content.
Figure 4.
Adipocytes from peri null mice exhibit both elevated basal and reduced stimulated lipolysis. Adipocytes were prepared as described in Experimental Procedures. Incubations to measure lipolytic activity contained 1 unit/ml of adenosine deaminse plus 100 nM PIA for basal (B) activity and 10 μM isoproterenol for stimulated (S) activity. Values represent the means ± SEM of quadruplicate determinations of nanomolar glycerol or free fatty acids released per 106 cells per 60 min. For differences in basal fatty acid release between wt and peri null mice, P = 0.013. For all other comparisons between these two phenotypes, P < l0−6. Shown is a typical experiment; error bars not visible were smaller than the thickness of the line describing the data bar.
Increased basal lipolysis in peri null adipocytes may result from an increase in hormone-sensitive lipase (HSL) mass or activity; alternatively, this increase may reflect the absence of a protective coat of perilipin on the lipid droplet. Densitometric scanning of HSL immunoblots, such as shown in Fig. 1, revealed that HSL per unit weight of adipose tissue was increased in peri null over wt mice by a factor of 2.4 ± 0.3 (mean ± SEM; n = 5). This difference appears to reflect an increased number of cells per volume of peri null adipose tissue. Adipocytes isolated from typical fat pads (epididymal/parametrial) of peri−/− animals (range = 200–500 mg) had diameters ranging from 58 to 69 μm and cell volumes ranging from 1.02 to 1.7 × 105 μm (3). Corresponding values for a range of typical fat pads from wt animals (range = 640–1,000 mg) were for diameters 84–101 μm and volumes 3.1–5.4 × 10⁵ ± μm (3). Thus, samples of adipose tissue from the null animals contained ≈3 times the number of cells than tissue samples of equivalent weight from a wt animal, which approximates the 2.4-fold differences in HSL mass found by immunoblotting. Because, therefore, the amount of adipocyte HSL per cell appears not to differ between the two genotypes, we conclude that the increased basal lipolysis of the adipocytes of the peri null animals may be accounted for by the loss of the protective action of nonphosphorylated peri at the droplet surface.
Our interpretation of elevated basal lipolysis in the absence of peri is consistent with current data on both 3T3-L1 fibroblasts (4) and Chinese hamster ovary fibroblasts (J.T.T., K. E. David, A. M. Huml, J. M. Jones, K. A. Fraser, D. L. Brasaemle & C.L., unpublished work), showing that the presence of peri can mute lipolysis without a change in cellular lipase activities. While this manuscript was being completed, a paper appeared that described a similar study (6). Although both the present and concurrent studies (6) show elevated basal lipolysis in isolated adipocytes, in our studies the absolute stimulated activity in peri null adipocytes was far less than in wt adipocytes. By contrast, Martinez-Botas et al.(6) found that basal lipolytic activity in peri null adipocytes was comparable to the fully stimulated state of the wt adipocytes.
It is difficult to reconcile our findings on cellular lipolysis with those of Martinez-Botas et al. (6), who attributed the elevated basal lipolysis in peri null adipocytes to the presence of “activated” HSL in homogenates of adipose tissue and concluded that HSL activation reflected the absence of peri, i.e., peri inhibits HSL activity. Because HSL activities were measured in the infranatants of centrifuged homogenates that do not contain peri, a presumed inhibition of HSL in wt infranatants occurred after separation of HSL from the peri. This scenario is inconsistent with the different subcellular localizations of HSL and peri in unstimulated adipocytes (10, 14). Different cell incubation conditions may also account for the differences between the two studies. Whereas our basal condition was designed to suppress cAMP formation by inclusion of PIA to repress adenylyl cyclase activity, Martinez-Botas et al. (6) included adenosine deaminase. Similar to rat adipocytes (8, 15), we have found that adenosine deaminase stimulates lipolysis in murine adipocytes to 30% of the maximal level achieved with adrenergic receptor stimulation (data not shown). Thus, we suggest that PKA is quiescent under basal assay conditions by using PIA but is partially activated under assay conditions by using adenosine deaminase. These differences have important implications for assessing peri function, which we view to act dually as a suppressor of basal lipolytic activity and as a necessary cofactor in full lipolytic stimulation.
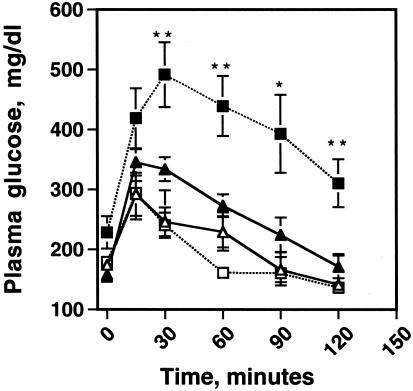
Because fatty acids released from adipose tissue are implicated in the development of type 2 diabetes mellitus (16), one might expect the peri null animals with an enhanced basal lipolytic rate to be susceptible to insulin resistance. Surprisingly, plasma fatty acid concentrations were equivalent to or lower in peri null than in wt animals (Table 2, which is published as supplemental data on the PNAS web site, www.pnas.org). Glucose tolerance tests revealed no differences among the genotypes for animals less than 30 g in weight. However, as the animals exceeded 30 g, significant glucose intolerance developed in the peri−/− mice as compared with the peri+/+ mice (Fig. 5). Measurements of blood glucose and insulin values in nonfasted female mice revealed a significant elevation of plasma insulin concentration in the peri null animals (supplemental data), indicating that the peri−/− animals exhibit a greater tendency toward insulin resistance than the peri+/+ animals. Plasma glucose and insulin concentration were also elevated in male mice but not to a level that achieved statistical significance. There were only modest increases in the plasma cholesterol and triacylglycerol concentrations in the plasmas of the peri null animals (supplemental data). It is possible that mice weighing >30 g posses alleles of modifier genes that affect both weight and insulin sensitivity. Martinez-Botas et al. (6) failed to detect glucose intolerance or elevated plasma insulin in their peri null animals, possibly because they did not study animals over 30 g or because of different genetic backgrounds; the mice used by these investigators were backcrossed to the F3/F4 generation into C57BL/6J mice, whereas ours were not.
Figure 5.
Peri null animals exhibit a greater tendency toward glucose intolerance than wt mice. Fourteen-week-old male littermates, both wt and perilipin null mice, were fasted overnight and challenged with an i.p. injection of 1 g of glucose per kilogram of body weight. Plasma glucose values were measured at the times indicated after injection by using a Glucometer Elite blood glucose meter (Bayer). Triangles show wt and squares show peri null mice. Open symbols are animals <30 g, and closed symbols are animals >30 g. Values are means ± SEM, n = 6 per group. Student's t test, different from wt: *, P = 0.01, **, P = 0.005.
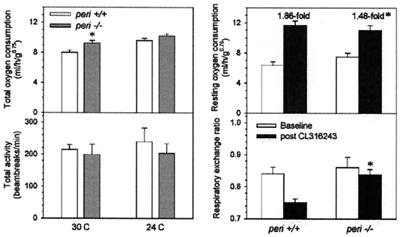
The metabolic rates of both wt and peri null mice were measured as oxygen consumption by using indirect calorimetry. At thermoneutrality (30°C), total oxygen consumption of the peri null mice was 16% greater than the wt mice (Fig. 6). This difference was not because of increased physical activity. When measured at 24°C, oxygen consumption was not significantly different, presumably because of compensatory facultative thermogenesis. The 24-hour average respiratory exchange ratio was the same in the two groups (data not shown). In agreement with the unchanged body weight despite reduced adiposity, carcass analysis revealed an increase in lean body mass [5.19 ± 0.08 and 5.69 ± 0.11 g in wt and peri null mice, respectively (n = 8, P = 0.001)]. The 10% increased muscle mass would be expected to contribute a 7% increase in metabolic rate (17, 18).
Figure 6.
Metabolic studies. Indirect calorimetry and treatment with CL310243 were performed as described (24) in 13-week-old female peri−/− and littermate wt mice. Left panel data were measured from 6:00 p.m. to 12:00 noon. Data are means ± SEM (n = 6/group). * indicates a difference between peri−/− and corresponding wt mice at P = 0.03 (Upper Left), P = 0.01 (Upper Right), and P = 0.002 (Lower Right).
Injection of the β3-adrenergic agonist, CL316243, was used to study in vivo lipolysis and thermogenesis. The peri null mice showed a marked blunting of the increase in oxygen consumption (Fig. 6). This is consistent with increased basal and reduced stimulated lipolysis. The peri null mice also have a blunted CL316243-induced decrease in the respiratory exchange ratio (RER) (Fig. 5). A blunted fall in RER is also seen in mice treated chronically with a β3-adrenergic agonist and presumably reflects adaptation to the chronic lipolytic state (O.G. and M.L.R., unpublished work).
Body temperature, which was measured by continuous telemetry monitoring of free-ranging mice (19), was the same in peri null and wt mice, including a normal diurnal rhythm for both body temperature and physical activity (data not shown). As expected for animals with reduced fat stores (19), on fasting, the peri null mice entered torpor more readily than did the controls (data not shown).
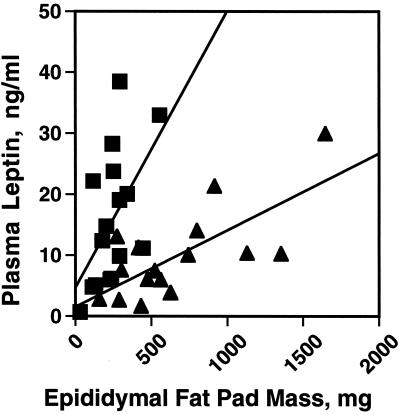
Normally, plasma leptin levels are proportional to adipose tissue mass (21). Thus, one might expect that peri null animals with ≈70% decrease in adipose tissue mass would exhibit proportionately decreased plasma leptin concentrations. A correlation between adipose mass and plasma leptin was preserved in the peri null animals, but with a 5-fold change in slope (Fig. 7). Serum leptin levels per unit fat mass were enhanced in peri null as compared with the wt animals. Thus, on average, peri null mice can accumulate 50% greater leptin than wt animals. The increased leptin may, in part, be responsible for the relative absence of lipoatrophic symptoms, such as very high plasma insulin concentrations, elevated blood lipids, fatty liver, and general organomegaly, in the peri null animals. Leptin infusion has been shown to reverse such symptoms in other lean mouse models, such as the sterol response element-binding protein 1c transgenic mouse (21) and to partially attenuate the symptoms of the A-ZIP mouse (22). This finding suggests that peri may participate in the signaling mechanisms whereby increased adipose lipid leads to increased leptin release. This involvement may be posttranscriptional, as leptin mRNA levels in peri null adipocytes were similar to those in wt animals (Fig. 2). The apparent differences between our leptin data and those of Martinez-Botas et al., who found reduced plasma leptin concentrations in perilipin null mice (13), may be because of the differences in the manner in which the data are expressed or, again, because of the slightly different genetic backgrounds (see above).
Figure 7.
Altered relationship between plasma leptin concentration and fat-pad weights in peri null mice. Plasma leptin levels of fed wt (triangles) and peri null (boxes) were measured in triplicate in 16 males, 8 at 10 weeks of age and 8 aged 14 weeks, by using an ELISA assay (CrystalChem). The two age groups showed nearly identical data. The average plasma leptin values (mean ± SEM) were: wt mice, 9.9 ± 1.8 ng/ml and peri null mice 16.0 ± 2.8, n = 16. Student's t test, difference between genotypes, P = .013. The slope for the wt curve is 0.013 (r = 0.513) and for the peri null curve, 0.067 (r = 0.713). The two curves are significantly different (P < 0.00028).
The cAMP-regulated lipolytic reaction in adipocytes is the major gateway for stored energy release in animals, and for nearly three decades, the focus on control of this reaction has been HSL, which is the only known PKA-regulated lipase (23). As is evident from the present results, peri has a central role in the regulation of PKA-mediated lipolysis. Clearly, the peri coating on the droplet surface serves to dampen lipolysis in the absence of elevated cAMP. Although there was a compensatory increase in ADRP at the surface of lipid droplets in the peri−/− mice, ADRP, which is not phosphorylated by PKA, does not restore the function normally carried out by peri. In addition to this role for peri that is not phosphorylated at its PKA sites, the data also indicate that PKA phosphorylated peri participates actively in cAMP-stimulated lipolysis, possibly by facilitating the interaction of HSL with the lipid droplets. This facilitation may occur by direct interaction of HSL with peri or it may be the indirect consequence of a conformational change of peri on phosphorylation that denudes areas of the droplet surface and thus provides better access of HSL to core TAG.
It is not clear from our studies whether peri would be an appropriate target for attacking the obesity problem. Although elimination of peri leads to a lean phenotype, the accelerated onset of insulin resistance in male mice signals a caveat to this approach. Whether this potential drawback will be found generally with peri ablation against other backgrounds remains to be determined. On the other hand, given the clear role of peri in adipocyte lipolysis and the presumed role of adipose-derived fatty acids in the development of type 2 diabetes, agents that interact with peri to suppress lipolysis may have therapeutic potential.
Supplementary Material
Acknowledgments
We are grateful to Drs. David Bernlohr (University of Minnesota, Minneapolis), Samuel Cushman (National Institutes of Health, Bethesda, MD), Robert Farese, Jr. (University of California, San Francisco), Ghokan Hotamisligil (Harvard University, Boston), M. Daniel Lane (Johns Hopkins University, Baltimore), Bruce Spiegelman (Dana Farber Cancer Institute, Boston), Hei-Suk Sul (University of California, Berkeley), and Salih Wakil (Baylor University, Houston) for supplying DNA probes. For excellent technical support, we thank Jai-Wei Gan and Bernice Marcus-Samuels. We thank Dr. Brian Oliver for careful review of the manuscript and Drs. Susan Fried, Barbara Kahn, Shinji Miura, and Charles J. Schultz for useful discussions and advice. Carcass analyses were performed by Dr. Tim R. Nagy, Clinical Nutrition Research Unit, University of Alabama, Birmingham, AL (P30-DK56336). Finally, C.L. dedicates this paper to the memory of his late friend and mentor, Dr. Martin Rodbell.
Abbreviations
- peri
perilipin
- HSL
hormone-sensitive lipase
- ADRP
adipose differentiation-related protein
- TAG
triacylglycerols
- PKA
cAMP-dependent protein kinase A
- PIA
N6-phenylisopropyladenosine
- wt
wild type
Footnotes
This paper was submitted directly (Track II) to the PNAS office.
References
- 1.Servetnick D A, Brasaemle D L, Gruia-Gray J, Kimmel A R, Wolff J, Londos C. J Biol Chem. 1995;270:16970–16973. doi: 10.1074/jbc.270.28.16970. [DOI] [PubMed] [Google Scholar]
- 2.Greenberg A S, Egan J J, Wek S A, Moos M C, Jr, Londos C, Kimmel A R. Proc Natl Acad Sci USA. 1993;90:12035–12039. doi: 10.1073/pnas.90.24.12035. [DOI] [PMC free article] [PubMed] [Google Scholar]
- 3.Londos C, Brasaemle D L, Schultz C J, Segrest J P, Kimmel A R. Semin Cell Dev Biol. 1999;10:51–58. doi: 10.1006/scdb.1998.0275. [DOI] [PubMed] [Google Scholar]
- 4.Brasaemle D L, Rubin B, Harten I A, Gruia-Gray J, Kimmel A R, Londos C. J Biol Chem. 2000;275:38486–38493. doi: 10.1074/jbc.M007322200. [DOI] [PubMed] [Google Scholar]
- 5.Souza S C, de Vargas L M, Yamamoto M T, Lien P, Franciosa M D, Moss L G, Greenberg A S. J Biol Chem. 1998;273:24665–24669. doi: 10.1074/jbc.273.38.24665. [DOI] [PubMed] [Google Scholar]
- 6.Martinez-Botas J, Anderson J B, Tessier D, Lapillone A, Chang B H J, Quast M J, Forenstein D, Chen K H, Chan L. Nat Genet. 2000;26:474–479. doi: 10.1038/82630. [DOI] [PubMed] [Google Scholar]
- 7.Rodbell M. J Biol Chem. 1964;239:375–380. [PubMed] [Google Scholar]
- 8.Honnor R C, Dhillon G S, Londos C. J Biol Chem. 1985;260:15122–15129. [PubMed] [Google Scholar]
- 9.Bradley D C, Kaslow H R. Anal Biochem. 1989;131:547. doi: 10.1016/0003-2697(89)90081-x. [DOI] [PubMed] [Google Scholar]
- 10.Brasaemle D L, Levin D M, Adler-Wailes D C, Londos C. Biochim Biophys Acta. 1999;1483:251–262. doi: 10.1016/s1388-1981(99)00179-1. [DOI] [PubMed] [Google Scholar]
- 11.Fine J B, Di Girolamo M. Int J Obesity Relat Metab Disord. 1997;21:764–768. doi: 10.1038/sj.ijo.0800469. [DOI] [PubMed] [Google Scholar]
- 12.Brasaemle D L, Barber T, Wolins N E, Serrero G, Blanchette-Mackie E J, Londos C. J Lipid Res. 1997;38:2249–2263. [PubMed] [Google Scholar]
- 13.Shimomura I, Hammer R E, Richardson J A, Ikemoto S, Bashmakov Y, Goldstein J L, Brown M S. Genes Dev. 1998;12:3182–3194. doi: 10.1101/gad.12.20.3182. [DOI] [PMC free article] [PubMed] [Google Scholar]
- 14.Egan J J, Greenberg A S, Chang M K, Wek S A, Moos M C, Jr, Londos C. Proc Natl Acad Sci USA. 1992;89:8537–8541. doi: 10.1073/pnas.89.18.8537. [DOI] [PMC free article] [PubMed] [Google Scholar]
- 15.Honnor R C, Dhillon G S, Londos C. J Biol Chem. 1985;260:15130–15138. [PubMed] [Google Scholar]
- 16.Bergman R N, Mittelman S D. J Basic Clin Physiol Pharmacol. 1998;9:205–221. doi: 10.1515/jbcpp.1998.9.2-4.205. [DOI] [PubMed] [Google Scholar]
- 17.Kleiber R E. The Fire of Life. Huntington, NY: Krieger; 1975. pp. 179–222. [Google Scholar]
- 18.West G B, Brown J H, Enquist B J. Science. 1999;284:1677–1679. doi: 10.1126/science.284.5420.1677. [DOI] [PubMed] [Google Scholar]
- 19.Gavrilova O, Leon L R, Marcus-Samuels B, Mason M M, Castle A L, Refetoff S, Vinson C, Reitman M L. Proc Natl Acad Sci USA. 1999;96:14623–14628. doi: 10.1073/pnas.96.25.14623. [DOI] [PMC free article] [PubMed] [Google Scholar]
- 20.Considine R V, Sinha M K, Heiman M L, Kriauciunas A, Stephens T W, Nyce M R, Ohannesian J P, Marco C C, McKee L J, Bauer T L. N Engl J Med. 1996;334:292–295. doi: 10.1056/NEJM199602013340503. [DOI] [PubMed] [Google Scholar]
- 21.Shimomura I, Hammer R E, Ikemoto S, Brown M S, Goldstein J L. Nature (London) 1999;401:73–76. doi: 10.1038/43448. [DOI] [PubMed] [Google Scholar]
- 22.Gavrilova O, Marcus-Samuels B, Leon L R, Vinson C, Reitman M L. Nature (London) 2000;403:850–851. doi: 10.1038/35002663. [DOI] [PubMed] [Google Scholar]
- 23.Holm C, Osterlund T, Laurell H, Contreras J A. Annu Rev Nutr. 2000;20:365–393. doi: 10.1146/annurev.nutr.20.1.365. [DOI] [PubMed] [Google Scholar]
- 24.Gavrilova O, Marcus-Samuels B, Reitman M L. Diabetes. 2000;49:1910–1916. doi: 10.2337/diabetes.49.11.1910. [DOI] [PubMed] [Google Scholar]
Associated Data
This section collects any data citations, data availability statements, or supplementary materials included in this article.


