

Abstract
Objectives
The goal most often stated by persons with stroke is improved walking function. The purpose of this study was to determine the effects of isokinetic strength training on walking performance, muscle strength, and health-related quality of life in survivors of chronic stroke.
Methods
Twenty participants (age, 61.2 ± 8.4 years) with chronic stroke were randomized into 2 groups. The experimental group undertook maximal concentric isokinetic strength training, whereas the control group received passive range of motion of the paretic lower extremity 3 times a week for 6 weeks. The Kin-Com Isokinetic Dynamometer (Chattanooga Group Inc., TN) was used for both the strengthening and passive range of motion exercises. The Mann-Whitney U test was used to compare the changes in scores (postintervention minus baseline) between the control and experimental groups for a composite lower extremity strength score, walking speed (level-walking and stair-walking) and health-related quality of life measure (36-Item Short Form Health Survey [SF-36]).
Results
Both the experimental and control groups increased their strength and walking speed postintervention; however, there were no differences in the changes in walking speed between the groups. There was a trend (P = .06) toward greater strength improvement in the experimental group compared with the control group. No changes in SF-36 scores were found in either group.
Conclusions
Intervention aimed at increasing strength did not result in improvements in walking. The results of this study stress the importance of controlled clinical trials in determining the effect of specific treatment approaches. Strength training in conjunction with other task-related training may be indicated.
Keywords: Gait, strength, stroke management
Introduction
Improved walking function is the most frequently stated goal by persons with stroke.1 For this reason, gait retraining is an important focus in the rehabilitation of persons with stroke. Despite this effort to regain optimal walking function, only a small percentage (18%–25%) attain a walking speed that is required for community activities.2–4 Possible factors contributing to their difficulties with gait include muscle weakness,5–7 abnormal muscle activation patterns,8 disturbed sensation, impaired postural control, disturbed cognition, and neglect.
A common motor impairment following stroke is muscle weakness.9,10 Characteristics of muscle strength following stroke include a reduction in isometric and isokinetic torque generation,6,9,11 in addition to a slowness to generate torque.10 The ability to generate isometric and isokinetic torque in persons with stroke has been shown to relate to the performance of several functional tasks, such as transfers,12 standing,13 level-walking,5–7 and stair-walking,14 suggesting that strength training could lead to improved functional performance.
In the past, strength testing and training in persons with spasticity have been controversial issues. Bobath15 advocated that decreased muscle strength was not due to weakness but to the opposition of spastic antagonists. In addition, muscle strengthening was not recommended because it was thought to increase spasticity and rein- force abnormal movement.15 Recent studies, however, have shown that strength testing can be done reliably in individuals with spasticity16–18 and that strength training is not associated with increases in spasticity.11,19
Several studies have suggested that lower extremity strength training can improve functional performance in addition to self-perceived health in individuals with stroke.11,20–25 Many of these studies have combined strengthening with other types of training (e.g., balance, endurance); only a few have investigated the functional gains achieved by strength training alone. Six weeks of maximal isokinetic strengthening of the knee musculature has been found to significantly improve walking speed in persons with stroke.11,22 Furthermore, a 9-week bilateral isokinetic program using the Kinetron,25 as well as an 8-week isokinetic strengthening program of isolated flexor and extensor muscle groups of the paretic lower extremity,23 have also been reported to improve walking speed.
The major limitation of these previous studies is the lack of a control group. The reported changes in performance could be attributed to several factors other than strengthening (e.g., joint mobility, familiarization with the testing procedures, maturation effects, or simply the attention from a therapist 2 to 3 times a week).
In the present study, we undertook a double-blind controlled trial in which the control group did not receive treatment other than to minimize the effects of variables that might threaten the internal validity of the study (i.e., factors other than the independent variables that could be related to changes in the dependent variable).26 Apart from the added resistance during movement in the experimental group, the 2 groups followed the same activities (i.e., they both attended the exercise sessions 3 times a week for 6 weeks; they undertook the same warm-up and cool-down routine; and they experienced the same joint mobility through a specified range of motion for 3 sets of 10 repetitions in each joint of the paretic lower limb).
The purpose of this double-blind, controlled pilot study was to determine the effect of 6 weeks of maximal isokinetic strengthening of the paretic lower extremity on (1) lower extremity strength (flexors and extensors of the hip, knee, and ankle), (2) walking speed (level-walking and stair-walking), and (3) health-related quality of life (HRQoL) (as measured by the 36-Item Short Form Health Survey [SF-36]) in persons with chronic stroke.
Methods
The study was approved by the local university’s Research Ethics Board and the hospital Research Advisory and Review Committee.
Design
In a double-blind study, 20 individuals with chronic stroke were randomized to one of two 6-week interventions: (1) maximal isokinetic strengthening (experimental group) and (2) passive range of motion (control group). For group assignment, stratified randomization was undertaken. First, subjects were identified for 2 levels for 3 strata (stratum 1 = sex: male/female; stratum 2=age: 50–59 years/60+ years; stratum 3 = time since onset of stroke: 6 months-2 years/2+ years) that could potentially confound the response to treatment. Then, subjects were randomly assigned such that there were equal numbers of subjects for each level of strata in the experimental and control groups.26,27 Participants were only aware that they were involved in 1 of the 2 different “leg training” programs (subject blinding). One researcher undertook all randomization and stratification procedures and training sessions, whereas another researcher undertook all assessment evaluations without knowledge of the participants’ grouping (researcher blinding).
Participants
Twenty community-dwelling stroke survivors, who had residual unilateral weakness, were recruited on a volunteer basis through community centers, hospitals, and stroke support groups of the surrounding region. The inclusion criteria were as follows: (1) age 50 years or older, (2) history of a single stroke at least 6 months before participating in the study, (3) ability to walk independently for a minimum of 40 meters with rest intervals (required to complete testing procedures) with or without assistive device, (4) achievement of a minimum of stage 3 for the leg and foot on the Chedoke-McMaster Stroke Assessment,28(5) an activity tolerance of 45 minutes with rest intervals, and (6) nonparticipation in any formal therapy program.
Participants were excluded if they (1) had comprehensive aphasia, (2) were not medically stable (i.e., had uncontrolled hypertension, arrhythmia, congestive heart failure, or unstable cardiovascular status), or (3) had significant musculoskeletal problems due to conditions other than stroke. Informed consent was obtained from each participant. Inclusion and exclusion criteria were confirmed before the study by each participant’s physician.
Baseline and Post-intervention Assessments
Measures of lower extremity muscle strength, walking (level-walking and stair-walking) performance, and HRQoL were assessed 2 to 4 days before and 2 to 4 days after the intervention for both groups.
Isokinetic strength of lower extremities
The Kin-Com Isokinetic Dynamometer (Chattanooga Group Inc, Chattanooga, TN) was used to measure the strength of hip flexors/extensors, knee flexors/extensors, and ankle dorsiflexors/plantarflexors bilaterally. These muscle groups were selected because of their important role in walking; Eng and Winter29 reported that the flexion/extension forces of the hip, knee, and ankle accounted for 82% of the total work over a stride as opposed to 15% and 3% in the frontal and transverse planes, respectively. The Kin-Com Isokinetic Dynamometer has been shown to be accurate for position, velocity, and force.30,31 The calibration of the instrument was tested before the study with known weights and was accurate to within ±1 N. All participants had a practice session 2 to 4 days before the actual testing day to reduce the learning effect as recommended by Eng et al.17
An angular velocity of 60°/s was initiated throughout their available range of motion (as assessed by their active range on the paretic side) for the isokinetic strength assessment. This velocity was selected because the majority of our participants had difficulty generating faster movements. If a participant was not able to achieve an angular velocity of 60°/s, 30°/s was used for that specific joint for both limbs during all assessment and exercise sessions.
Average torque was determined for each of the 6 muscle groups. The strength assessment protocol has been described previously and shown to be reliable in persons with stroke with intra-class correlation coefficients greater than 0.85 for average torque values.17
Level-walking performance
Participants were asked to walk wearing their shoes without the use of an orthosis at their “most comfortable speed” (i.e., self-selected speed) for 5 trials and then “safely as fast as possible” (i.e., maximal speed) for another 5 trials using their usual assistive device along an 8-m walkway.
Infrared emitting diodes (IREDs) were attached to the participants’ lateral malleoli and an optoelectronic sensor (Optotrak, Northern Digital 3020, Waterloo, Canada) was used to track the markers. In this camera setup, the error of locating the coordinates of an IRED in space was 0.9 mm in the anterior/posterior direction and 0.45 mm in the up/down direction. Data were collected at 60 Hz. Gait speed was calculated using the distance covered by the markers in the middle 4-m section (i.e., representative window of constant gait speed) of the 8-m walkway and the corresponding elapsed time during each gait cycle. The mean of the 5 trials in meters per second was calculated. Gait speed has been recognized as an indicator of gait performance,32 sensitive enough to reflect physiologic and functional changes,33 and has been shown to be a reliable measure.34
Stair-walking performance
Participants were asked to climb up four 18-cm steps at their “most comfortable speed” (i.e., self-selected speed) employing their usual pattern of foot placement and hand support and then “safely as fast as possible” (i.e., maximum speed). The average time of ascent over 2 trials was calculated for each stair-walking condition and converted to stairs per second. This protocol has been described elsewhere34 and has been shown to be reliable with a reliability coefficient of 0.90 with healthy adults.
Health-related quality of life
HRQoL was measured with the use of the SF-36 physical (Physical Health Component Summary Score [PCS]) and mental (Mental Health Component Summary Score [MCS]) health summary scales.35 Both the SF-36 PCS and MCS have been shown to be reliable in general populations as well as in patient sub-groups with a reliability coefficient (Cronbach’s coefficient alpha) ranging from 0.84 to 0.94.35 The SF-36 survey has also been shown to be a valid measure of physical and mental health after stroke.36
Intervention
Experimental group
The intervention consisted of three 45-minute sessions per week for 6 consecutive weeks for a total of 18 sessions. Each session began with a 5 minute gentle warm-up consisting of 5 repetitions of active alternating flexion and extension of the hip, knee, and ankle sitting in a chair, followed by 5 minutes of mild stretching of the paretic lower extremity. Participants were then seated and positioned in the Kin-Com Isokinetic Dynamometer seat for the isokinetic strengthening exercises. Three sets of 10 repetitions of maximal effort concentric hip flexion/extension, knee flexion/extension, and ankle dorsi-flexion/plantar-flexion of the paretic limb were performed for approximately 30 minutes. Strengthening exercises were done in the same positions, same angular velocities, and through the same range of motion as the assessments. Rest breaks were provided as deemed necessary by the participants. The exercise sessions ended with a 5-minute cool-down consisting of mild stretching exercises. During the training sessions, heart rate and blood pressure were continuously monitored and recorded.
Control group
The control group followed the same intervention as the experimental group (i.e., same warm-up and cool-down) except that the isokinetic strengthening was replaced by passive range of motion with the use of the Kin-Com Isokinetic Dynamometer. The setup on the dynamometer during the passive range of motion exercises was consistent with the assessment protocol (i.e., same positioning, angular velocities, and range of motion). Participants were instructed to relax the limb as it was moved into flexion and extension by the dynamometer. Three sets of 10 repetitions were performed for each joint of the paretic lower extremity, 3 times a week for 6 weeks.
Data Analysis
Descriptive statistics were performed for participants’ characteristics and all outcome measures at baseline and post-intervention for each group. A composite change score of lower extremity strength for the paretic and non-paretic limbs was calculated for each participant. The percent strength change ([a – b]/b where a is the post-intervention torque measure and b is the baseline torque measure) was calculated for each of the 6 muscle groups and then summed to provide an overall composite change score of lower extremity strength for each participant. Percent change for each muscle group, as opposed to absolute change in average torque values, was used to account for differences in relative force-generating capacity of different muscle groups, as well as differences in baseline status between participants. Composite lower extremity strength scores have been reported to be sensitive to muscle strengthening and physical conditioning programs in persons with stroke.24 The Mann-Whitney U test for 2 independent samples was used to compare differences in baseline measures and in change scores between groups for strength, walking speed, and SF-36 (PCS and MCS) scores. A significant level of P < .05 (2-tailed) was selected for all statistical tests.
Results
Baseline Measures
Participant characteristics
Twenty participants, 10 in each group, completed the study. All participants were community ambulators; 3 and 4 participants in the experimental and control groups, respectively, used canes for walking. All participants attended all 18 intervention sessions (make-up sessions were held within the same week of missed sessions in case of statutory holidays) and no participant dropped out from the study. No significant differences (P > .3) in participant demographics (age, time since the onset of stroke, height, mass) were found between the experimental and control groups (Table 1). Levels of resistance to passive movement and recovery stage, as measured by the Ashworth Scale37,38 and the Chedoke-McMaster Stroke Assessment,28 respectively, were also of comparable ranges in the 2 groups (Table 1).
Table 1.
Characteristics of the participants by group (N = 10 per group)
| Experimental
|
Control
|
|||
|---|---|---|---|---|
| Mean | SD | Mean | SD | |
| Age (yr)† | 60.4 | 9.5 | 61.9 | 7.5 |
| Mass (kg)† | 73.0 | 13.2 | 79.5 | 14.3 |
| Height (cm)† | 168.2 | 14.9 | 173.1 | 8.5 |
| Time since stroke (yr)† | 4.9 | 3.3 | 3.2 | 1.2 |
| Type of stroke (ischemic/hemorrhagic/unspecified) | 6/4/0 | 5/3/2 | ||
| Gender (M/F) | 7/3 | 7/3 | ||
| Paretic side (right/left) | 4/6 | 7/3 | ||
| Dominance (right/left) | 9/1 | 8/2 | ||
| Mobility aid (cane/none) | 3/7 | 4/6 | ||
| Chedoke-McMaster‡ (stage range) | 3–6 | 3–6 | ||
| Modified Ashworth Scale*(grade range) | 0–2 | 0–2 | ||
Abbreviation: SD, standard deviation.
Mann-Whitney U test result was not significant (P >.3).
Recovery stage level on the Chedoke-McMaster Stroke Assessment28 for the paretic foot and leg.
Muscle strength, level-walking, stair-walking, and HRQoL
There were no significant differences (P > .05) for any of the baseline torque values, level-walking speed, stair-climbing speed, and SF-36 PCS or MCS scores between the 2 groups (Table 2), indicating a similarity in functional level across groups.
Table 2.
Baseline average torque (Nm/kg) of each muscle group, walking Performance, and SF-36 scores in the experimental and control groups (N = 10 per group)
| Experimental group | Control group | ||
|---|---|---|---|
| Hip extension | Paretic | 0.67 ± 0.46 | 0.87 ± 0.49 |
| Nonparetic | 0.79 ± 0.42 | 0.94 ± 0.32 | |
| Hip flexion | Paretic | 0.45 ± 0.20 | 0.47 ± 0.16 |
| Nonparetic | 0.71 ± 0.28 | 0.75 ± 0.16 | |
| Knee extension | Paretic | 0.45 ± 0.31 | 0.64 ± 0.32 |
| Nonparetic | 1.08 ± 0.36 | 1.27 ± 0.45 | |
| Knee flexion | Paretic | 0.11 ± 0.11 | 0.14 ± 0.13 |
| Nonparetic | 0.48 ± 0.22 | 0.52 ± 0.19 | |
| Ankle plantar-flexion | Paretic | 0.17 ± 0.15 | 0.20 ± 0.14 |
| Nonparetic | 0.96 ± 0.34 | 0.91 ± 0.24 | |
| Ankle dorsi-flexion | Paretic | 0.15 ± 0.15 | 0.15 ± 0.12 |
| Nonparetic | 0.50 ± 0.16 | 0.48 ± 0.09 | |
| Self-selected gait speed (m/s) | 0.45 ± 0.25 | 0.46 ± 0.25 | |
| Maximal gait speed (m/s) | 0.70 ± 0.37 | 0.68 ± 0.34 | |
| Self-selected stair-climbing speed (stairs/s) | 0.65 ± 0.27 | 0.61 ± 0.19 | |
| Maximal stair-climbing speed (stairs/s) | 0.84 ± 0.31 | 0.82 ± 0.21 | |
| SF-36 (physical health) | 38.6 ± 6.7 | 40.6 ± 7.0 | |
| SF-36 (mental health) | 50.1 ± 13.4 | 55.6 ± 7.3 |
Values reported as mean ± 1 standard deviation.
There were no significant (P > .05) differences between groups in baseline measures (comparisons by Mann-Whitney U test).
The joint range of motion used during the isokinetic tests was similar in the 2 groups with means of 54° for the hip, 60° for the knee, and 23° for the ankle. All 20 participants were able to complete the isokinetic strength test at an angular velocity of 60°/s bilaterally at the hip. Six participants (3 participants in each group) could not complete the test at 60°/s at the knee and were tested bilaterally at 30°/s. At the ankle, only 2 participants (1 participant in each group) completed the test at 60°/s, whereas the remaining 18 were tested at 30°/s bilaterally. As expected, torque values were lower on the paretic side compared with the non-paretic side in all participants. Gait speed was slow for both groups (0.45–0.46m/s) compared with reported values for the healthy elderly (1.2–1.5 m/s).39,40
Intervention Effects
Muscle strength
Although both groups showed increases in strength after the intervention, there was a trend for the experimental group to show greater strength improvements than the control group (P = .06) (Table 3). In the experimental group, average torque changes of individual muscle groups for the paretic limb ranged from a low of 7% for the hip extensors to a high of 155% for the ankle dorsi-flexors, whereas in the control group, strength changes were in the range of 1% for the hip extensors to 58% for the ankle plantar-flexors. Figure 1 summarizes mean percentage changes in average torque of each muscle group on the paretic side in the experimental and control groups. Note that on the non-paretic side, changes in strength were only in the range of 1% (knee extensors) to 15% (knee flexors).
Table 3.
Mean change scores in strength, walking performance, and SF-36 for the experimental and control groups (N = 10 per group) and the associated P values for test of differences
| Experimental group | Control group | P value | |
|---|---|---|---|
| Composite scores† of strength | |||
| Paretic | 507 ± 559 | 142 ± 193 | .06 |
| Nonparetic | 57 ± 89 | 22 ± 70 | .41 |
| Self-selected gait speed (m/s) | 0.04 ± 0.13 | 0.09 ± 0.07 | .29 |
| Maximal gait speed (m/s) | 0.05 ± 0.09 | 0.07 ± 0.08 | .65 |
| Self-selected stair-climbing speed (stairs/s) | 0.00 ± 0.12 | 0.08 ± 0.06 | .17 |
| Maximal stair-climbing speed (stairs/s) | 0.03 ± 0.08 | 0.08 ± 0.10 | .26 |
| SF-36 (physical health) | 0.74 ± 7.15 | −0.73 ± 5.81 | .55 |
| SF-36 (mental health) | 1.73 ± 7.34 | −1.07 ± 10.13 | .60 |
Values reported as mean±1 standard deviation.
Comparisons between the experimental and control groups are by Mann-Whitney U test.
Composite scores calculated as the sum of the percent strength change ([post-intervention-baseline]/baseline) of all 6 muscle groups.
Figure 1.
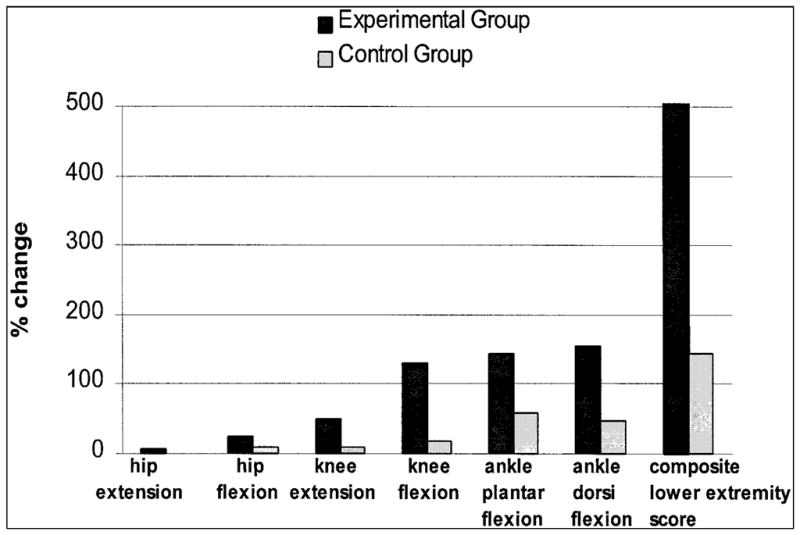
Mean percentage change in average torque (Nm/kg) of each muscle group and for the composite lower extremity score on the paretic side in the experimental and control groups (N = 10 per group) following 6 weeks of training.
Walking performance
For both the experimental and control groups, the mean level-walking and stair-climbing speeds were higher after the intervention than at baseline; however, there were no group differences in change scores of level-walking and stair-climbing speeds (Table 3).
HRQoL
The reported values of both the physical and mental health components of the SF-36 post-intervention remained very close to baseline values in both groups and no significant differences were found in the changes in SF-36 scores between the 2 groups (Table 3).
Discussion
This is the first randomized controlled trial to directly assess the effects of isokinetic strength training in stroke survivors. The main finding of this pilot study was that there was a trend for the experimental group to show greater strength improvements than the control group following 6 weeks of strength training; however, no group differences were found in the changes in walking function or HRQoL in this group of long-term stroke survivors.
Effects of the Intervention on Muscle Strength
This study demonstrated that individuals with chronic stroke can improve the strength of their paretic limb with 6 weeks of maximal isokinetic strength training as reflected by the differences between groups for the lower extremity strength composite score. A composite score was used to compare strength changes of the groups, as it provides a representation of overall lower extremity strength. In fact, although some individual muscle groups for the experimental group showed larger mean changes in strength compared with the control group, further post hoc analyses showed that differences between groups in individual muscle strength changes were not statistically significant, likely because of the small sample size, the large variability in the data, and the small changes per individual muscle groups. It was only when these changes were summated that a trend in differences between groups was observed.
Relative strength improvements found in the present study (up to 155% for some muscles) were higher than the 17% to 54% improvements measured at comparable angular velocities reported in other studies.11,22,23 The greater strength improvements found in this study may reflect the lower baseline strength status of our participants compared with findings of other studies. Our results along with those of others11,22,23 suggest that muscle strength can be improved in stroke survivors following isokinetic strength training.
The control group also showed an increase in post-intervention strength of the paretic limb. For example, the 47% strength change for ankle dorsi-flexors and 58% strength change for ankle plantar-flexors exceeded the learning effects (<10%) reported by Eng et al.17 from test-retest measures of strength. Perhaps the passive range of motion and 5 minutes of stretching exercises had an effect on their ability to generate force. It is possible that 6 weeks of passive lower limb movements enhanced learning of the motor task involved in isokinetic strength testing. Passive movements in acute stroke survivors with no active limb movement have been shown to elicit brain activation patterns that were similar to the patterns seen during active movements in other stroke survivors who were able to actively move their limb.41
Effects of the Intervention on Walking and HRQoL
The strength gained from the training may not have been sufficient to make a difference in walking function in the experimental group relative to the control group. In addition, both groups showed an increase in post-intervention walking speeds, possibly because of the increased activity of traveling to and attending an exercise program 3 times a week. The strength differences between groups may have been a negligible contributing factor to walking speed compared with the overall increased activation of the subjects.
Another reason for the lack of functional improvement may be around the issue of specificity of training. First, although our training protocol considered some of the aspects of the specificity principle (e.g., dynamic, as opposed to static, resistance to simulate movements used in walking), strengthening was not done within the context of a functional task. Training effects may be specific to the movement, velocity, and angles used in the training.42 This is particularly important in short-term training programs when neural factors, rather than muscle mass, are altered as a result of training. Second, practice of functional tasks was not included in the intervention of this study. As the purpose of the study was to assess the effects of strength training, practice of tasks was purposely not included in the intervention. The results, however, suggest that strength training alone may not be effective in improving functional performance. In other words to better perform a task, one may need to not only restore the strength required for a task, but also practice using the restored strength within the context of the task. Recent training studies that have included both strength training and practice of tasks have demonstrated the benefits of this type of program in improving functional abilities in acute43 and chronic20 stroke survivors.
Finally, despite the reported strong correlations between muscle strength of the paretic lower limb and function,6,7 strengthening the paretic leg alone may not be sufficient for functional improvement. Factors other than the strength of the paretic limb, such as balance, sensation, and strength of the non-paretic limb, have also been shown to be associated with functional performance.5,6,14
The lack of change in the HRQoL measures may be due to the relatively high baseline scores reported by our participants, leaving little range for improvement. A sub-analysis of the 8 subscales of the SF-36 also revealed non-significant changes, including the physical functioning scores, which were expected to change the most, given the type of training provided. These results suggest that the SF-36 may not be a sensitive measure of change in perceived quality of life in individuals with chronic stroke.
This is the first double-blind randomized, controlled trial to directly assess the effects of isokinetic strength training of the paretic lower limb in persons with stroke. Although rehabilitation programs generally comprise a variety of treatment approaches (e.g., balance, strengthening, functional movement), this study was an attempt to isolate and quantify the contribution of strength training to walking performance in persons with stroke. The results of this pilot study stress the importance of including a control group in clinical trials. For example, the 11% to 15% increases in gait speed for the experimental group were not found to be significantly different from the control group. However, other studies without a control group have concluded that isokinetic strength training was effective in promoting improvements in gait when the gains were only within 6% to 11%.11,23
Limitations
The major limitation of this pilot study is the small sample size, which affects the generalizability of the findings to the stroke population and reduces the power to detect a difference in change scores between groups. Given that nonparametric power analyses for non-normal distributions are not well established,44 we used parametric statistics to calculate the power to detect an effect size45 based on clinically meaningful changes in gait and stair-climbing ability. The power was only 39%, which suggests that the study was susceptible to a type II error.
Future Directions
Further studies with a larger sample size are needed to confirm the results of this study. In addition, the role of strength training in the acute stage of stroke (i.e., early in rehabilitation) needs to be explored. To better understand the effects of strength training in stroke survivors, research investigating the actual mechanisms of strength gains following a strength training program is indicated. The optimal frequency and duration of strengthening programs need to be defined along with the long-term effects of these programs.
The results of the present study suggest that strength training may need to be done in a task-related manner or in conjunction with the practice of tasks to be of functional benefit. The impact of such training programs on mobility and overall quality of life needs to be further explored with controlled study designs. Recently, there has been increasing evidence suggesting that stroke survivors can show functional improvements even late after their injury.20,24,46,47 If this is the case, it is important to determine the type of intervention strategies that are most effective in maximizing outcome.
Acknowledgments
This study is supported in part by BC Health Research Foundation, Heart and Stroke Foundation of Canada, Canadian Institutes of Health Research (MOP-14318), the University of BC Graduate Fellowship, and the University of BC Rehabilitation Sciences Alumni Jane Hudson Scholarship.
References
- 1.Bohannon RW, Andrews AW, Smith MB. Rehabilitation goals of patients with hemiplegia. Int J Rehabil Res. 1988;11:181–183. [Google Scholar]
- 2.Mizrahi J, Susak Z, Heller L, et al. Variation of time-distance parameters of the stride as related to clinical gait improvement in hemiplegics. Scand J Rehabil Med. 1982;14:133–140. [PubMed] [Google Scholar]
- 3.Perry J, Garrett M, Gronley JK, et al. Classification of walking handicap in the stroke population. Stroke. 1995;26:982–989. doi: 10.1161/01.str.26.6.982. [DOI] [PubMed] [Google Scholar]
- 4.Wade DT, Langton-Hewer R. Functional abilities after stroke: Measurement, natural history, and prognosis. J Neurol Neurosurg Psychiatry. 1987;50:177–182. doi: 10.1136/jnnp.50.2.177. [DOI] [PMC free article] [PubMed] [Google Scholar]
- 5.Bohannon RW. Gait performance of hemiparetic stroke patients: Selected variables. Arch Phys Med Rehabil. 1987;68:777–781. [PubMed] [Google Scholar]
- 6.Nadeau S, Arsenault AB, Gravel D, et al. Analysis of the clinical factors determining natural and maximal gait speeds in adults with a stroke. Am J Phys Med Rehabil. 1999;78:123–130. doi: 10.1097/00002060-199903000-00007. [DOI] [PubMed] [Google Scholar]
- 7.Nakamura R, Watanabe S, Handa T, et al. The relationship between walking speed and muscle strength for knee extension in hemiparetic stroke patients: A follow-up study. Tohoku J Exp Med. 1988;154:111–113. doi: 10.1620/tjem.154.111. [DOI] [PubMed] [Google Scholar]
- 8.Knutsson E, Richards C. Different types of disturbed motor control in gait of hemiparetic patients. Brain. 1979;102:405–430. doi: 10.1093/brain/102.2.405. [DOI] [PubMed] [Google Scholar]
- 9.Andrews AW. Distribution of muscle strength impairments following stroke. Clin Rehabil. 2000;14:79–87. doi: 10.1191/026921500673950113. [DOI] [PubMed] [Google Scholar]
- 10.Canning CG, Ada L, O’Dwyer N. Slowness to develop force contributes to weakness after stroke. Arch Phys Med Rehabil. 1999;80:66–70. doi: 10.1016/s0003-9993(99)90309-x. [DOI] [PubMed] [Google Scholar]
- 11.Sharp SA, Brouwer BJ. Isokinetic strength training of the hemiparetic knee: Effects on function and spasticity. Arch Phys Med Rehabil. 1997;78:1231–1236. doi: 10.1016/s0003-9993(97)90337-3. [DOI] [PubMed] [Google Scholar]
- 12.Bohannon RW. Determinants of transfer capacity in patients with hemiparesis. Physiother Can. 1988;40:236–239. [Google Scholar]
- 13.Bohannon RW. The relationship between static standing capacity and lower limb static strength in hemiparetic stroke patients. Clin Rehabil. 1987;1:287–291. doi: 10.3109/03790798709166195. [DOI] [PubMed] [Google Scholar]
- 14.Bohannon RW, Walsh S. Association of paretic lower extremity muscle strength and standing balance with stair-climbing ability in patients with stroke. J Stroke Cerebrovasc Dis. 1991;1:129–133. doi: 10.1016/S1052-3057(10)80004-7. [DOI] [PubMed] [Google Scholar]
- 15.Bobath B. Adult hemiplegia: Evaluation and treatment. London: Heinemann Medical Books Ltd; 1978. [Google Scholar]
- 16.Bohannon RW, Andrews AW. Interrater reliability of hand-held dynamometry. Phys Ther. 1987;67:931–933. doi: 10.1093/ptj/67.6.931. [DOI] [PubMed] [Google Scholar]
- 17.Eng JJ, Kim CM, MacIntyre DL. Reliability of lower extremity strength measures in persons with chronic stroke. Arch Phys Med Rehabil. 2002;83:322–328. doi: 10.1053/apmr.2002.29622. [DOI] [PMC free article] [PubMed] [Google Scholar]
- 18.Tripp EJ, Harris SR. Test-retest reliability of isokinetic knee extension and flexion torque measurements in persons with spastic hemiparesis. Phys Ther. 1991;71:390–396. doi: 10.1093/ptj/71.5.390. [DOI] [PubMed] [Google Scholar]
- 19.Damiano DL, Vaughan CL, Abel MF. Muscle response to heavy resistance exercise in children with spastic cerebral palsy. Dev Med Child Neurol. 1995;37:731–739. doi: 10.1111/j.1469-8749.1995.tb15019.x. [DOI] [PubMed] [Google Scholar]
- 20.Dean CM, Richards CL, Malouin F. Task-related circuit training improves performance of locomotor tasks in chronic stroke: A randomized, controlled pilot trial. Arch Phys Med Rehabil. 2000;81:409–417. doi: 10.1053/mr.2000.3839. [DOI] [PubMed] [Google Scholar]
- 21.Duncan P, Richards L, Wallace D, et al. A randomized, controlled pilot study of a home-based exercise program for individuals with mild and moderate stroke. Stroke. 1998;29:2055–2060. doi: 10.1161/01.str.29.10.2055. [DOI] [PubMed] [Google Scholar]
- 22.Engardt M, Knutsson E, Jonsson M, et al. Dynamic muscle strength training in stroke patients: Effects on knee extension torque, electromyography activity, and motor function. Arch Phys Med Rehabil. 1995;76:419–425. doi: 10.1016/s0003-9993(95)80570-2. [DOI] [PubMed] [Google Scholar]
- 23.Karimi H. Doctoral dissertation. Queen’s University; Kingston, Ontario, Canada: 1996. Isokinetic strength training and its effect on the biomechanics of gait in subjects with hemiparesis as a result of stroke. [Google Scholar]
- 24.Teixeira-Salmela LF, Olney SJ, Nadeau S, et al. Muscle strengthening and physical conditioning to reduce impairment and disability on chronic stroke survivors. Arch Phys Med Rehabil. 1999;80:211–218. doi: 10.1016/s0003-9993(99)90018-7. [DOI] [PubMed] [Google Scholar]
- 25.Wilder PA, Sykes J. Using an isokinetic exercise machine to improve the gait pattern in a hemiplegic patient. Phys Ther. 1982;62:1291–1295. doi: 10.1093/ptj/62.9.1291. [DOI] [PubMed] [Google Scholar]
- 26.Domholdt E, editor. Physical therapy research: Principles and applications. Philadelphia: W.B. Saunders; 1993. Research problems and questions; p. 48. [Google Scholar]
- 27.Tate DG, Findley T, Jr, Dijkers M, et al. Randomized clinical trials in medical rehabilitation research. Am J Phys Med Rehabil. 1999;78:486–499. doi: 10.1097/00002060-199909000-00016. [DOI] [PubMed] [Google Scholar]
- 28.Gowland C, VanHullenaar S, Torresin W, et al. Chedoke-McMaster Stroke Assessment: Development, validation and administration manual. Hamilton, Ontario, Canada: Chedoke-McMaster Hospitals and McMaster University; 1995. [Google Scholar]
- 29.Eng JJ, Winter DA. Kinetic analysis of the lower limb during walking: What information can be gained from a three-dimensional model? J Biomech. 1995;28:753–758. doi: 10.1016/0021-9290(94)00124-m. [DOI] [PubMed] [Google Scholar]
- 30.Farrell M, Richards JG. Analysis of the reliability and validity of the kinetic communicator exercise device. Med Sci Sports Exerc. 1986;18:44–49. [PubMed] [Google Scholar]
- 31.Mayhew TP, Rothstein JM, Finucane SDG, et al. Performance characteristics of the Kin-Com dynamometer. Phys Ther. 1994;74:1047–1054. doi: 10.1093/ptj/74.11.1047. [DOI] [PubMed] [Google Scholar]
- 32.Andriacchi T, Ogle J, Galante J. Walking speed as a basis for normal and abnormal gait parameters. J Biomech. 1977;10:261–268. doi: 10.1016/0021-9290(77)90049-5. [DOI] [PubMed] [Google Scholar]
- 33.Richards CL, Malouin F, Dumas F, et al. Gait velocity as an outcome measure of locomotor recovery after stroke. In: Craik R, Oatis C, editors. Gait analysis: Theory and applications. St. Louis: Mosby; 1995. pp. 355–364. [Google Scholar]
- 34.Olney SJ, Elkin ND, Lowe PJ, et al. An ambulation profile for clinical gait evaluation. Physiother Can. 1979;31:85–90. [Google Scholar]
- 35.Ware JE, Jr, Kosinski M, Keller SD. SF-36 physical and mental health summary scales: A user’s manual. Boston: The Health Institute, NewEngland Medical Center; 1994. [Google Scholar]
- 36.Anderson C, Laubscher S, Burns R. Validation of the short-form 36 (SF-36) health survey questionnaire among stroke patients. Stroke. 1996;27:1812–1816. doi: 10.1161/01.str.27.10.1812. [DOI] [PubMed] [Google Scholar]
- 37.Ashworth B. Preliminary trial of carisoprodal in multiple sclerosis. Practitioner. 1964;192:540–542. [PubMed] [Google Scholar]
- 38.Bohannon RW, Smith MB. Interrater reliability of a modified Ashworth scale of muscle spasticity. Phys Ther. 1987;67:206–207. doi: 10.1093/ptj/67.2.206. [DOI] [PubMed] [Google Scholar]
- 39.Himann JE, Cunningham DA, Rechnitzer PA, et al. Age-related changes in speed of walking. Med Sci Sports Exerc. 1988;20:161–166. doi: 10.1249/00005768-198820020-00010. [DOI] [PubMed] [Google Scholar]
- 40.Murray MP, Kory R, Clarkson BH. Walking patterns in healthy old men. J Gerontol. 1969;24:169–178. doi: 10.1093/geronj/24.2.169. [DOI] [PubMed] [Google Scholar]
- 41.Nelles G, Spiekermann G, Jueptner M, et al. Reorganization of sensory and motor systems in hemiplegic stroke patients: A positron emission tomography study. Stroke. 1999;30:1510–1516. doi: 10.1161/01.str.30.8.1510. [DOI] [PubMed] [Google Scholar]
- 42.Rutherford OM. Muscular coordination and strength training: Implications for injury rehabilitation. Sports Med. 1988;5:196–202. doi: 10.2165/00007256-198805030-00006. [DOI] [PubMed] [Google Scholar]
- 43.Richards CL, Malouin F, Wood-Dauphinee S, et al. Task-specific physical therapy for optimization of gait recovery in acute stroke patients. Arch Phys Med Rehabil. 1993;74:612–620. doi: 10.1016/0003-9993(93)90159-8. [DOI] [PubMed] [Google Scholar]
- 44.Lesaffre E, Scheys I, Frohlich J, et al. Calculation of power and sample size with bounded outcome scores. Stat Med. 1993;12:1063–1078. doi: 10.1002/sim.4780121106. [DOI] [PubMed] [Google Scholar]
- 45.Cohen J. Statistical power analysis for the behavioral sciences. Mahwah, NJ: Lawrence Erlbaum; 1988. [Google Scholar]
- 46.Rodriguez AA, Black PO, Kile KA, et al. Gait training efficacy using a home-based practice model in chronic hemiplegia. Arch Phys Med Rehabil. 1996;77:801–805. doi: 10.1016/s0003-9993(96)90260-9. [DOI] [PubMed] [Google Scholar]
- 47.Tangeman PT, Bonaitis DA, Williams AK. Rehabilitation and chronic stroke patients: Changes in functional performances. Arch Phys Med Rehabil. 1990;71:876–880. [PubMed] [Google Scholar]