Abstract
Purpose
To investigate that a statistical analysis of Myocardial Blood-Oxygen-Level-Dependent (mBOLD) signal intensities, can lead to the identification and quantification of the ischemic area supplied by the culprit artery.
Materials and Methods
Cardiac BOLD images were acquired in a canine model (n=9) with controllable LCX stenosis at rest and during adenosine infusion on a 1.5T clinical scanner. Statistical distributions of myocardial pixel-intensities derived from BOLD images were used to compute an area metric (Ischemic Extent, IE). True myocardial perfusion was estimated from microsphere analysis. IE was compared against a standard metric (Segment-Intensity-Response, SIR). Additional animals (n=3) were used to investigate the feasibility of the approach for identifying ischemic territories due to LAD stenosis from mBOLD images.
Results
Regression analyses showed that IE and myocardial flow ratio between rest and adenosine infusion (MFR) were exponentially related (R2>0.70, P<0.001, for end-systole and end-diastole), while SIR and MFR were linearly related in end-systole (R2=0.51, P<0.04) and unrelated in end-diastole (R2~0, P=0.91). Receiver-Operating-Characteristic analysis that IE was superior to SIR for detecting critical stenosis (MFR≤2) in end-systole and end-diastole. Feasibility studies on LAD narrowing demonstrated that the proposed approach could also identify oxygenation changes in the LAD territories.
Conclusion
The proposed evaluation of cardiac BOLD MR images offers marked improvement in sensitivity and specificity for detecting critical coronary stenosis at 1.5T compared to the mean segmental intensity approach. Patient studies are now warranted to determine its clinical utility.
Keywords: coronary artery disease, ischemia, BOLD, MRI, cardiac, image analysis
INTRODUCTION
Cardiac Magnetic Resonance (CMR) Blood-Oxygen-Level-Dependent (BOLD) imaging offers an exciting opportunity to directly identify changes in myocardial oxygenation and characterize perfusion abnormalities due to coronary narrowing (1,2). It relies on an endogenous contrast mechanism mediated by the oxygen saturation (%O2) of hemoglobin within the red blood cells (3). CMR BOLD imaging is typically performed with pharmacological agents (adenosine or dipyridamole) to induce vasodilation and consequently hyperemia with minimal change in myocardial oxygen demand (1,2,4). Under healthy conditions, vasodilation increases baseline coronary venous %O2 from 20–30% to 70–80% (5). However, the presence of stenosis limits the coronary venous %O2 from changing markedly during vasodilation, leading to differential venous %O2 between affected and healthy territories of the myocardium. These observations have paved the way for relating changes in myocardial oxygenation with the overriding goal of determining the significance of coronary narrowing with BOLD CMR.
Recent technical advancements have led to significant improvements in image quality (6–9). To date, the evaluation of myocardial BOLD MR signal changes has relied on measuring the relative mean signal intensity changes in segments of interest under rest and pharmacologically induced vasodilation. This paradigm assumes that all pixels within the entire segment are equally affected, which need not be the case since the epicardial coronary artery supplying a given segment is not well defined and can vary among individuals and within a segment (1). Consequently, it lacks the capacity to identify the affected local regions (pixels) within the segments of interest, resulting in a muted signal response between conditions of rest and vasodilation. Thus, it over emphasizes the magnitude of intensity changes over the regional extent of the BOLD effect at rest and vasodilation. These issues may contribute to the reduced sensitivity and specificity reported by a number of studies (1,10–12).
In this work we propose a statistical approach, hereinafter referred to as ARREAS (Area-based biomaRker for chaRactErizing coronAry Stenosis), for evaluating myocardial oxygenation changes with BOLD MRI. The underlying hypothesis is that the size of the ischemic territory, when compared to relative mean signal intensity changes, is a better predictor of critical stenosis (perfusion deficits ≤2:1, (13)). This hypothesis was tested in a canine model with a controllable coronary artery diameter and gold-standard microsphere perfusion analysis.
METHODS
Animal Protocol
Mongrel dogs (n=9) were studied under a protocol approved by the Institutional Animal Care and Usage Committee. A left thoracotomy was performed and catheters were inserted into the descending aorta, the right and left atria and were routed so that they exit the body via the chest cavity. A MR-compatible hydraulic occluder was placed around the LCX artery and a MR-compatible Doppler flow probe was secured distal to the occluder. Subsequently, the ribs, muscle, and subcutaneous layers were closed with sutures and the animals were allowed to recover for 7 days prior to CMR studies. On the day of the imaging studies, dogs were fasted, sedated, intubated, and anesthetized and placed on the scanner table. Animals were ventilated, and ECG, SPO2, ETCO2, invasive BP, and coronary Doppler flow monitoring were re-established. To induce vasodilation, adenosine was infused (0.14 mg/kg/min IV). Hereafter we refer to this state as (pharmacological) stress. LCX stenosis was inflicted by inflating the hydraulic occluder and the extent of LCX stenosis was estimated based onDoppler flow velocities. Following the final CMR studies, animals were euthanized using Euthasol.
Microsphere administration and analysis
To independently characterize blood flow changes under different experimental conditions, microsphere analysis was performed in a manner similar to previous studies (7,8,11,12). Up to five different colors of microspheres were used as part of the study. Briefly, fluorescent microspheres were injected to ascertain perfusion at various points of the imaging study (3 × 10⁶ microspheres or 3 mL of 1 million spheres/ml, Molecular Probes, Invitrogen Inc, Carlsbad, CA). Simultaneously, blood was withdrawn from the aortic catheter for the assessment of blood flow. Uponeuthanization, hearts were removed and sectioned. The left ventricle was dissected free from the thoracic cavity and cut into circumferential (short axis) rings of 8–10 mm thickness. On the basis of localizer images, the short-axis ring closest to the mid-ventricular imaging slice was sectioned into 6 equal circumferential sectors for standard microsphere analysis (14), following appropriate normalizations for sample weight, blood flow, and fluorescence spectra, from which the microcirculatory perfusion values were computed. Segmental perfusion values were summed to obtain total microsphere flow for each slice (15). The ratio of microsphere flow (MFR) between pharmacological stress (hyperemia induced by adenosine) and rest conditions for the whole slice, was computed as
Imaging Protocol
All imaging studies were performed on a clinical 1.5T MRI system (MAGNETOM Espree®, Siemens Healthcare, Germany). Animals were positioned in feet-first right-anterior oblique position and a surface coil was placed over the chest for signal reception.
BOLD IMAGING
Following scout scans, a breath-held 2D short-axis cine BOLD SSFP sequence (8) was prescribed over the mid-ventricle at rest and under adenosine administration (without and with up to two LCX stenoses of varying grade). Scan parameters were: field-of-view=240×142mm2; imaging matrix=116×192; resolution=1.2×1.2×6mm3; readout bandwidth =240 Hz/pixel; flip-angle=90°; TR/TE=6.2/3.1 ms; and temporal resolution=40 ms. No parallel imaging was utilized. Built-in coil normalizations (16) and whole-heart shimming (17) were carried out to ensure signal homogeneity within the myocardium. Following each BOLD acquisition, microspheres (of different colors) were injected to ascertain myocardial blood flow at different physiologic states as described above.
FIRST-PASS PERFUSION IMAGING
First-pass perfusion MRI (matched to the BOLD imaging slice) was performed under adenosine infusion and severe stenosis for visual confirmation of the infliction of severe LCX stenosis. Imaging protocol for first-pass perfusion MRI: Inversion recovery TurboFLASH(18) sequence triggered at mid systole; non-selective 90° BIR4 RF saturation pulse; resolution=1.8×1.8×6mm3; imaging matrix=192×192; TI=130–150 ms; flip angle=10°, TE/TR=1.2/2.5 ms, and readout bandwidth=1000 Hz/pixel.
LATE GADOLINIUM ENHANCEMENT IMAGING
Studies were terminated with late gadolinium enhancement (LGE) scans (matched to the BOLD imaging slice) to rule out infarction. Imaging protocol for LGE MRI: PSIR reconstruction with TurboFLASH readout (19); resolution=1.3×1.3×6mm3; TE/TR=3.9/8.2 ms; TI=200–220 ms; flip angle=25°; readout bandwidth=140 Hz/pixel.
Image Analysis
All BOLD images were analyzed with custom Matlab (The Mathworks, Inc, USA) software developed in our laboratory. End-systolic (ES) and end-diastolic (ED) images were identified, scaled by a factor of 4 to increase the available myocardial surface for processing, and the endocardial and epicardial contours were manually traced. The analysis of BOLD images was first performed for ES and was repeated for ED. The Argus platform (Siemens Medical Healthcare, Germany) was used to compute ejection fractions at rest and stress under different degrees of stenosis.
Affected Fraction (AF) and Ischemic Extent (IE)
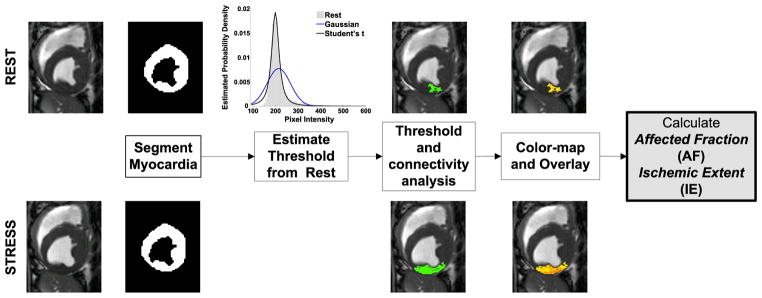
ARREAS detects the affected territory in the rest and stress images (from end-systole or end-diastole) following the determination of a statistically derived threshold obtained from the rest images. Subsequently, by conditioning the affected (hypointense) territory to be contiguous, a case that is in line with expected physiology (5), the method identifies the largest contiguous hypointense territory. Figure 1 showcases the processing steps of ARREAS.
Figure 1.
A flow chart illustrating the steps involved in the ARREAS (Area-based biomaRker for chaRactErizing coronAry Stenosis) approach. The process of estimating the threshold relies only on the rest image. Subsequently, hypointense regions are identified both in rest and stress images and then the largest contiguous hypointense territory is isolated in both images. This region is color-coded and visualized and its relative size (Affected Fraction, AF) is used in the derivation of Ischemic Extent (IE). Above and below each major step, example images from rest and stress studies are shown, respectively, to help illustrate the underlying mechanics of the method.
In line with the standard practice of considering the rest image as the reference in analyzing BOLD images (1,7,8,11), the distribution of pixel intensities in the myocardium of rest images was used to derive a threshold to identify hypointense regions. Motivated by Student’s t robustness to outliers, the pixel-intensity distribution was modeled with a location-scaled Student’s t-distribution. The probability density is defined as follows:
where, x is pixel intensity, A is the location, B is the scale, and υ > 0 is the shape parameter, respectively and Γ(z) is the gamma function defined as . If x follows a t-location-scaled distribution, with the parameters A, B, and υ, then the transformed variable follows a Student’s t-distribution with υ degrees of freedom.
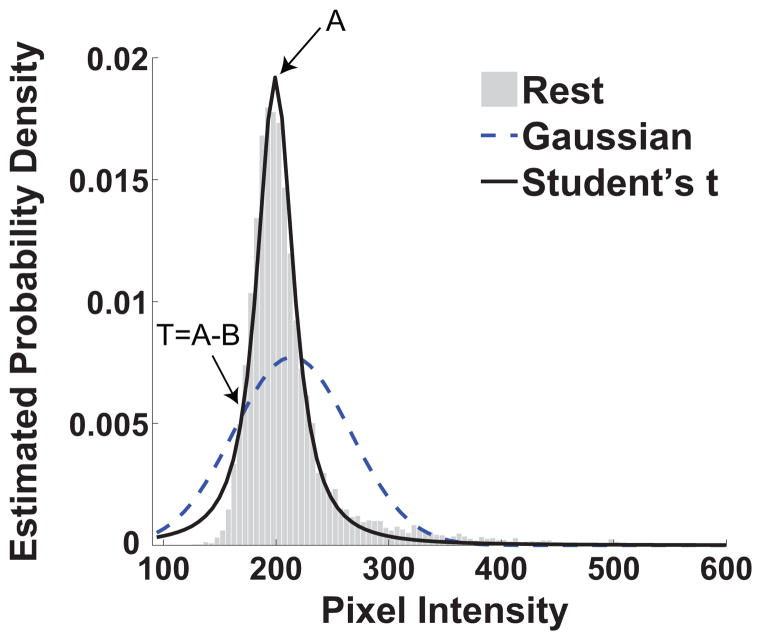
The parameters A, B, and υ of the distribution were determined on the basis of Maximum-Likelihood-Estimation. Using the location (A) and scale (B) parameters of the fitted distribution, the threshold T=A–B was computed and used to threshold both rest and stress images, identifying all pixels within the myocardium having intensity less than T (hypointense territories). An example of a student’s t fit on an estimated density from an image at rest and the computed threshold is shown in Figure 2. Although it is expected that the intensity distribution at such high signal to noise ratios to follow a Gaussian distribution, potential errors in segmentation or other artifacts that act as outliers lead to poor fits (as it can be seen in Figure 2).
Figure 2.
Estimated probability density from a rest image with the corresponding location scaled Student’s t-fit and Gaussian fit are shown. The arrows indicate the location of the value of the scale parameter A (200) and the value of the threshold T (181.2). It is evident that the location scaled Student’s t-distribution fits the data closely particularly in the area of the mode of the empirical histograms.
In a subsequent step, automated connectivity analysis (20) applied to both the rest and stress images, identified the largest contiguous hypointense region in both images. The size of the largest contiguous hypointense territory relative to the size of the myocardium was computed as
AF was computed for images acquired under rest and stress conditions, and was denoted as AFREST and AFSTRESS, respectively. The ratio of the AF between rest and stress conditions, defined as,
allows one to quantify the relative number of pixels affected by regional changes in myocardial oxygenation between rest and pharmacological stress (adenosine infusion) in the presence of stenosis.
To facilitate visualization and remove the demand for manually windowing, ARREAS provided color-overlays of the largest contiguous hypointense regions in images acquired under rest and adenosine infusion conditions. To produce a color-map, black was assigned to the intensity value of zero (no regional BOLD signal variation); bright yellow (significant regional variation in BOLD signal) was assigned to the largest pixel intensity value within the identified hypointense region. Pixel intensity values within this range were assigned yellow/red hues on a linear scale. Once a color-map was established, the pixel values of the identified hypointense region were colored according to this color-map. The remaining pixels of the myocardium and surrounding tissue remained unaltered. The display shown to the user included the images acquired at rest and stress (adenosine conditions), with the hypointense regions color-coded as above, the corresponding pixel intensity color-map and AF values.
Segment-Intensity Response (SIR)
The current paradigm for evaluating BOLD signal changes relies on mean intensities of myocardial segments (1,2,7,8,11). To compare ARREAS with this paradigm, the mid-ventricular images were further segmented into 6 segments per slice according to AHA’s recommendation (21). LCX segments were identified (21) in rest and stress images and their intensities were averaged and normalized by the mean intensity of the entire myocardium. The ratio of the segmental intensities acquired at rest and stress were defined as
where IREST and ISTRESS denote the normalized LCX segmental intensities at rest and stress conditions, respectively. SIR, as defined, is a measure of the relative variation in the mean signal intensity (myocardial oxygenation) of LCX territories (as identified by the standard model (21)) at rest and adenosine infusion.
Statistical Analysis
Regressions were used to assess the correlation between Ischemic Extent (IE) and Segment-Intensity Response (SIR) with Microsphere Flow Ratio (MFR). This process was repeated separately for the ES and ED images. The same microsphere-based values were used at ES and ED since they represent an average flow over a number of cardiac cycles and cannot be used to estimate cardiac phase-dependent perfusion. For IE, both linear and mono-exponential-decay models were regressed. For SIR, only linear models were regressed. For each regression, the R-squared and P-values were obtained to report as goodness-of-fit criteria. Statistical power was calculated using the sample size, R-squared, degrees of freedom, and P-values for each regression. These analyses were performed in MatLab (Mathworks, Nattick, MA).
Regressions between IE, SIR and MFR were repeated using a mixed-model linear regression to test the presence of subject effects. Animals were entered as random effects to account for the repeated study of each animal. These analyses were performed in STATA 10.1 (StataCorp, USA).
Diagnostic quality of each metric for ascertaining critical stenosis was determined with Receiver-Operating-Characteristic (ROC) analysis (22). ROC curves were estimated on the basis that a critical stenosis results in a perfusion deficit of less than 2:1 between stress and rest images (MFR≤2) in the affected territories (13). ROC analysis was performed for IE and SIR using either ES or ED BOLD images. Differences in Area-Under-the-Curve (AUC) measurements were tested using the critical ratio z (23). These analyses were performed using OriginPro (OriginLab, Northampton, MA).
Feasibility Studies on ARREAS Approach for Detecting LAD stenosis
Additional dogs (n=3), instrumented with a hydraulic occluder around the LAD artery, following a similar protocol as above, were used to examine the effects of LAD stenosis. Images were analyzed following the same procedures as above, and AF and IE were estimated as previously described. LAD segments were identified (21) in rest and stress images and their intensities were averaged and normalized by the mean intensity of the entire myocardium to derive the SIR as described previously.
RESULTS
From our studies, BOLD imaging results from 3 distinct physiological states (baseline (n=9), stress without stenosis (n=6), and stress with various grades of LCX stenosis (n=11)) were analyzed. In most cases image quality was satisfactory and inhomogeneity issues were not observed; in one canine, artifacts in diastolic images prohibited analysis of the ED baseline image. Table 1 summarizes the functional changes under different stenosis grades. Table 2 summarizes SNR measurement estimated in remote and affected regions of the myocardium at rest and under adenosine infusion. The mean increase in BOLD signal intensity in the remote myocardium under adenosine relative to rest in the presence of various LCX stenosis grades was 13±2%, indicating that the oxygenation changes in the remote myocardium was unaffected due to LCX stenosis. The mean mass of each sector used as part of the microsphere analysis was 3.1 ± 0.3 g. A paired t-test indicated that there was no statistical difference in myocardial perfusion reserve, calculated as the ratio of microsphere perfusion between stress and rest in remote myocardium, under pre-stenosis (3.01±2) and stenosis conditions (2.9±1.4). First-pass perfusion images acquired during adenosine with severe stenosis confirmed perfusion deficits in the LCX territory. Late-gadolinium-enhancement images acquired at the terminal point of the studies confirmed the absence of infarcts in all studies.
Table 1.
LV functional data and Doppler flow estimates under various grades of LCX stenosis. Values are reported as mean ± standard deviation.
| Stress No stenosis | Moderate Stenosis | Critical Stenosis | |
|---|---|---|---|
| Doppler flow change from rest (%)* | 68.2 ± 19.4 | −20.4 ± 25.1 | −77.1 ± 8.7 |
| Ejection Fraction (%)† | 50.5 ±6.2 | 45±6.8 | 33.6±4.16 |
calculated as X-A/A, where A is Doppler flow at rest, and X is Doppler flow under stress
calculated as VED-VES/VED, where VES is the blood volume in end-systole and VED is the blood volume in end-diastole
Table 2.
Signal to noise ratios (SNR)* measured under various physiological conditions from remote and affected territories. Values are reported as mean ± standard deviation.
| Rest | Adenosine no stenosis | Adenosine with Critical Stenosis | |
|---|---|---|---|
| Remote | 38.5 ± 1.6 | 43.8 ± 1.9 | 44.1 ± 1.3 |
| Affected | 37.5 ± 1.7 | 42.5 ± 1.7 | 36.2 ± 1.6 |
SNR is measured as the average intensity of a region within the territory of interest divided by the standard deviation of the signal in air.
Visualizing the BOLD Effect
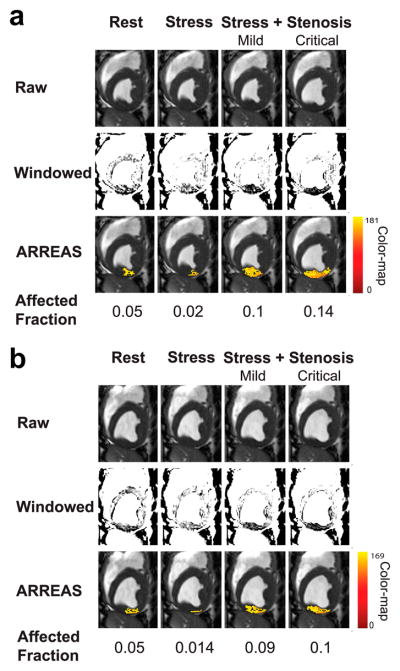
A representative set of raw and manually windowed images obtained under different physiological conditions, along with the corresponding images processed with ARREAS, are shown for ES and ED cases in Figures 3a and 3b, respectively. The myocardial oxygen deficit territories detected by ARREAS in the presence of stenosis correspond to regions of hypointensity that are visible only after careful manual windowing. The images obtained under adenosine infusion (stress) without LCX stenosis had lower AF compared to the rest and stress with stenosis counterparts. This holds for both ES and ED, indicating that under pharmacological stress, the remote (unaffected) myocardium appears hyperintense and fewer pixels are below the automatically determined threshold. This is reflected in the IE scatters of Figure 5(A and C), since at high MFR (stress with no stenosis) the IE values are below 1, thus AFSTRESS < AFREST. Also note that the stenosis grade and AF are directly related, that is, the greater the stenosis grade, the greater the AF and vice versa. This explains the monotonic behavior observed in the IE scatters of Figure 5(A and C).
Figure 3.
Visualization of the BOLD effect in raw, manually windowed, and images processed using ARREAS method obtained from a canine at various physiological states (rest, stress, and stress with LCX stenosis of various grades) are shown for end-systole (a) and end-diastole (b). For each case, the rest and adenosine stress (absence of stenosis, and with mild or critical stenosis) are shown left to right. The top row shows the raw images. The middle row shows the same images after manual windowing, permitting visualization of the affected (LCX) territory as regions of hypointensity. The bottom row shows the raw images that have a color overlay (generated by ARREAS) facilitating the depiction of the affected territory. The pixel intensity color-map is also shown on the right. The corresponding Affected Fraction (AF) values are shown directly below the images. Observe the close correspondence between the automatically detected (colored) regions and the hypointense regions on the windowed images in the LCX territory. The variations of red and yellow hues are consistent with alteration in BOLD signal intensity variations within the affected territory.
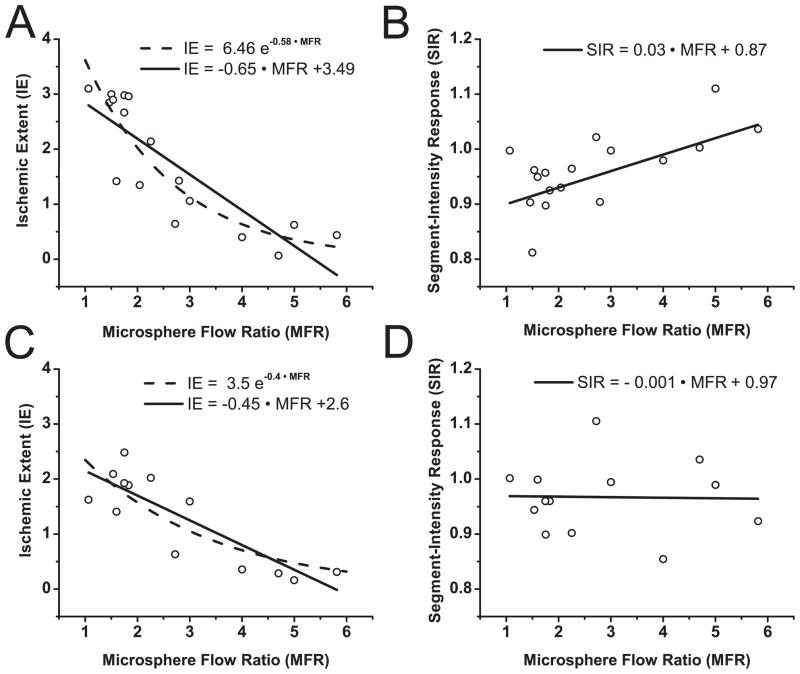
Figure 5.
Ischemic Extent (IE) vs. Microsphere Flow Ratio (MFR) and Segment-Intensity Response (SIR) vs. MFR, derived from BOLD images acquired at end-systole (A and B) and end-diastole (C and D) and microsphere analysis. (A and C) IE vs. MFR; (B and D) SIR vs. MFR. IE values derived from end-systole BOLD images show a stronger correlation to an exponential (R2=0.81) than to a linear function (R2=0.72) of MFR, while SIR shows weaker (linear) correlation with MFR (R2=0.51). IE values derived from end-diastole BOLD images shows an equivalent correlation with exponential and linear functions (R2=0.73) of MFR, while SIR shows no correlation to linear or exponential functions of MFR (R2 ~ 0).
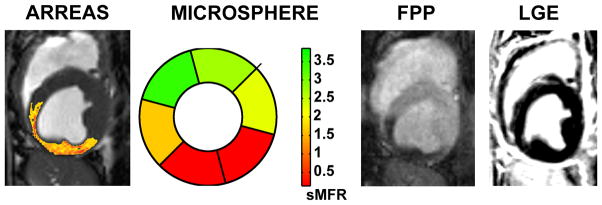
For the representative case in Figure 3, the first-pass image and the corresponding BOLD image processed with the ARREAS method (matched to the trigger time of the first-pass image), obtained under pharmacological stress with critical stenosis, and the late-gadolinium enhancement image (obtained at rest, prior to euthanization) are shown in Figure 4. The segmental microsphere flow ratio is also shown. As evident from the images, both the first-pass perfusion and the ARREAS-processed BOLD images clearly showed perfusion deficit in the LCX territory. This deficit is validated by the reduced segmental microsphere flow ratios. The late-gadolinium enhancement image confirms the absence of infarction.
Figure 4.
Relation between ARREAS processed myocardial BOLD, segmental microsphere flow ratios bull’s eye plot, first-pass perfusion (FPP), and late-gadolinium enhancement (LGE) images. BOLD image (processed with the ARREAS method matched to the trigger time of the first-pass perfusion image), segmental microsphere flow ratios (sMFR) obtained by the ratio of flow between stress and rest for each segment, and first-pass perfusion image obtained under adenosine stress with critical LCX stenosis are shown for comparison. The late-gadolinium enhancement image acquired (at rest, prior to euthanization) at the same slice position and trigger time, confirms the absence of any infarction. Note the close correspondence between the BOLD image processed using ARREAS under the similar physiological conditions, the first-pass perfusion image and the microsphere bull’s eye plot.
Characterizing the BOLD Effect and Validation with Microsphere-based Perfusion Analysis
Referring to Figure 5 and Table 3, the correlation between the Ischemic Extent (IE) computed from ES and ED images and Myocardial Flow Ratios (MFR) obtained from tissue analysis under a range of physiological states was high (Figures 5A and 5C, R2>0.70 for both ES and ED). Note that as MFR increases the stenosis extent decreases (MFR=1 indicates total occlusion). However, a poor correlation was found between Segment-Intensity Response (SIR) and MFR in ES (Figure 5B; R2=0.51) and no correlation was observed at ED (Figure 5D). Statistical power was adequate as reported in Table 3.
Table 3.
Regressions with Microsphere Flow Ratio (MFR) and resulting goodness-of-fit criteria and power analysis
|
Ischemic Extent (IE)
|
Segment-Intensity Response (SIR)
|
|||
|---|---|---|---|---|
| End-Systole | End-Diastole | End-Systole | End-Diastole | |
| Linear | ||||
| Equation§ | IE= −0.65·MFR+3.49 | IE= −0.45·MFR+2.6 | SIR=0.03·MFR+0.87 | SIR= −0.001·MFR+0.97 |
| R2 | 0.72 | 0.73 | 0.51 | ~0 |
| P-value* | <0.0001 | <0.0002 | <0.0036 | 0.91 |
| Powerp-value† | 0.79 | 0.61 | 0.73 | # |
| Powera=0.05‡ | 0.99 | 0.99 | 0.97 | # |
| Exponential | ||||
| Equation§ | IE= 6.46e−0.58·MFR | IE= 3.5e−0.4·MFR | - || | - || |
| R2 | 0.81 | 0.74 | - || | - || |
| P-value* | <0.0001 | <0.0005 | - || | - || |
| Powerp-value† | 0.98 | 0.67 | - || | - || |
| Powera=0.05‡ | 1 | 0.99 | - || | - || |
The resulting equation of regression between the variable IE or SIR and the Microsphere Flow Ratio (MFR).
p-value of the model F-statistic.
Post-hoc observed power for the R2 and p-value listed in the table.
Statistical power for R2 at the significance level of α=0.05.
Hypothesis rejected (P=0.91), therefore power cannot be estimated.
Regressions with exponential mono-decay functions for SIR are not reported (P>0.5).
The within subject test performed together with the mixed-model linear regression (which accounted for the repeated measurements from each animal) rejected the hypothesis of subject effects in all regressions. All linear regression coefficients of the mixed-model were found to be the same as those found using a simple linear regression (Table 3).
Receiver-Operating-Characteristic Analysis
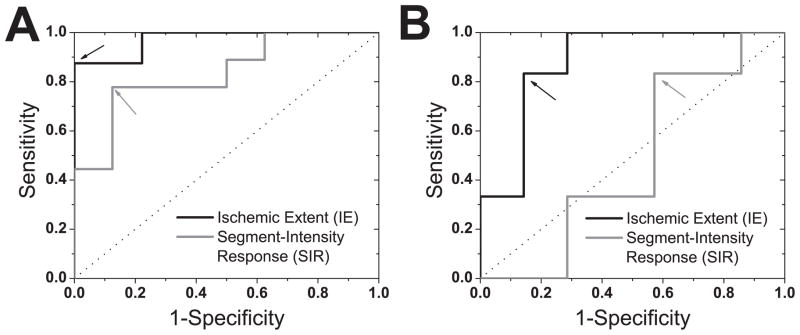
Gold standard microsphere-based perfusion measurements revealed that the infliction of various grades of LCX stenoses led to 8 critical (MFR≤2, true positives) and 9 non-critical (MFR>2, true negatives) perfusion deficits. Receiver-operating-characteristic curves, derived based on these true positives and negatives, are shown in Figure 6 for IE and SIR metrics obtained from ES and ED images. According to Figure 6 and Table 4, IE shows a superior detection sensitivity (87.5%) and specificity (100%) compared to SIR (77% and 87.5%, respectively), particularly in ES.
Figure 6.
Receiver-Operating-Characteristic (ROC) Analysis. ROC curves for Ischemic Extent (IE) and Segment-Intensity Response (SIR) metrics, derived from end-systolic (A) and end-diastolic (B) BOLD images, for detecting critical stenosis (MFR ≤2) are shown. For reference, the line of no discrimination is also shown (dotted line). The similarly colored arrows point to the optimal operating cutoff points for each method (listed in Table 3). IE, derived using ARREAS in ES, shows greater sensitivity and specificity compared to SIR measures.
Table 4.
Specificity, Sensitivity, and Area-Under-the-Curve (AUC) based on ROC analysis for IE and SIR at end-systole and end-diastole.
|
Ischemic Extent (IE)
|
Segment-Intensity Response (SIR)
|
|||
|---|---|---|---|---|
| End-Systole | End-Diastole | End-Systole | End-Diastole | |
| Optimal Cutoff | IE ≥ 2.1 | IE ≥ 1.4 | SIR ≤ 0.93 | SIR ≤ 0.98 |
| AUC/SE* | 0.97/0.03 † | 0.88/0.1‡ | 0.83/0.10† | 0.47/0.17‡ |
| Specificity | 100% | 85.7% | 87.5% | 42.8% |
| Sensitivity | 87.5% | 83.3% | 77% | 83.3% |
AUC: Area-Under-the-Curve/SE: Standard-Error of AUC metric (23).
Statistically significant difference in AUC between IE and SIR (z=1.68; p-value=0.045)
Statistically significant difference in AUC between IE and SIR (z=1.76; p-value=0.0388)
Feasibility Studies on ARREAS Approach for Detecting LAD stenosis
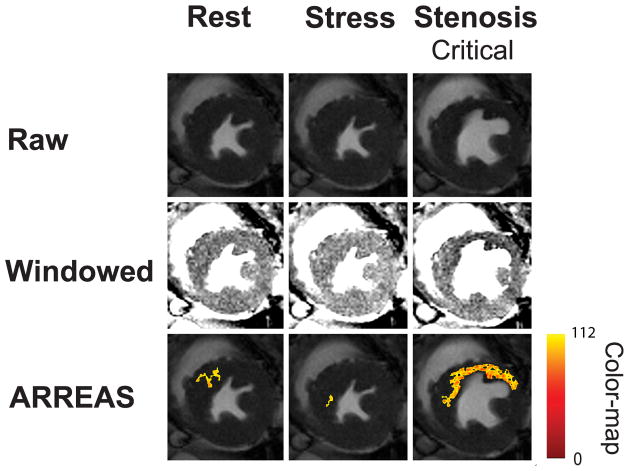
Infliction of severe stenosis under adenosine stress led to a mean reduction in Doppler flow in the LAD artery by 80 ± 9% relative to rest conditions. The mean IE in end systole was 3.82 ± 0.21 under stenosis conditions. The mean SIR computed from the corresponding BOLD images was 0.89 ± 0.02. A representative set of raw and manually windowed images obtained under different physiological conditions from a canine with severe LAD stenosis (under adenosine stress), along with the corresponding images processed with ARREAS, are shown in Figure 7. Comparing the ARREAS images with those that were manually windowed, it is evident that ARREAS can accurately delineate the affected myocardial territory.
Figure 7.
Visualization of the BOLD effect in raw, manually windowed, and images processed using ARREAS approach obtained from a canine at various physiological states (rest, stress, and stress with critical LAD stenosis) at end systole. The top panel shows the raw images. The middle panel shows the same images after they have been manually windowed. Note that myocardial oxygen deficit appears in these images in the affected (LAD) territory as regions of hypointensity. The bottom panel shows the raw images that have a color overlay (generated by ARREAS) permitting automatic depiction of the affected territory. The corresponding Affected Fraction (AF) values are 0.035, 0.002, 0.18, for rest, stress, and critical stenosis conditions. Observe the close correspondence between the automatically detected (colored) and the hypointense regions on the windowed images, particularly in the LAD territory.
DISCUSSION
Myocardial BOLD MRI is a compelling noninvasive image-guided approach for evaluating the alterations in blood oxygen homeostasis in the heart muscle due to coronary artery disease. However, practical limitations in sensitivity and specificity associated with the current methods used to evaluate the BOLD signal changes have been a critical obstacle for seamless clinical translation of this method. Without proper windowing, visualizing the BOLD signal changes are difficult to appreciate. Manual windowing requires significant time (several minutes), is subjective, and can introduce large intra- and inter-observer variability. This work proposed, tested, and validated, ARREAS, a pixel-based statistical approach for visualizing and identifying myocardial territories affected by coronary stenosis with BOLD CMR using a canine model. ARREAS relies on the combination of a statistically derived threshold and connectivity analysis to identify the affected territories. ARREAS (a) significantly increases the sensitivity and specificity for detecting BOLD signal changes compared to the conventional (segmentation) average intensity approach; and (b) offers the ability to quantify such changes on the basis of a metric that reflects the area of the myocardial territory affected by the stenosis. Furthermore, the concept of using an area-based approach can be extended to other imaging strategies (such as T2*, T2w), (1,4,24) given that proper statistical models are defined.
While first-pass images were acquired to visually confirm the myocardial flow deficits due severe LCX stenosis, gold-standard microsphere-based perfusion measurements (MFR) were used for validation. Consistent with the literature, the perfusion between rest and stress states varied in accordance with stenosis extent, between 1 (severe stenosis) to 6 (no stenosis) (13). The results showed that the number of hypointense pixels within the myocardium increased with the severity of stenosis in relation to rest conditions. This indicates that the extent of epicardial narrowing likely affects the supplied territories in a graded fashion; that is, with a greater narrowing of a given epicardial coronary artery, a greater fraction of the corresponding supply territory experiences an alteration in oxygenation.
Ischemic Extent (IE) from ES and ED images correlated strongly with MFR measurements. This demonstrates that SSFP BOLD changes can be characterized with IE in systole and diastole, providing a potential to combine measurements from multiple cardiac phases for increased accuracy. On the other hand, SIR from ED did not correlate well with MFR measurements, suggesting that the conventional method failed to quantify BOLD signal changes from diastolic images obtained using SSFP approaches at 1.5T. These findings indicate that IE, estimated considering both the rest and stress BOLD images (either in systole or diastole), is proportional to the territory of the myocardium that has the propensity to be ischemic when the myocardial demand is increased.
Although other studies (2,4,8,12,25) report higher correlation values and R2, these methods rely on segmental analysis without aggregating the relevant segments to derive a slice-based metric as the SIR utilized here. Note that accounting for repeated measurements did not have any effect on the reported values and in fact no subject effects were found. This is likely attributed to the fact that normalization by AFREST eliminates any subject dependencies. The demonstrated exponential relationship between IE and MFR measurements is in agreement with recent studies suggesting an exponential relationship to exist between SSFP BOLD signal intensities and coronary sinus blood oxygen saturation (24).
Findings from the ROC analysis further support the strengths of the ARREAS method. The diagnostic performance of IE was found to be significantly greater than that of SIR, independent of ES or ED. The AUC of IE was 17% greater than the AUC of SIR (statistically different, p=0.048). The sensitivity and specificity of SIR in ES is in close correspondence with previously employed intensity metrics for evaluating BOLD signal changes (1,8,11,12). In end-diastole, SIR had an AUC<0.5, indicating that in this case, SIR derived from cine BOLD images cannot perform better than a random decision.
There were mild discrepancies between ES and ED for both IE and SIR. This can be attributed to: (i) differences in the myocardial surface available for processing between of ED and ES images; (ii) image artifacts (image ghosts) which may be more pronounced in diastole; and (iii) potential differences in underlying physiology between systole and diastole.
Despite the relatively small number of animals (n=12, 9 for LCX and 3 for LAD), we had an ample sample of 26 LCX and 9 LAD imaging studies and adequate statistical power. Note that our analysis relies on whole-slice-based metrics for IE and SIR and not on individual segments (as per AHA recommendation), as is typically done in other studies (2,4,8,12,25), which can increase the points on the scatter. Given the definition of IE, it is possible that small variations in AFREST (unrelated to the BOLD effect) may influence IE. However, the likelihood of this is minimal and can be remedied by setting a threshold for AFREST. Nevertheless, the use of this normalization has the benefit of increasing robustness to potential imperfections arising from coil bias and field inhomogeneities that are not fully corrected by coil normalization and/or shimming. If present at all, these imperfections are expected to be present in both rest and stress images and their effects may be removed by baseline normalization.
Flow (ghost) artifacts (9) can potentially affect the homogeneity of myocardial intensities. If such imperfections lead to significant intensity variations within the myocardium, they can violate the statistical assumptions made to support the thresholding approach. The Maximum-Likelihood-Estimation procedure can identify such cases since they will have very poor goodness-of-fit (log-likelihood) measurements, which can be used to confirm the presence of image artifacts. Furthermore, these imperfections become readily evident to the reviewer since the method permits the display of images in their raw and color-coded form. Moreover, a more recently proposed flow-compensated SSFP BOLD MRI approach(9) can overcome these artifacts.
In this study we used microsphere based determination of perfusion in lieu of an imaging based assessment of perfusion (such as first pass perfusion imaging). Although microsphere analysis provides only segmental perfusion, it permits one to probe perfusion at the same stenotic conditions at which the BOLD images are acquired, by infusing spheres of different colors. Such repeated studies with first-pass perfusion are not practical. Although recent efforts have shown that first-pass perfusion can permit analysis at the pixel level to quantify perfusion (26), determination of the regional extent of perfusion deficit on this basis remains unclear. Recently, laser scanning methods have been shown to permit quantification of microsphere content in tissue at the pixel level (27). In addition, recent preliminary studies have shown that first-pass perfusion measurements are correlated with microsphere flow measurements at a pixel level (28). Although these methods demonstrate the potential to probe perfusion at a finer resolution, both methods are still experimental and have not received widespread adoption.
This study used a single-slice imaging approach and in a single vessel disease model (LCX, n=9 and LAD, n=3). The method can be extended to multi-slice approaches, given that adequate image quality is provided. Recent improvements in sequence development (9) are expected to provide the necessary image quality for a complete left-ventricular analysis/coverage. Improved approaches such as the one recently reported by Zhou et al (9), when combined with ARREAS could prove to be the most appropriate means for investigating the BOLD effect in other areas of the heart. Although the model was not developed to emulate diffusive hypoperfusion (which can occur in patients with microvascular disease), the algorithm may be adapted to detect such cases, by isolating the two largest contiguous hypointense territories for the determination of affected fraction and the color overlay. Finally, the method remains to be evaluated in cases of multi-vessel narrowing and in patients.
In conclusion, the proposed area-based approach for characterizing myocardial oxygenation anomalies from BOLD CMR images offers significantly improved sensitivity and specificity for detecting critical coronary artery stenosis compared to segmental methods at 1.5T.
Acknowledgments
FUNDING SOURCES: This work was supported by grants from NIH/NHLBI (HL091989) and the American Heart Association (SDG 0735099N).
Footnotes
DISCLOSURES: Drs. Rohan Dharmakumar and Debiao Li hold research grants from the National Institutes of Health/the National Heart, Lung and Blood Institute and receive research support from Siemens Healthcare. Dr. Dharmakumar also holds a research grant from the American Heart Association.
References
- 1.Friedrich MG, Niendorf T, Schulz-Menger J, Gross CM, Dietz R. Blood oxygen level-dependent magnetic resonance imaging in patients with stress-induced angina. Circulation. 2003;108(18):2219–2223. doi: 10.1161/01.CIR.0000095271.08248.EA. [DOI] [PubMed] [Google Scholar]
- 2.Karamitsos TD, Leccisotti L, Arnold JR, et al. Relationship between Regional Myocardial Oxygenation and Perfusion in Patients with Coronary Artery Disease: Insights from Cardiovascular Magnetic Resonance and Positron Emission Tomography. Circulation: Cardiovascular Imaging. 2010;3(1):32–40. doi: 10.1161/CIRCIMAGING.109.860148. [DOI] [PubMed] [Google Scholar]
- 3.Thulborn KR, Waterton JC, Matthews PM, Radda GK. Oxygenation dependence of the transverse relaxation time of water protons in whole blood at high field. Biochim Biophys Acta. 1982;714(2):265–270. doi: 10.1016/0304-4165(82)90333-6. [DOI] [PubMed] [Google Scholar]
- 4.Jahnke C, Gebker R, Manka R, Schnackenburg B, Fleck E, Paetsch I. Navigator-gated 3D blood oxygen level-dependent CMR at 3.0-T for detection of stress-induced myocardial ischemic reactions. JACC Cardiovasc Imaging. 2010;3(4):375–384. doi: 10.1016/j.jcmg.2009.12.008. [DOI] [PubMed] [Google Scholar]
- 5.Dharmakumar R, Li D. Magnetic Resonance Assessment of Myocardial Oxygenation. In: Manning W, Pennell D, editors. Cardiovascular Magnetic Resonance. 2. Saunders/Elsevier; 2010. pp. 569–579. [Google Scholar]
- 6.Foltz WD, Al-Kwifi O, Sussman MS, Stainsby JA, Wright GA. Optimized spiral imaging for measurement of myocardial T2 relaxation. Magn Reson Med. 2003;49(6):1089–1097. doi: 10.1002/mrm.10467. [DOI] [PubMed] [Google Scholar]
- 7.Fieno DS, Shea SM, Li Y, Harris KR, Finn JP, Li D. Myocardial perfusion imaging based on the blood oxygen level-dependent effect using T2-prepared steady-state free-precession magnetic resonance imaging. Circulation. 2004;110(10):1284–1290. doi: 10.1161/01.CIR.0000140673.13057.34. [DOI] [PubMed] [Google Scholar]
- 8.Dharmakumar R, Arumana JM, Larson AC, Chung Y, Wright GA, Li D. Cardiac phase-resolved blood oxygen-sensitive steady-state free precession MRI for evaluating the functional significance of coronary artery stenosis. Invest Radiol. 2007;42(3):180–188. doi: 10.1097/01.rli.0000254407.26068.54. [DOI] [PubMed] [Google Scholar]
- 9.Zhou Z, Tsaftaris SA, Liu Y, et al. Artifact-reduced two-dimensional cine steady state free precession for myocardial blood- oxygen-level-dependent imaging. J Magn Reson Imaging. 2010;31(4):863–871. doi: 10.1002/jmri.22116. [DOI] [PMC free article] [PubMed] [Google Scholar]
- 10.Foltz WD, Huang H, Fort S, Wright GA. Vasodilator response assessment in porcine myocardium with magnetic resonance relaxometry. Circulation. 2002;106(21):2714–2719. doi: 10.1161/01.cir.0000039475.66067.dc. [DOI] [PubMed] [Google Scholar]
- 11.Shea SM, Fieno DS, Schirf BE, et al. T2-prepared steady-state free precession blood oxygen level-dependent MR imaging of myocardial perfusion in a dog stenosis model. Radiology. 2005;236(2):503–509. doi: 10.1148/radiol.2362040149. [DOI] [PubMed] [Google Scholar]
- 12.Dharmakumar R, Arumana J, Tang R, Harris K, Zhang Z, Li D. Assessment of regional myocardial oxygenation changes in the presence of coronary artery stenosis with balanced SSFP imaging at 3.0T: Theory and experimental evaluation in canines. Journal of Magnetic Resonance Imaging. 2008;27(5):1037–1045. doi: 10.1002/jmri.21345. [DOI] [PubMed] [Google Scholar]
- 13.Klocke FJ. Measurements of coronary flow reserve: defining pathophysiology versus making decisions about patient care. Circulation. 1987;76(6):1183–1189. doi: 10.1161/01.cir.76.6.1183. [DOI] [PubMed] [Google Scholar]
- 14.Glenny RW, Bernard S, Brinkley M. Validation of fluorescent-labeled microspheres for measurement of regional organ perfusion. J Appl Physiol. 1993;74(5):2585–2597. doi: 10.1152/jappl.1993.74.5.2585. [DOI] [PubMed] [Google Scholar]
- 15.Wilke N, Jerosch-Herold M, Stillman AE, et al. Concepts of myocardial perfusion imaging in magnetic resonance imaging. Magn Reson Q. 1994;10(4):249–286. [PubMed] [Google Scholar]
- 16.Jellus V, Horger W, Kiefer B. Image Quality Improvement of Composed MR Images by Applying a Modified Homomorphic Filter. MAGNETOM Flash. 2009:180–184. doi: 10.1007/s00330-008-1011-0. [DOI] [PubMed] [Google Scholar]
- 17.Shah S, Kellman P, Greiser A, Weale P, Zuehlsdorff S, Jerecic R. Proc 17th Annual Meeting ISMRM. Honolulu: 2009. Rapid fieldmap estimation for cardiac shimming; p. 565. [Google Scholar]
- 18.Gerber BL, Raman SV, Nayak K, et al. Myocardial first-pass perfusion cardiovascular magnetic resonance: history, theory, and current state of the art. J Cardiovasc Magn Reson. 2008;10:18. doi: 10.1186/1532-429X-10-18. [DOI] [PMC free article] [PubMed] [Google Scholar]
- 19.Kellman P, Arai AE, McVeigh ER, Aletras AH. Phase-sensitive inversion recovery for detecting myocardial infarction using gadolinium-delayed hyperenhancement. Magn Reson Med. 2002;47(2):372–383. doi: 10.1002/mrm.10051. [DOI] [PMC free article] [PubMed] [Google Scholar]
- 20.Haralick R, Shapiro L. Computer and Robot Vision. I. Addison-Wesley Longman Publishing Co., Inc; 1992. pp. 28–48. [Google Scholar]
- 21.Cerqueira MD, Weissman NJ, Dilsizian V, et al. Standardized myocardial segmentation and nomenclature for tomographic imaging of the heart: a statement for healthcare professionals from the Cardiac Imaging Committee of the Council on Clinical Cardiology of the American Heart Association. Circulation. 2002;105(4):539–542. doi: 10.1161/hc0402.102975. [DOI] [PubMed] [Google Scholar]
- 22.Zou KH, O’Malley AJ, Mauri L. Receiver-operating characteristic analysis for evaluating diagnostic tests and predictive models. Circulation. 2007;115(5):654–657. doi: 10.1161/CIRCULATIONAHA.105.594929. [DOI] [PubMed] [Google Scholar]
- 23.Hanley JA, McNeil BJ. A method of comparing the areas under receiver operating characteristic curves derived from the same cases. Radiology. 1983;148(3):839–843. doi: 10.1148/radiology.148.3.6878708. [DOI] [PubMed] [Google Scholar]
- 24.Vohringer M, Flewitt JA, Green JD, et al. Oxygenation-sensitive CMR for assessing vasodilator-induced changes of myocardial oxygenation. J Cardiovasc Magn Reson. 2010;12:20. doi: 10.1186/1532-429X-12-20. [DOI] [PMC free article] [PubMed] [Google Scholar]
- 25.McCommis KS, Goldstein TA, Abendschein DR, et al. Quantification of Regional Myocardial Oxygenation by Magnetic Resonance Imaging: Validation with Positron Emission Tomography. Circulation: Cardiovascular Imaging. 2010;3(1):41–46. doi: 10.1161/CIRCIMAGING.109.897546. [DOI] [PMC free article] [PubMed] [Google Scholar]
- 26.Lee DC, Johnson NP. Quantification of absolute myocardial blood flow by magnetic resonance perfusion imaging. JACC Cardiovasc Imaging. 2009;2(6):761–770. doi: 10.1016/j.jcmg.2009.04.003. [DOI] [PubMed] [Google Scholar]
- 27.Gussakovsky E, Kuzio B, Yang Y, Kupriyanov V. Fluorescence imaging to quantify the fluorescent microspheres in cardiac tissue. J Biophotonics. 2011;4:277–287. doi: 10.1002/jbio.201000057. [DOI] [PubMed] [Google Scholar]
- 28.Hsu L-Y, Groves DW, Kellman P, Aletras AH, Arai AE. Abstract 197: Quantification of Absolute Myocardial Blood Flow With Contrast Enhanced MRI Approaching a Pixel Resolution: Validation vs. Microspheres. Circulation. 2009;120(18_MeetingAbstracts):S299-b. [Google Scholar]


