

Abstract
Background
SCH 727965 is a novel drug in clinical development that potently and selectively inhibits CDK1, CDK2, CDK5, and CDK9. The activity of SCH 727965 was evaluated against the PPTP’s in vitro and in vivo panels.
Procedures
SCH 727965 was tested against the PPTP in vitro panel using 96 hour exposure at concentrations ranging from 0.1 nM to 1.0 μM. It was tested against the PPTP in vivo panels at a dose of 40 mg/kg administered intraperitoneally twice weekly for 2 weeks and repeated at Day 21 with a total observation period of 6 weeks.
Results
The median IC50 value for the cell lines was 7.5 nM, with less than 4-fold range between the minimum (3.4 nM) and maximum (11.2 nM) IC50 values. SCH 727965 demonstrated an activity pattern consistent with cytotoxicity for most of the cell lines. Forty-three xenograft models were studied and SCH 727965 induced significant delays in event free survival distribution compared to control in 23 of 36 (64%) evaluable solid tumor xenografts and in 3 of 7 ALL xenografts. SCH 727965 did not induce objective responses in the solid tumor panels and the best response observed was stable disease for one osteosarcoma xenograft. In the leukemia panel, there were two objective responses with a complete response observed in a single xenograft.
Conclusions
SCH 727965 shows an interesting pattern of activity suggesting its potential applicability against selected childhood cancers, particularly leukemias.
Keywords: Preclinical Testing, Developmental Therapeutics, SCH 727965, Dinaciclib
INTRODUCTION
SCH 727965 (dinaciclib) is a novel pyrazolo[1,5-α]pyrimidine that potently and selectively inhibits CDK1, CDK2, CDK5, and CDK9 [1,2]. A longstanding interest exists in drugs of this class, the cyclin dependent kinase inhibitors as cancer chemotherapy. The cyclin dependent kinases coupled with the various cyclins both regulate and drive cells through the cell cycle. This protein machinery is a complex system with 9 different cyclin dependent kinases (CDK1 – CDK9) and a large number of cyclins that regulates the various cell cycle checkpoints as well as drive the cells through the various processes necessary for cellular proliferation. Uncontrolled proliferation is a hallmark of human cancers, with loss of function of the retinoblastoma (Rb) pathway, which regulates the critical G1 to S transition, occurring in virtually all cancers [3]. Several drugs in this class have been tested in humans, including flavopiridol, SNS-032, seliciclib, and PD 0332991, as well as SCH 727965, the subject of the present study [4]. Clinical trials of the first of these drugs to enter the clinic, flavopiridol, date back to the late 1990s [5,6]. Flavopiridol and drugs of this class generally have modest toxicity and have shown activity as single agents in selected malignancies such as chronic lymphocytic leukemia (CLL) [7–10].
SCH 727965 specifically inhibits CDK1, CDK2, CDK5 and CDK9. In terms of cell cycle regulation cyclin A/CDK1 (also known as cdc2) controls G2, CDK1/cyclin B facilitates mitosis, cyclin E/CDK2 controls entry into S phase, cyclins D1–D3/CDK2 drive progression through G1 and cyclin A/CDK2 controls S-phase progression. Several of the cyclin dependent kinases have non-cell cycle specific effects. CDK5 in partnership with cyclins D, E and G is involved in cellular senescence. CDK9 in partnership with cyclins T and K regulates DNA transcription [4]. CDK2 and CDK9 are overlapping targets between SCH 727965 and flavopiridol while CDK1, and particularly CDK5, appear to be unique, targets of this compound. Dual inhibition of CDK1 and CDK2 may have therapeutic relevance, as CDK2 inhibition alone appears insufficient to block proliferation of some cancer cell lines [11]. On the other hand, flavopiridol targets CDK4 and CDK6, which are not targeted by SCH 727965. Selection of SCH 727965 as a clinical candidate was based upon results of an in vivo functional screen that integrated both efficacy and safety parameters, with SCH 727965 demonstrating superior efficacy and therapeutic index compared to flavopiridol using the A2780 ovarian carcinoma murine xenograft model [1]. SCH 727965 potently inhibits proliferation of and induces apoptosis in a number of adult cancer cell lines. SCH 727965 induces growth inhibition or regression in xenograft models using a variety of administration schedules [1].
Pediatric cancers, in a manner analogous to adult tumors, very frequently have alterations in cell cycle regulation. Based on an interest in cyclin dependent kinases as a therapeutic target, the modest toxicity of this class of chemotherapy, activity against CLL, and the existing preclinical data in adult histotypes, the Pediatric Preclinical Testing Program (PPTP) evaluated this agent to gain some insight into its potential utility in the childhood cancer setting.
MATERIALS AND METHODS
In vitro testing
In vitro testing was performed using DIMSCAN, a semiautomatic fluorescence-based digital image microscopy system that quantifies viable (using fluorescein diacetate [FDA]) cell numbers in tissue culture multiwell plates [12,13]. Cells were incubated in the presence of SCH 727965 for 96 hours at concentrations from 0.1 nM to 1 μM and analyzed as previously described [14]. Absolute IC50 values represent the concentration of SCH 727965 that reduces cell survival to 50% of the control value, while relative IC50 values represent the SCH 727965 concentration that reduces cell survival by 50% of the maximum SCH 727965 effect [15]. Relative In/Out (I/O)% values represent the percentage difference between the Ymin value (the minimum T/C% value) and the estimated starting cell number and either the control cell number (for agents with Ymin > starting cell number) or 0 (for agents with Ymin < estimated starting cell number). Relative I/O% values range between 100% (no treatment effect) and −100% (complete cytotoxic effect), with a Relative I/O% value of 0 being observed for a completely effective cytostatic agent.
In vivo tumor growth inhibition studies
CB17SC-F scid−/− female mice (Taconic Farms, Germantown NY), were used to propagate subcutaneously implanted kidney/rhabdoid tumors, sarcomas (Ewing, osteosarcoma, rhabdomyosarcoma), neuroblastoma, and non-glioblastoma brain tumors, while BALB/c nu/nu mice were used for glioma models, as previously described [16–19]. Human leukemia cells were propagated by intravenous inoculation in female non-obese diabetic (NOD)/scid−/− mice as described previously [20]. Female mice were used irrespective of the patient gender from which the original tumor was derived. All mice were maintained under barrier conditions and experiments were conducted using protocols and conditions approved by the institutional animal care and use committee of the appropriate consortium member. Ten mice (solid tumors) or eight mice (leukemias) were used in each control or treatment group. Tumor volumes (cm3) [solid tumor xenografts] or percentages of human CD45-positive [hCD45] cells [ALL xenografts] were determined as previously described [16] and responses were determined using three activity measures as previously described [16].
Determination of response
Responses were determined using three activity measures as previously described [16]. For individual mice, progressive disease (PD) was defined as < 50% regression from initial volume during the study period and > 25% increase in initial volume at the end of study period. Stable disease (SD) was defined as < 50% regression from initial volume during the study period and ≤ 25% increase in initial volume at the end of the study. Partial response (PR) was defined as a tumor volume regression ≥50% for at least one time point but with measurable tumor (≥0.10 cm3). Complete response (CR) was defined as a disappearance of measurable tumor mass (< 0.10 cm3) for at least one time point. A complete response was considered maintained (MCR) if the tumor volume was <0.10 cm3 at the end of the study period. For treatment groups only, if the tumor response was PD, then PD was further classified into PD1 or PD2 based on the tumor growth delay (TGD) value. TGD values were calculated based on the numbers of days to event. For each individual mouse that had PD and had an event in the treatment groups, a TGD value was calculated by dividing the time to event for that mouse by the median time to event in the respective control group. Median times to event were estimated based on the Kaplan-Meier event-free survival distribution. If a mouse had a TGD value ≤ 1.5, that mouse was considered PD1. If the TGD value was > 1.5, the mouse was considered PD2. Mice that had PD but did not have an event at the end of the study were coded as PD2. An in-depth description of the analysis methods is included in the Supplemental Response Definitions section.
Statistical Methods
The exact log-rank test, as implemented using Proc StatXact for SAS®, was used to compare event-free survival distributions between treatment and control groups. P-values were two-sided and were not adjusted for multiple comparisons given the exploratory nature of the studies.
Drugs and Formulation
SCH 727965 was provided to the Pediatric Preclinical Testing Program by Schering-Plough through the Cancer Therapy Evaluation Program (NCI). SCH 727965 was formulated in 20% hydroxy-propyl-β-cyclodextrin in sterile water, and stored in light-tight containers at 4°C. In vivo SCH 727965 was tested at a dose of 40 mg/kg administered intraperitoneally twice weekly for 2 weeks and repeated at Day 21 with a total observation period of 6 weeks, as suggested by the drug manufacturer. SCH 727965 was provided to each consortium laboratory in coded vials for blinded testing.
RESULTS
In vitro testing
The median SCH 727965 absolute IC50 value for the PPTP cell lines was 7.5 nM, with a less than 4-fold range between the minimum (3.4 nM) and maximum (11.2 nM) IC50 values (Table 1). Most PPTP cell lines showed Ymin values <1%, with Relative I/O values ranging from −60% to −100%. These observations are consistent with near complete cytotoxic activity for SCH 727965 against most of the PPTP cell lines. A metric used to compare the relative responsiveness of the PPTP cell lines to SCH 727965 is the ratio of the median IC50 of the entire panel to that of each cell line. As can be visualized in the graph, there was little variation in IC50 values by cell line panel (Figure 1). Several cell lines showed a distinctive concentration-response curve in which the Ymin value was observed at concentrations of 10 or 30 nM, with higher concentrations producing larger T/C% values (Figure 1B). The significant differences between the T/C% values at lower (10 and 30 nM) and higher (1 μM) concentrations suggest an SCH 727965 effect at the higher concentrations that is protective in short-term cytotoxicity assays for selected cell lines. This phenomenon was primarily observed in the neuroblastoma panel, with 3 of 4 neuroblastoma cell lines showing this pattern of response.
Table I.
Activity of SCH 727965 against cell lines in the PPTP in vitro panel
| Cell Line | Histology | Rel IC50 (nM) | Abs IC50 (nM) | T/C% at 1.0 μM | Ymin (T/C%) | Relative I/O |
|---|---|---|---|---|---|---|
| RD | Rhabdomyosarcoma | 8.2 | 8.6 | 1.1 | 1.1 | −79.7% |
| Rh41 | Rhabdomyosarcoma | 10.5 | 10.8 | 12.6 | 7.8 | −65.0% |
| Rh18 | Rhabdomyosarcoma | 10.5 | 11.2 | 19.1 | 17.7 | −60.4% |
| Rh30 | Rhabdomyosarcoma | 9.0 | 9.3 | 4.4 | 4.3 | −74.2% |
| BT-12 | Rhabdoid | 8.5 | 8.7 | 0.1 | 0.1 | −98.4% |
| CHLA-266 | Rhabdoid | 7.3 | 7.5 | 1.6 | 1.5 | −94.2% |
| TC-71 | Ewing sarcoma | 3.9 | 3.9 | 0.0 | 0.0 | −99.4% |
| CHLA-9 | Ewing sarcoma | 8.0 | 8.1 | 0.2 | 0.2 | −95.3% |
| CHLA-10 | Ewing sarcoma | 6.3 | 6.8 | 0.2 | 0.2 | −97.1% |
| CHLA-258 | Ewing sarcoma | 9.9 | 10.1 | 2.6 | 0.8 | −97.9% |
| GBM2 | Glioblastoma | 6.5 | 7.1 | 3.3 | 2.7 | −72.4% |
| NB-1643 | Neuroblastoma | 3.3 | 3.4 | 13.3 | 6.9 | −67.4% |
| NB-EBc1 | Neuroblastoma | 7.0 | 7.2 | 10.0 | 0.4 | −98.2% |
| CHLA-90 | Neuroblastoma | 7.5 | 7.6 | 0.3 | 0.1 | −99.5% |
| CHLA-136 | Neuroblastoma | 9.8 | 9.7 | 16.1 | 4.2 | −85.3% |
| NALM-6 | ALL | 4.6 | 4.7 | 0.1 | 0.1 | −95.1% |
| COG-LL-317 | ALL | 6.5 | 6.4 | 0.0 | 0.0 | −100.0% |
| RS4;11 | ALL | 5.1 | 5.1 | 1.9 | 0.4 | −97.2% |
| MOLT-4 | ALL | 9.3 | 9.1 | 0.1 | 0.0 | −99.7% |
| CCRF-CEM | ALL | 5.6 | 5.7 | 0.5 | 0.3 | −94.6% |
| Kasumi-1 | AML | 4.5 | 4.6 | 0.0 | 0.0 | −99.9% |
| Karpas-299 | ALCL | 3.9 | 3.9 | 0.0 | 0.0 | −100.0% |
| Ramos-RA1 | NHL | 7.9 | 8.1 | 0.0 | 0.0 | −100.0% |
| Median | 7.3 | 7.5 | 0.52 | 0.34 | −97.1% | |
| Minimum | 3.3 | 3.4 | 0.00 | 0.00 | −100.0% | |
| Maximum | 10.5 | 11.2 | 19.11 | 17.68 | −60.4% |
percentage difference between the Ymin value and the estimated starting cell number and either the control cell number (for agents with Ymin > starting cell number) or 0 (for agents with Ymin < estimated starting cell number).
Figure 1. SCH 727965 in vitro activity.

A. The median EC50 ratio graph shows the relative EC50 values for the cell lines of the PPTP panel. Each bar represents the ratio of the panel EC50 to the EC50 value of the indicated cell line. Bars to the right represent cell lines with higher sensitivity, while bars to the left indicate cell lines with lesser sensitivity. B. Concentration-response curves illustrating the increased survival at higher concentrations that was observed for NB-EBc1 and CHLA-136. The T/C% values at 30 nM and 1 μM were significantly different for each cell line (p<.0001 and p=0.0002, respectively).
In vivo testing
SCH 727965 was evaluated in 43 xenograft models and was well tolerated at the dose and schedule used for in vivo testing. Eighteen of 842 mice died during the study (2.2%), with 0 of 402 in the control arms (0%) and 18 of 414 in the SCH 727965 treatment arms (4.3%). No lines were excluded from analysis secondary to toxicity. A complete summary of results is provided in Supplemental Table I, including total numbers of mice, number of mice that died, numbers of mice with events and average times to event, tumor growth delay, as well as numbers of responses and T/C values.
SCH 727965 induced significant differences in event-free survival (EFS) distribution compared to control in 23 of 36 (64%) evaluable solid tumor xenografts (Table 2). SCH 727965 was also assessed using the PPTP “time to event” activity measure (with “event” defined as a 4-fold increase in tumor volume or more than 25% hCD45 cells out of all leukocytes in peripheral blood for the ALL models). This measure is based on the ratio of the median EFS of treated and control lines (EFS T/C). Intermediate activity requires EFS T/C values > 2, and high activity additionally requires a net reduction in median tumor volume at the end of the experiment. SCH 727965 did not induce high activity in any of 36 solid tumor xenografts evaluable for this measure of activity, while it induced intermediate activity in 7 of the 36 evaluable xenografts (19%), including 1 of 5 Ewing sarcoma xenografts, 4 of 6 rhabdomyosarcoma xenografts, 1 of 2 rhabdoid tumor xenografts, and 1 of 6 neuroblastoma xenografts. For the ALL panel, high activity for the EFS T/C measure was observed for 1 of 7 evaluable xenografts, the B-lineage ALL-17. SCH 727965 did not induce objective responses in the PPTP solid tumor panels. The in vivo testing results for the objective response measure of activity are presented in Figure 2 in a ‘heat-map’ format as well as a ‘COMPARE’-like format, based on the scoring criteria described in the Material and Methods and the Supplemental Response Definitions section. The best response in the solid tumor panel was stable disease (SD) which was observed for the osteosarcoma xenograft OS-1. This response was related in part to the slow growth of tumors in control animals, though treated animals maintained stable tumor volume during the 6-weeks over which treatment was given. PD2 (progressive disease with growth delay) was observed in 15 of 36 xenografts, being most commonly observed in the rhabdomyosarcoma (4 of 6), rhabdoid tumor (2 of 2) and the Ewing sarcoma (3 of 5) tumor panels.
Table II.
Activity for SCH 727965 against the PPTP in vivo xenograft panel
| Xenograft Line | Histology | KM Estimate of Median Time to Event | P-value1 | EFS T/C | Median Final RTV | T/C | P-value2 | T/C Activity | EFS Activity | Response Activity |
|---|---|---|---|---|---|---|---|---|---|---|
| KT-14 | Rhabdoid | 32.6 | <0.001 | 1.7 | >4 | 0.47 | <0.001 | Low | Low | Int |
| KT-12 | Rhabdoid | 34.2 | <0.001 | 3.7 | >4 | 0.34 | <0.001 | Int | Int | Int |
| KT-10 | Wilms | 13 | 0.074 | 1.1 | >4 | 0.8 | 0.633 | Low | Low | Low |
| KT-11 | Wilms | 16 | 0.006 | 1.4 | >4 | 0.43 | 0.007 | Int | Low | Low |
| KT-13 | Wilms | 25.2 | 0.079 | 1.3 | >4 | 0.58 | 0.075 | Low | Low | Low |
| SK-NEP-1 | Ewing | 14.2 | <0.001 | 1.6 | >4 | 0.36 | <0.001 | Int | Low | Int |
| EW5 | Ewing | 10.2 | 0.002 | 1.6 | >4 | 0.71 | 0.005 | Low | Low | Int |
| EW8 | Ewing | 17.6 | <0.001 | 2.7 | >4 | 0.47 | <0.001 | Low | Int | Int |
| TC-71 | Ewing | 11.9 | 0.66 | 1.2 | >4 | 0.95 | 1 | Low | Low | Low |
| CHLA258 | Ewing | 25.1 | 0.442 | 1.2 | >4 | 0.76 | 0.37 | Low | Low | Low |
| Rh10 | ALV RMS | > EP | <0.001 | > 3.0 | >4 | 0.48 | <0.001 | Low | Int | Int |
| Rh28 | ALV RMS | 25 | 0.629 | 1.3 | >4 | 0.7 | 0.436 | Low | Low | Low |
| Rh30 | ALV RMS | 16.6 | 0.011 | 2.4 | >4 | 0.65 | 0.002 | Low | Int | Int |
| Rh30R | ALV RMS | 13.9 | 0.004 | 1.3 | >4 | 0.82 | 0.105 | Low | Low | Low |
| Rh41 | ALV RMS | 19.8 | <0.001 | 2.1 | >4 | 0.74 | 0.015 | Low | Int | Int |
| Rh18 | EMB RMS | 17.8 | <0.001 | 2.6 | >4 | 0.49 | <0.001 | Low | Int | Int |
| BT-28 | Medulloblastoma | 12.3 | 0.021 | 1.4 | >4 | 0.67 | 0.043 | Low | Low | Low |
| BT-45 | Medulloblastoma | 6 | 0.842 | 1.1 | >4 | 0.91 | 0.368 | Low | Low | Low |
| BT-50 | Medulloblastoma | > EP | 0.029 | > 1.7 | 3.4 | 0.75 | 0.105 | Low | NE | Int |
| BT-41 | Ependymoma | > EP | 0.146 | . | 1.3 | 0.56 | 0.01 | Low | NE | Int |
| BT-44 | Ependymoma | 11.9 | 0.661 | 1 | >4 | 1.01 | 0.393 | Low | Low | Low |
| GBM2 | Glioblastoma | 11.2 | 0.038 | 1.2 | >4 | 0.74 | 0.011 | Low | Low | Low |
| BT-39 | Glioblastoma | 14.9 | 0.577 | 1.1 | >4 | 0.83 | 0.481 | Low | Low | Low |
| D645 | Glioblastoma | 13 | 0.039 | 2 | >4 | 0.66 | 0.035 | Low | Low | Int |
| NB-SD | Neuroblastoma | 10.1 | <0.001 | 1.5 | >4 | 0.61 | 0.001 | Low | Low | Low |
| NB-1771 | Neuroblastoma | 16 | 0.815 | 1 | >4 | 1.05 | 0.798 | Low | Low | Low |
| NB-1691 | Neuroblastoma | 8.6 | 0.446 | 1.4 | >4 | 0.8 | 0.36 | Low | Low | Low |
| NB-EBc1 | Neuroblastoma | 12.7 | <0.001 | 2.4 | >4 | 0.49 | <0.001 | Low | Int | Int |
| CHLA-79 | Neuroblastoma | 13.1 | 0.003 | 1.5 | >4 | 0.76 | 0.015 | High | Low | Low |
| NB-1643 | Neuroblastoma | 7.9 | 0.203 | 1.2 | >4 | 0.87 | 0.356 | Low | Low | Low |
| OS-1 | Osteosarcoma | > EP | 0.477 | . | 0.9 | 0.54 | <0.001 | Low | NE | Int |
| OS-2 | Osteosarcoma | 27.5 | <0.001 | 1.5 | >4 | 0.67 | 0.006 | Low | Low | Low |
| OS-17 | Osteosarcoma | 27.5 | <0.001 | 1.7 | >4 | 0.63 | <0.001 | Low | Low | Int |
| OS-9 | Osteosarcoma | 28.2 | 0.02 | 1.3 | >4 | 0.84 | 0.19 | Low | Low | Low |
| OS-33 | Osteosarcoma | 24.4 | <0.001 | 1.2 | >4 | 0.73 | 0.011 | Low | Low | Low |
| OS-31 | Osteosarcoma | 25.9 | <0.001 | 1.8 | >4 | 0.46 | <0.001 | Low | Low | Int |
| ALL-2 | ALL B-precursor | 26.4 | <0.001 | 1.7 | >25 | . | Low | Int | ||
| ALL-4 | ALL B-precursor | 5 | 0.029 | 0.8* | >25 | . | Low | Low | ||
| ALL-7 | ALL B-precursor | 6.7 | 0.561 | 1.2 | >25 | . | Low | Low | ||
| ALL-8 | ALL T-cell | 5 | 0.023 | 0.9* | >25 | . | Low | Low | ||
| ALL-16 | ALL T-cell | > EP | 0.025 | > 1.5 | 1.1 | . | NE | High | ||
| ALL-17 | ALL B-precursor | > EP | <0.001 | > 4.6 | 0.9 | . | High | High | ||
| ALL-19 | ALL B-precursor | 4.3 | 0.189 | 0.7* | >25 | . | Low | Low |
P-value for EFS distribution for treated versus control. In bold are values that demonstrate significant growth delay.
P-value for tumor volume Tumor Volume T/C for treated versus control.
xenografts that showed <1 T/C ratios.
Figure 2. SCH 727965 in vivo objective response activity.

Left: The colored ‘heat map’ depicts group response scores. A high level of activity is indicated by a score of 6 or more, intermediate activity by a score of ≥2 but <6, and low activity by a score of <2. Right: representation of tumor sensitivity based on the difference of individual tumor lines from the midpoint response (stable disease). Bars to the right of the median represent lines that are more sensitive, and to the left are tumor models that are less sensitive. Red bars indicate lines with a significant difference in EFS distribution between treatment and control groups, while blue bars indicate lines for which the EFS distributions were not significantly different.
In the ALL panel, the best response was a complete response (CR), which was observed in a single B cell precursor xenograft (ALL-17) while a T-cell ALL xenograft (ALL-16) attained a partial response (PR). Both of these xenografts showed similar patterns of response, with an initial nadir after completion of the first two weeks of treatment followed by a rebound, and a second nadir following the second two-week treatment course. Relative tumor volume graphs or median CD45% are shown for selected lines in Figure 3. . Examples of tumors with PD1 or PD2 responses are shown in Supplemental Figure 1.
Figure 3. SCH 727965 activity against representative tumor xenografts.

Kaplan-Meier survival proportions graphs (left), median relative tumor volume graphs or hCD45(center) and individual tumor volume or hCD45 (right) are shown for selected lines: (A) EW-8, (B) OS-1, and (C) ALL-17.
Pharmacodynamic studies
Initial studies with an antibody that recognized phosphorylated Rb(Ser807/811) gave a very low signal. Subsequently, this antibody was compared to another phospho-Rb(Ser780) against Rh30 cells treated with SCH727965 in vitro to determine the magnitude of inhibition of pRb (positive control), Figure 4A. Phosphorylation of Rb was decreased ~50% within 4 hours of treatment. We used the pRb(Ser780) antibody to probe for drug induced changes in pRb in Rh10 (moderately sensitive to drug treatment) and Rh28 tumors (poorly sensitive). As shown in Figure 4B there was considerable variability in pRb within tumor samples, with the control level being higher in Rh28 tumors. Thus, for Rh10 xenografts it was difficult to ascertain inhibition of Rb phosphorylation in treated tumors compared to controls, although at 2 hr there is some evidence of inhibition. Similarly, in Rh28 tumors there was some evidence for decreased pRb following treatment, although there was considerable inter-tumor variability. Of note, cleavage of PARP occurred in Rh10 samples from 4 hr onward whereas only a modest signal for cleaved PARP was detected in Rh28 tumors at 24 hr. These data may suggest that the primary target inducing apoptosis is not cyclin dependent kinases responsible for phosphorylation of Rb. Two alternative markers, p27Kio1 and the antiapoptotic protein Mcl1 were also examined (Figure 4C). While levels of p27 and phosphor-p27 were too low to accurately detect in these xenografts, there was a clear decrease in Mcl1 levels. For Rh10 xenografts Mcl1 levels decreased by 2 hr and started to recover at 24 hr after treatment. The drug effect on Rh28 tumors was less marked although there was a consistent decrease in Mcl1 levels between 2 and 8 hrs after drug administration but almost full recovery by 24 hr.
Figure 4. Pharmacodynamic effects of SCH727965.
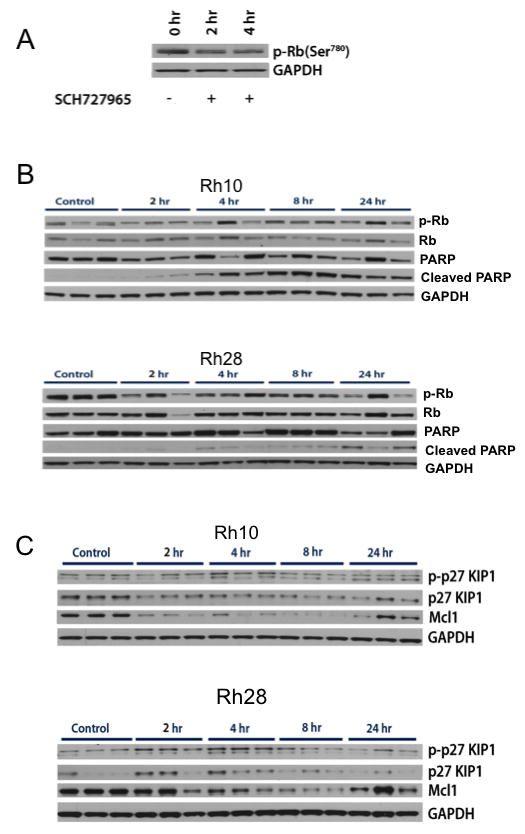
A. Rh30 cells were treated with SCH727965 (100 nM) for 2 or 4 hr, and pRB(Ser780) determined by western blot analysis. B and C Mice bearing Rh10 or Rh28 xenografts received a single dose of SCH727965 (40 mg/kg IP), or vehicle only (Control). Tumors were harvested between 2 and 24 hr after treatment and immunoblots were prepared as described in Materials and Methods. GAPDH was used as a loading control.
DISCUSSION
SCH 727965 demonstrated an in vitro activity pattern consistent with cytotoxic activity for most of the PPTP cell lines. These results are very similar to those observed for SCH 727965 against adult cancer cell lines, for which IC50 values in the 10 nM range were also noted [1]. No histotype specificity in terms of IC50 values was observed for SCH 727965. Preferential activity for SCH 727965 against MYCN-amplified cell lines might have been expected, given prior results showing that silencing of CDK2 by RNA interference methods induced apoptosis in MYCN-amplified neuroblastoma cell lines, but not in MYCN single copy cells [21]. However, the neuroblastoma MYCN-amplified cell lines (CHLA-136 and NB-1643) did not appear more responsive to SCH 727965 than the remaining cell lines lacking MYCN amplification.
SCH 727965 was well tolerated in vivo and induced significant differences in EFS distribution compared to control in 23 of 36 (64%) evaluable solid tumor xenografts. SCH 727965 did not induce objective responses in the PPTP solid tumor panels. The best response in the solid tumor panel was stable disease (SD) which was observed for the osteosarcoma xenograft OS-1. PD2 (progressive disease with growth delay) was observed in 15 of 36 xenografts, being most commonly observed in the rhabdomyosarcoma, rhabdoid tumor and the Ewing sarcoma (3 tumor panels). Preferential activity for SCH 727965 against the MYCN-amplified neuroblastoma xenografts (NB-1643, NB-1691, NB-1771, NB-SD, and NB-1382) was not observed, despite the prior report that CDK2 inactivation is synthetically lethal for MYCN over-expressing cancer cells [21]. In the ALL panel, the best responses were a complete response for a B-precursor ALL xenograft and a partial response for a T-cell xenograft. The rapid recovery of CD45-positive cells between doses of SCH 727965 suggests rather limited cytotoxicity against these leukemia models. The number of in vivo objective responses is disappointing in comparison with the in vitro results showing consistent IC50 values in the nanomolar range, highlighting the limitations of in vitro potency in predicting the presence of in vivo therapeutic windows. The reason(s) for these decrepant results is unclear, although 96 hour constant exposure,albeit at low drug concentration, may exceed the exposure of solid tumors in vivo at the maximum tolerated drug dose in the mouse. The most obvious cytotoxic response to SCH727965 was in the ALL-17 leukemia model. In this model SCH727965 tumor was controlled by the end of the first cycle of drug administration, and 5 mice had recurrence before initiating the second cycle. However, there were no relapses following the second cycle of treatment, although the period of observation was limited to day 42.
We conducted limited pharmacodynamics studies in vitro and in vivo to determine whether drug treatment caused decreased phosphorylation of Rb, consistent with its inhibition of CDK1 and CDK2. In vitro, SCH727965 (100 nM) decreased pRb (~50%) at 2 and 4 hr treatment. In vivo, the pRb signal in control Rh10 xenografts was low, hence it was difficult to detect inhibition of pRb in treated tumors. For Rh28 xenografts, where the pRb signal was stronger, there was a slight inhibition (~50%), in most treated tumors. Interestingly, in Rh10 xenografts that are more sensitive to SCH727965, cleaved PARP was detected in all tumor samples from 4 hr after treatment, in contrast to only a slight increase in the signal for cleaved PARP at 24 hr in Rh28 tumors. These results, modest inhibition of pRb and induction of a marker of apoptosis, suggest that the primary target of SCH727965 may be cyclin dependent kinases not required for Rb phosphorylation in Rh10 tumors. Of note, Mcl1, an anti-apoptotic protein stabilized by CDK1 and CDK2 [22] mediated phosphorylation (Ser64), was markedly decreased in both Rh10 and Rh28 tumor xenografts. The effects were more pronounced in Rh10 xeografts compared to Rh28 tumors, although Mcl1 levels had started to recover by 24 hr after dosing.
The cyclin dependent kinase inhibitors have generally had modest single agent clinical activity against adult solid tumors [4]. Thus, the tumor growth inhibitory effects observed by the PPTP are largely consistent with the adult solid tumor clinical trial results with this class of agents. Flavopiridol has shown its greatest single agent activity against CLL [9], and SCH 727965 has also shown preclinical activity and evidence of clinical activity against CLL [10]. This activity against CLL is thought to reflect inhibition of CDK9 and CDK7, leading to transcriptional inhibition through effects on RNA Pol II and to decreased levels of proteins such as Mcl-1 that have short-lived transcripts and proteins [10,23,24]. In this context, the activity of SCH 727965 against selected ALL xenografts is interesting and mechanism of action studies could provide guidance for development of SCH 727965 in this setting.
There has been considerable interest in combining cyclin dependent kinase inhibitors with other chemotherapeutic agents, an approach supported by preclinical data [25]. For example, adult clinical trial reports have been published for combinations of flavopiridol with cisplatin, carboplatin, docetaxel, vorinostat, gemcitabine, irinotecan and mitoxantrone among other agents [26–32]. Flavopiridol has been tested in pediatric cancer patients, and a similar spectrum of clinical toxicities (particularly diarrhea and neutropenia) was observed in children and adults [33].
Clinical trials with SCH 727965 have thus far been limited in comparison to flavopiridol [4]. SCH 727965 has undergone phase 1 testing both on a weekly and every three week schedule, demonstrating it is well tolerated in adults [10,34,35]. Phase 2 trials for SCH 727965 are focusing on patients with melanoma, CLL, and multiple myeloma. SCH 727965 shows an interesting pattern of tumor growth inhibitory activity in vivo against the PPTP preclinical models, suggesting it may have potential applicability against selected childhood cancer subtypes. It is likely that its ultimate utilization will be in combination with other anticancer agents. The ability of cyclin dependent kinase inhibitors to lower levels of anti-apoptotic proteins such as Mcl-1 may be relevant in considering future studies of SCH 727965, particularly in the setting of agents for which Mcl-1 overexpression is a resistance mechanism (e.g., the Bcl-2 inhibitor ABT-263) [36,37]. Rational combinations with chemotherapy or with other novel agents would be candidates for preclinical stage 2 combination testing by the PPTP, similar to that which has been performed for selected other agents [38].
Supplementary Material
Acknowledgments
This work was supported by NO1-CM-42216, CA21765, and CA108786 from the National Cancer Institute, and SCH 727965 was provided by Schering-Plough. In addition to the authors, the manuscript represents work contributed by the following: Sherry Ansher, Ingrid Boehm, Joshua Courtright, Mila Dolotin, Edward Favours, Henry S. Friedman, Debbie Payne-Turner, Charles Stopford, Chandra Tucker, Jianrong Wu, Joe Zeidner, Ellen Zhang, and Jian Zhang. Children’s Cancer Institute Australia for Medical Research is affiliated with the University of New South Wales and Sydney Children’s Hospital.
Reference List
- 1.Parry D, Guzi T, Shanahan F, et al. Dinaciclib (SCH 727965), a novel and potent cyclin-dependent kinase inhibitor. Molecular cancer therapeutics. 2010;9(8):2344–2353. doi: 10.1158/1535-7163.MCT-10-0324. [DOI] [PubMed] [Google Scholar]
- 2.Paruch K, Dwyer MP, Alvarez C, et al. Discovery of Dinaciclib (SCH 727965): A Potent and Selective Inhibitor of Cyclin-Dependent Kinases. ACS Med Chem Lett. 2010 doi: 10.1021/ml100051d. [DOI] [PMC free article] [PubMed] [Google Scholar]
- 3.Nevins JR. E2F: a link between the Rb tumor suppressor protein and viral oncoproteins. Science. 1992;258(5081):424–429. doi: 10.1126/science.1411535. [DOI] [PubMed] [Google Scholar]
- 4.Dickson MA, Schwartz GK. Development of cell-cycle inhibitors for cancer therapy. Curr Oncol. 2009;16(2):36–43. doi: 10.3747/co.v16i2.428. [DOI] [PMC free article] [PubMed] [Google Scholar]
- 5.Kelland LR. Flavopiridol, the first cyclin-dependent kinase inhibitor to enter the clinic: current status. Expert Opin Investig Drugs. 2000;9(12):2903–2911. doi: 10.1517/13543784.9.12.2903. [DOI] [PubMed] [Google Scholar]
- 6.Senderowicz AM, Headlee D, Stinson SF, et al. Phase I trial of continuous infusion flavopiridol, a novel cyclin-dependent kinase inhibitor, in patients with refractory neoplasms. J Clin Oncol. 1998;16(9):2986–2999. doi: 10.1200/JCO.1998.16.9.2986. [DOI] [PubMed] [Google Scholar]
- 7.Brown JR. Chronic lymphocytic leukemia: a niche for flavopiridol? Clin Cancer Res. 2005;11(11):3971–3973. doi: 10.1158/1078-0432.CCR-05-0831. [DOI] [PubMed] [Google Scholar]
- 8.Christian BA, Grever MR, Byrd JC, et al. Flavopiridol in chronic lymphocytic leukemia: a concise review. Clin Lymphoma Myeloma. 2009;9 (Suppl 3):S179–185. doi: 10.3816/CLM.2009.s.009. [DOI] [PubMed] [Google Scholar]
- 9.Lin TS, Ruppert AS, Johnson AJ, et al. Phase II study of flavopiridol in relapsed chronic lymphocytic leukemia demonstrating high response rates in genetically high-risk disease. J Clin Oncol. 2009;27(35):6012–6018. doi: 10.1200/JCO.2009.22.6944. [DOI] [PMC free article] [PubMed] [Google Scholar]
- 10.Flynn JM, Johnson AJ, Andritsos L, et al. The Cyclin Dependent Kinase Inhibitor SCH 727965 Demonstrates Promising Pre-Clinical and Early Clinical Activity in Chronic Lymphocytic Leukemia. Blood (ASH Annual Meeting Abstracts) 2009;114:Abstr #886. [Google Scholar]
- 11.Tetsu O, McCormick F. Proliferation of cancer cells despite CDK2 inhibition. Cancer cell. 2003;3(3):233–245. doi: 10.1016/s1535-6108(03)00053-9. [DOI] [PubMed] [Google Scholar]
- 12.Frgala T, Kalous O, Proffitt RT, et al. A fluorescence microplate cytotoxicity assay with a 4-log dynamic range that identifies synergistic drug combinations. Molecular cancer therapeutics. 2007;6(3):886–897. doi: 10.1158/1535-7163.MCT-04-0331. [DOI] [PubMed] [Google Scholar]
- 13.Keshelava N, Frgala T, Krejsa J, et al. DIMSCAN: a microcomputer fluorescence-based cytotoxicity assay for preclinical testing of combination chemotherapy. Methods Mol Med. 2005;110:139–153. doi: 10.1385/1-59259-869-2:139. [DOI] [PubMed] [Google Scholar]
- 14.Houghton PJ, Morton CL, Kolb EA, et al. Initial testing (stage 1) of the proteasome inhibitor bortezomib by the pediatric preclinical testing program. Pediatr Blood Cancer. 2007 doi: 10.1002/pbc.21214. [DOI] [PubMed] [Google Scholar]
- 15.Sebaugh JL. Guidelines for accurate EC50/IC50 estimation. Pharmaceut Statist. 2010 doi: 10.1002/pst.426. [DOI] [PubMed] [Google Scholar]
- 16.Houghton PJ, Morton CL, Tucker C, et al. The pediatric preclinical testing program: description of models and early testing results. Pediatr Blood Cancer. 2007;49(7):928–940. doi: 10.1002/pbc.21078. [DOI] [PubMed] [Google Scholar]
- 17.Friedman HS, Colvin OM, Skapek SX, et al. Experimental chemotherapy of human medulloblastoma cell lines and transplantable xenografts with bifunctional alkylating agents. Cancer research. 1988;48(15):4189–4195. [PubMed] [Google Scholar]
- 18.Graham C, Tucker C, Creech J, et al. Evaluation of the antitumor efficacy, pharmacokinetics, and pharmacodynamics of the histone deacetylase inhibitor depsipeptide in childhood cancer models in vivo. Clin Cancer Res. 2006;12(1):223–234. doi: 10.1158/1078-0432.CCR-05-1225. [DOI] [PubMed] [Google Scholar]
- 19.Peterson JK, Tucker C, Favours E, et al. In vivo evaluation of ixabepilone (BMS247550), a novel epothilone B derivative, against pediatric cancer models. Clin Cancer Res. 2005;11(19 Pt 1):6950–6958. doi: 10.1158/1078-0432.CCR-05-0740. [DOI] [PubMed] [Google Scholar]
- 20.Liem NL, Papa RA, Milross CG, et al. Characterization of childhood acute lymphoblastic leukemia xenograft models for the preclinical evaluation of new therapies. Blood. 2004;103(10):3905–3914. doi: 10.1182/blood-2003-08-2911. [DOI] [PubMed] [Google Scholar]
- 21.Molenaar JJ, Ebus ME, Geerts D, et al. Inactivation of CDK2 is synthetically lethal to MYCN over-expressing cancer cells. Proceedings of the National Academy of Sciences of the United States of America. 2009;106(31):12968–12973. doi: 10.1073/pnas.0901418106. [DOI] [PMC free article] [PubMed] [Google Scholar]
- 22.Kobayashi S, Lee SH, Meng XW, et al. Serine 64 phosphorylation enhances the antiapoptotic function of Mcl-1. J Biol Chem. 2007;282(25):18407–18417. doi: 10.1074/jbc.M610010200. [DOI] [PubMed] [Google Scholar]
- 23.Tong WG, Chen R, Plunkett W, et al. Phase I and pharmacologic study of SNS-032, a potent and selective Cdk2, 7, and 9 inhibitor, in patients with advanced chronic lymphocytic leukemia and multiple myeloma. J Clin Oncol. 2010;28(18):3015–3022. doi: 10.1200/JCO.2009.26.1347. [DOI] [PMC free article] [PubMed] [Google Scholar]
- 24.Chen R, Keating MJ, Gandhi V, et al. Transcription inhibition by flavopiridol: mechanism of chronic lymphocytic leukemia cell death. Blood. 2005;106(7):2513–2519. doi: 10.1182/blood-2005-04-1678. [DOI] [PMC free article] [PubMed] [Google Scholar]
- 25.Bible KC, Kaufmann SH. Cytotoxic synergy between flavopiridol (NSC 649890, L86-8275) and various antineoplastic agents: the importance of sequence of administration. Cancer research. 1997;57(16):3375–3380. [PubMed] [Google Scholar]
- 26.Bible KC, Lensing JL, Nelson SA, et al. Phase 1 trial of flavopiridol combined with cisplatin or carboplatin in patients with advanced malignancies with the assessment of pharmacokinetic and pharmacodynamic end points. Clin Cancer Res. 2005;11(16):5935–5941. doi: 10.1158/1078-0432.CCR-04-2566. [DOI] [PubMed] [Google Scholar]
- 27.Carvajal RD, Tse A, Shah MA, et al. A phase II study of flavopiridol (Alvocidib) in combination with docetaxel in refractory, metastatic pancreatic cancer. Pancreatology. 2009;9(4):404–409. doi: 10.1159/000187135. [DOI] [PMC free article] [PubMed] [Google Scholar]
- 28.Dickson MA, Rathkopf DE, Carvajal RD, et al. A phase I pharmacokinetic study of pulse-dose vorinostat with flavopiridol in solid tumors. Invest New Drugs. doi: 10.1007/s10637-010-9447-x. [DOI] [PMC free article] [PubMed] [Google Scholar]
- 29.El-Rayes BF, Gadgeel S, Parchment R, et al. A phase I study of flavopiridol and docetaxel. Invest New Drugs. 2006;24(4):305–310. doi: 10.1007/s10637-005-4343-5. [DOI] [PubMed] [Google Scholar]
- 30.Fekrazad HM, Verschraegen CF, Royce M, et al. A Phase I Study of Flavopiridol in Combination With Gemcitabine and Irinotecan in Patients With Metastatic Cancer. Am J Clin Oncol. 2009 doi: 10.1097/COC.0b013e3181b2043f. [DOI] [PubMed] [Google Scholar]
- 31.Karp JE, Passaniti A, Gojo I, et al. Phase I and pharmacokinetic study of flavopiridol followed by 1-beta-D-arabinofuranosylcytosine and mitoxantrone in relapsed and refractory adult acute leukemias. Clin Cancer Res. 2005;11(23):8403–8412. doi: 10.1158/1078-0432.CCR-05-1201. [DOI] [PubMed] [Google Scholar]
- 32.Shah MA, Kortmansky J, Motwani M, et al. A phase I clinical trial of the sequential combination of irinotecan followed by flavopiridol. Clin Cancer Res. 2005;11(10):3836–3845. doi: 10.1158/1078-0432.CCR-04-2651. [DOI] [PubMed] [Google Scholar]
- 33.Whitlock JA, Krailo M, Reid JM, et al. Phase I clinical and pharmacokinetic study of flavopiridol in children with refractory solid tumors: a Children’s Oncology Group Study. J Clin Oncol. 2005;23(36):9179–9186. doi: 10.1200/JCO.2004.01.0660. [DOI] [PubMed] [Google Scholar]
- 34.Shapiro GI, Bannerji R, Small K, Black S, Statkevich P, Abutarif M, Moseley J, Yao S, Takimoto CH, Mita MM. A phase I dose-escalation study of the safety, pharmacokinetics (PK) and pharmacodynamics (PD) of the novel cyclin-dependent kinase inhibitor SCH 727965 administered every 3 weeks in subjects with advanced malignancies. J Clin Oncol. 2008 May 20;26(suppl):abstr 3532. [Google Scholar]
- 35.Nemunaitis J, Saltzman M, Rosenberg MA, Khaira D, Small K, Kirschmeier P, Statkevich P, Abutarif M, Yao S, Bannerji R. A phase I dose-escalation study of the safety, pharmacokinetics (PK), and pharmacodynamics (PD) of SCH 727965, a novel cyclin-dependent kinase inhibitor, administered weekly in subjects with advanced malignancies. J Clin Oncol. 2009;27(15 suppl):abstr 3535. [Google Scholar]
- 36.Tse C, Shoemaker AR, Adickes J, et al. ABT-263: a potent and orally bioavailable Bcl-2 family inhibitor. Cancer research. 2008;68(9):3421–3428. doi: 10.1158/0008-5472.CAN-07-5836. [DOI] [PubMed] [Google Scholar]
- 37.Yecies D, Carlson NE, Deng J, et al. Acquired resistance to ABT-737 in lymphoma cells that up-regulate MCL-1 and BFL-1. Blood. 2010;115(16):3304–3313. doi: 10.1182/blood-2009-07-233304. [DOI] [PMC free article] [PubMed] [Google Scholar]
- 38.Houghton PJ, Morton CL, Gorlick R, et al. Stage 2 combination testing of rapamycin with cytotoxic agents by the Pediatric Preclinical Testing Program. Molecular cancer therapeutics. 9(1):101–112. doi: 10.1158/1535-7163.MCT-09-0952. [DOI] [PMC free article] [PubMed] [Google Scholar]
Associated Data
This section collects any data citations, data availability statements, or supplementary materials included in this article.