

Abstract
Homologous long segments along the genomes of close or remote relatives that are identical by descent (IBD) from a common ancestor provide clues for recent events in human genetics. We set out to extensively map such IBD segments in large cohorts and investigate their distribution within and across different populations. We report analysis of several data sets, demonstrating that IBD is more common than expected by naïve models of population genetics. We show that the frequency of IBD pairs is population dependent and can be used to cluster individuals into populations, detect a homogeneous subpopulation within a larger cohort, and infer bottleneck events in such a subpopulation. Specifically, we show that Ashkenazi Jewish individuals are all connected through transitive remote family ties evident by sharing of 50 cM IBD to a publicly available data set of less than 400 individuals. We further expose regions where long-range haplotypes are shared significantly more often than elsewhere in the genome, observed across multiple populations, and enriched for common long structural variation. These are inconsistent with recent relatedness and suggest ancient common ancestry, with limited recombination between haplotypes.
Keywords: population genetics, identity by descent, haplotypes, computational tools, structural variations
Introduction
Understanding the identity of alleles across individuals by descent from a common ancestor is central to genetics. The transmission of haploid copies of the genome with almost no mutation from parent to multiple offspring and their descendents gives rise to this identity and facilitates linkage in pedigrees and association mapping in less-related individuals. Generally, two contemporary homologous copies of a locus will differ only at sites of mutations along the respective lineages leading to them from the copy of that genomic region at the locus-specific most recent common ancestor (MRCA). For the average pair of copies, these lineages are thousands of generations long, but relatives may have a very recent MRCA for many loci.
The quantification of identity by descent (IBD) has been extensively studied. Standard assumptions in population genetics postulate that the chances of lineages leading into the past to meet at each generation are inversely proportional to the effective population size, Ne (Fisher 1930; Wright 1931), and under the classical Wright–Fisher model the time from MRCA is geometrically distributed, averaging 2Ne (Tajima 1983). Copies of a locus that are transmitted by a parent to a pair of sibling carriers have a chance of ½ to be IBD, and kth cousins share an IBD locus across any of the four pairs of their respective copies with probability ½2k, a negligibly small number for k = 20 and beyond. However, in the unlikely event that such remote relatives do share an autosomal locus IBD, flanking genomic loci are also likely to be shared, spanning a continuous IBD region to the nearest sites of crossover in any of the meioses from the relatives to their MRCA. Under the assumption of independent recombination events, the genetic length of this region would have an exponential distribution with mean (100 cM)/(k + 1), unless bounded by the end of the chromosome. Across the 22 autosomal chromosomes, which together contain 3,400 cM (Kong et al. 2002), there are on average 22 + (6800/100) × (k + 1) regions with unchanged transmission patterns; each being an opportunity for IBD, (22 + 68 × [k + 1]) × 2−2k, such regions are in fact expected to be IBD. Based on these considerations, relatives can be conveniently partitioned into three broad categories:
Close relatives, hereby defined as avuncular or closer pairs of samples, which share large fractions of their genomes rather than specific segments. Pairs of relatives in this category typically share segments of considerable length (>66.7 cM) along most chromosomes, for a total expected genome-wide sharing of 1,700 cM. Such an abundance of IBD sharing facilitates the inference of relationships through the use of standard metrics such as whole-genome identical by state (IBS) coefficients (e.g., and Z1) (Pritchard et al. 2000). Close relatives constitute a confounding factor for genome-wide association studies, and they should be filtered out during the initial stages of the analysis. Fortunately, estimation of IBS coefficients is efficient and feasible in high-throughput data (Pritchard et al. 2000).
Intermediate relatives, from first cousins to third cousins once removed. Relatives in this category are likely to share multiple regions (>2.5 expected segments) due to the single pair of most recent ancestors defining their relationship. The shared segments are expected to reach the length of >62 cM in total and >25 cM each. Although the length of IBD segments for these individuals facilitates their discovery, standard metrics based on IBS coefficients may fail to detect these relatives, as the total sharing may represent a small fraction of the entire genome, within the noise level of genome-wide IBS statistics in unrelateds.
Remote relatives, whose closest family relationship is fourth cousins or more distant, are very likely to share one or fewer regions through their MRCA. Such pairs include the vast majority of individuals for the average population and are usually referred to as “unrelateds,” because their genome-wide IBD sharing is expected to be extremely limited. Note that, typically, the time k to the MRCA of remote relatives cannot be reliably estimated. When only a single segment is shared any estimator of k may only be based on the length of that segment, which is exponentially distributed with mean and standard deviation proportional to 1/k. Such distributions overlap considerably for different values of k; therefore, length alone is insufficient to estimate this parameter.
Quantifying intermediate and remote relatedness requires more than IBS coefficients. Indeed, previous methods aim at identifying specific IBD regions using a probabilistic model (Pritchard et al. 2000; Browning SR and Browning BL 2010). Such a model generally leverages stretches of IBS that are longer than expected by chance as indicators of putative IBD. Although the chance of seeing such IBD increases quadratically with sample size, these methods require a pairwise comparison of all individuals and are therefore limited to the analysis of small data sets or small genomic regions. Analysis of all genetic relatives (pairs of individuals with genetic evidence for their relationship) had remained a challenge in large or densely related cohorts.
We have developed a method to accurately detect all long shared regions that is computationally efficient and enables rapid processing of whole-genome data from thousands of individuals (Gusev et al. 2009). The method uses a dictionary-based sliding window approach to identify regions of pairwise sharing efficiently and without examining all pairs of individuals. We hereby extend this method to analyze unphased genotype data and report the analysis of such sharing in multiple data sets within and across different populations. Although any genomic region can be considered a patch work of very ancient IBD between two individuals, our focus is on identifying longer and more recent segments that have been inherited contiguously from a single common ancestor. To this end, we show this extension to have high accuracy for segments of 3 cM and longer (mean k of 32, with very high variance). We report remote relatedness to be common within populations, with frequencies of shared segments revealing demography and population history. We further demonstrate the frequency of such shared segments to vary by locus, with specific regions showing increased sharing. We discuss the implication of these detected regions, depleted of cross-haplotype recombinants, and the consistency of potential models of selection with these findings.
For the study, we have applied our methodology to multiple reference panels (Materials and Methods and table 1). Briefly, we analyzed founders from the third generation Human HapMap (HM3), a reference panel collected from multiple world populations; the Intragen Database (Idb) of New York Health Study participants; and samples from the Hebrew University Genetic Resource (HUGR), all typed for genome-wide single nucleotide polymorphism (SNP) arrays. We have scanned each of these data sets for pairs of samples sharing genetic segments 3 cM or longer.
Table 1.
Population and IBD Sharing Summary.
| Data Set | Population | Na | Markers | Closely Related Pairsb | Segmentsc | Pairsd | Total Sharing (cM) | Average Share Length (cM) | P(pair)e (%) | % of Genome Shared |
| HUGR | AJ | 397 | 308,329 | 3 | 940,317 | 76,132 | 5,180,110 | 5.51 | 96.9 | 1.94 |
| Idb | AJ | 389 | 308,330 | 2 | 744,426 | 74,957 | 4,105,410 | 5.52 | 99.3 | 1.60 |
| EU | 514 | 308,330 | 3 | 61,501 | 48,216 | 252,518 | 4.11 | 36.6 | 0.06 | |
| HM3 | ASW | 42 | 1,482,375 | 4 | 670 | 265 | 4,743 | 7.08 | 30.78 | 0.16 |
| CEU | 109 | 1,359,327 | 1 | 28,311 | 5,819 | 106,609 | 3.77 | 98.86 | 0.53 | |
| CHB | 82 | 1,270,434 | 0 | 15,980 | 3,292 | 58,490 | 3.66 | 99.13 | 0.52 | |
| CHD | 70 | 1,230,833 | 2 | 11,532 | 2,390 | 42,239 | 3.66 | 98.96 | 0.51 | |
| GIH | 83 | 1,346,564 | 5 | 23,565 | 3,146 | 100,336 | 4.26 | 92.45 | 0.87 | |
| JPT | 82 | 1,233,871 | 0 | 26,069 | 3,320 | 96,647 | 3.71 | 99.97 | 0.86 | |
| LWK | 83 | 1,454,225 | 11 | 20,843 | 3,377 | 103,747 | 4.98 | 99.24 | 0.90 | |
| MEX | 45 | 1,382,929 | 4 | 9,349 | 984 | 36,160 | 3.87 | 99.39 | 1.07 | |
| MKK | 143 | 1,472,015 | 94 | 47,779 | 9,522 | 410,169 | 8.58 | 93.79 | 1.19 | |
| TSI | 77 | 1,348,828 | 0 | 10,431 | 2,832 | 44,137 | 4.23 | 96.79 | 0.44 | |
| YRI | 108 | 1,431,888 | 2 | 6,019 | 3,659 | 25,249 | 4.19 | 63.33 | 0.13 |
Individuals self-reported as having no relatives in the cohort.
Pairs of individuals defined as avuncular or closer by total IBD sharing and average shared segment length.
Total number of IBD shared segments in entire cohort.
Number of pairs of individuals sharing at least a single IBD segment.
Fraction of pairs of individuals that share any IBD segment.
Materials and Methods
IBD Discovery
The GERMLINE algorithm identifies pairwise IBD shared segments in time proportional to the number of individuals processed (Gusev et al. 2009). Briefly, the algorithm rapidly seeks out short, exact pairwise matches between individuals and then extends from these seeds to long, inexact matches that are indicative of IBD. The published implementation of GERMLINE is intended for fully phased data where it performs with near-perfect accuracy. However, performance can suffer when the data are phased poorly—as can be the case when trio or family data are unavailable. We present improvements to the original IBD discovery algorithm that allow analyzing data of either phase quality with only slight decrease in accuracy.
Haplotype Extension
In order to facilitate analysis of a diverse collection of data sets, it is important to ensure that phasing accuracy does not have a significant effect on the distribution of shared segments. We do this by generalizing the extension step to handle unphased data. Because the GERMLINE algorithm is tolerant of single-marker inaccuracies, we have observed that the phasing error which most commonly results in an IBD false negative is a long-range switch or one that switches the identity of several dozen contiguous markers. To accommodate this, we amend GERMLINE to treat individuals as single units rather than pairs of haplotypes and to allow extension across any permutation of the respective individuals’ haplotypes. By extending a match as long as each word maintains these criteria, we can accommodate the long-range switches.
Genotype Extension
Borrowing a technique from a recent long-range haplotype-phasing algorithm (Kong et al. 2008), we further adjust GERMLINE to process data agnostic of phase. As in (Kong et al. 2008), we define a “consistent” pair of segments to be one where mutually homozygous markers are identical and all heterozygous markers act as wild cards. Likewise, we assume two words that are consistent in this way can be extended until the overall match is unequivocally long (typically 3 cM). As this function effectively looks at the mutually homozygous markers only, the threshold for allowed mismatches must be much lower than that of the haplotype extension approach. The overall GERMLINE algorithm allows a match if it passes either of the extension criteria, though they are permitted to have different mismatch rate parameters.
Extension Accuracy
Synthetic Data
We validate the accuracy of our extension methods on synthetic data sets obtained using the GENOME rapid coalescent-based whole-genome simulator (Liang et al. 2007). We measure the accuracy of GERMLINE’s IBD discovery using standard measures of precision (fraction of discovered segments that correspond to real IBD segments) and recall (fraction of real IBD segments retrieved). A ground-truth set for IBD segments is obtained considering all identical segments in the set of simulated haplotypes. Haplotypes are merged to form synthetic genotypes, discarding phase information. GERMLINE’s haplotype and genotype extensions are tested on both perfectly phased and computationally phased data. Discovered segments of 3 cM or longer are reported. To compute recall GERMLINE’s, IBD discovery is compared with true segments longer than 3 cM. A measure of false-positive segments is computed comparing the obtained IBD matches with segments >1 cM long in the ground-truth set.
We investigate the dependency of GERMLINE’s genotype extension on the population’s demographic parameters measuring the algorithm’s accuracy for a variety of synthetic populations differing in their recent history (supplementary fig. 1, Supplementary Material online). The false-positive percentage exhibits slight fluctuations, with an 8% decrease (37–29%) as the ancestral population size is increased from 1,000 to 10,000 individuals, and a 5% decrease (30–25%) as the time for the bottleneck event increases from 15 to 90 generations before present (gbp). The percentage of entirely invented segments (segments of at least 3 cM that do not overlap any segment of at least 1 cM) is generally minimal, with a mild increase for extremely small ancestral populations and remote bottleneck events. The size of the current population has a negligible effect on all measures. In all testing scenarios, GERMLINE is run on a synthetic data set, where the studied demographic parameter is varied over a common population model of 3,000 diploid individuals sampled from a population of 20,000 individuals, expanded from 5,000 founders in 30 generations. The size of an linkage disequilibrium (LD) block is set to 80 Kb, and a mutation rate of 2 × 10⁻⁸ is adopted.
We evaluate the differences between the haplotype and the genotype extensions of the GERMLINE algorithm. Supplementary figure 2B, Supplementary Material online shows the performance of the haplotype extension on perfectly phased data as the minimum length threshold for a reported IBD segment ranges from 3 to 25 cM (the ground truth length threshold ranging from 1 to 23 cM). The algorithm allows a matching segment to be extended through any combination of the individuals’ chromosome pairs, introducing a false-positive rate of 5–10%, whereas recall is kept close to 100%. False positives moderately increase as short segments are not considered. This result may be an artifact due to the proximity of reported segments to the boundary of chromosomes, where long segments are not reported in the ground-truth set. The haplotype extension was run on computationally phased data (supplementary fig. 2D, Supplementary Material online, phased using the BEAGLE Genetic Analysis Software Package (Browning BL and Browning SR 2009)). Although the false-positive rate remains comparable to the perfect-phase scenario, the recall rate drastically drops for long haplotypes due to long-range phasing errors. When the phase agnostic genotype extension is used (supplementary fig. 2A, Supplementary Material online), the recall is maintained close to 100% while the false-positive rate grows. The performance of the genotype extension remains unchanged when perfectly phased data are used (supplementary fig. 2C, Supplementary Material online), demonstrating the robustness of this approach to phasing accuracy. We emphasize that although the false-positive rate can be high for shorter segments, it is consistent across many different population models, even when the overall abundance of IBD in these cohorts varies significantly. We have experimented with removing the shorter segments entirely but observe that this would also eliminate a substantial amount of true and useful IBD sharing. In light of this, we restrict our analysis to relative comparisons between populations typed on the same platforms and with simulation data that exhibit the same false-positive consistency. Although the traditional haplotype extension mode may be less prone to false positives (supplementary fig. 2B and D, Supplementary Material online), it is entirely dependent on the quality of phasing which can introduce significance data-source biases.
Real Data and Comparison with Current Methods
We further validate our extension methods in a realistic scenario and compare the algorithm’s accuracy with current methodologies for IBD discovery. To this end, we plant simulated instances of pairwise IBD segments of varying length and with realistic genotyping error onto real background genotype sequences from the HapMap CEU cohort. To examine the impact of phasing on accuracy, we also simulated a child for each pair of individuals and phased the data using the trio-phasing and singleton-phasing options of the BEAGLE Genetic Analysis Software Package (Browning BL and Browning SR 2009). We compare the performance of these two approaches with GERMLINE as well as a standard Hidden Markov Model (HMM)-based approach that depends only on genotypes (Purcell et al. 2007).
Supplementary figure 3, Supplementary Material online shows the relative accuracies according to three figures of merit: 1) true positive percentage—the average percent length of the recovered true IBD segment; 2) true positive segments—the number of IBD segments recovered (defined as overlapping the true segment); and 3) false positive (flanking)—the amount (in cM) of falsely identified IBD sharing that flanks a true IBD segment. In both measures of sensitivity, GERMLINE greatly outperforms the HMM approach, consistently identifying greater than 90% of the segments, whereas the HMM never identifies greater than 70% and is especially poor in simulations with short segments, as low as 36% recovery for 3 cM segments. Moreover, although the trio-phased data does offer a slight increase in accuracy over singleton phasing, the difference is negligible. The increased sensitivity comes at a cost, however. Measuring specificity, the HMM algorithm maintains a superior average length of flanking false positives (average 0.14 cM), whereas GERMLINE offers a relatively low rate of 0.53 cM on average, with negligible difference between the two phasing approaches. Using the same data, we also calculated the number of unplanted segments detected by the algorithms. Supplementary table 1, Supplementary Material online shows that in ten different background pairs, GERMLINE found four and five unplanted segments in the trio and singleton phased, respectively. An important caveat is that although the background individuals were reported unrelated by the HMM algorithm, its poor sensitivity on short segments (below 50% at 3 cM) allows for these short false positives to be genuine. Looking at the actual positions, if we take the trio-phased results as ground truth, the singleton-phasing results in a single false-positive segment. Through experimentation with the CEU simulated segments, we converged on default parameters of 128 SNP window length, four allowed homozygous mismatches and one allowed heterozygous mismatch (-min_m 3 -bits 128 -err_hom 4 -err_het 1) and use these settings for all subsequent analysis. These parameters were chosen to maximize specificity, as sensitivity was no lower than 97% in all tests.
Lastly, we compare the effect of the two phasing approaches on GERMLINE-identified shared segment distributions in two cohorts from HapMap three for which trio data are available. Supplementary figure 4, Supplementary Material online shows the distribution of shared segments as a function of their length for the MEX and MKK populations (27 and 26 trios, respectively). In both instances, the trio and singleton data results in nearly identical distributions, with correlation coefficient greater than 0.99. We explore these two populations singularly for analyzing susceptibility to phased data and note that the respective shared segment distributions are consistent with figure 4B. In addition, the HapMap consortium has recently released haplotype data that were thoroughly phased in accordance with population-specific models; we have found our tests remain consistent as compared with this high quality data (not shown). We demonstrate that phasing has little effect on the overall distribution of IBD discovery performed by GERMLINE.
FIG. 4.

Relationship between segment length and amount of sharing in real and simulated data. We compute the expected number of IBD segments shared within each population (y axis, logarithmic scale) for the discrete segment length range of 3 to 30 cM (x axis). (A) AJ and EU populations shown with dot and line, solid lines show simulated coalescent data rawn from a Wright–Fisher model (WF—dark/light gray) and a bottleneck model (BN—highlight). (B) HapMap populations shown in solid colors. Y-intercept correlates to ancestral population size, decay loosely correlates to population growth. For both figures, only data points at which sharing is more than 1 in a 1,000 pairs of individuals (varies by population) are shown.
Recently, our algorithm has been evaluated in comparison with the BEAGLE and PLINK IBD detection algorithms that utilize HMMs in conjunction with pairwise analysis (Browning SR and Browning BL 2010). As in our analysis, the authors found GERMLINE to be of high sensitivity and moderate specificity for regions beyond 3 cM in length. However, those comparisons were only performed on local regions or small number of samples due to the computational complexity of the other algorithms.
The GERMLINE tool has been written in C++, and the source code is available at http://www.cs.columbia.edu/∼gusev/germline/. Version 1.3.0 with default parameters was used for all analysis.
Description of Reference Panels and Cleaning
International HapMap Project 3 (HM3)
SNP genotype data from a variety of human populations were collected using the Illumina Human1M and the Affymetrix SNP 6.0 platforms and merged (with consensus) after separate quality control. The panel includes sets of samples from two parents and an adult child (trios). Offsprings in such sets were excluded from the analysis. Alleles are expressed in the forward (+) strand of the reference human genome (NCBI build 36 or the University of California–San Cruz hg18). The data are publicly available at http://www.hapmap.org/.
To analyze cross-continent IBD sharing, we split the HapMap 3 panel into three continental cohorts: European-origin (CEU, ASW, MEX, TSI); African-origin (MKK, LWK, YRI); and East Asian-origin (GIH, CHB, CHD, JPT). Segment distributions were normalized by the number of potential pairs across any of the three cohorts.
InTraGen Population Genetics Database (Idb)
Three hundred and nine DNA samples from subjects who self-reported as being Ashkenazi Jewish (AJ) were taken from the New York Cancer Project (NYCP) collection (Mitchell et al. 2004). Five hundred and fourteen DNA samples from non-Jewish Caucasians were taken from the NYCP collection, as well as control collections previously described (Duerr et al. 2006). Data on Illumina HapMap300 v1 were produced at the Feinstein Institute for Medical Research and are available for download at http://intragen.cu-genome.org/.
Hebrew University Genetic Resource
Three hundred and ninety-seven samples were collected from individuals with AJ ancestry, as self-reported from the subjects themselves (reporting four AJ grandparents). Type 2 diabetes (T2D) samples were collected across ten specialized clinics in Israel by the patients' caring physicians. Healthy control samples were collected from blood bank donors at the Israeli Central Blood Bank, Tel-Hashomer, Israel. Sample collection was conducted under appropriate ethical committees approvals, and informed consent was obtained from donors. The data are available at http://hugr.huji.ac.il/.
Filtering Regions for Informative SNPs
Examining SNP density with respect to physical and genetic distance, we observe a small number of regions that are significantly devoid of markers and may introduce an abundance of false sharing (supplementary fig. 5A, Supplementary Material online). To ensure consistency across genotyping platforms and remove noise, GERMLINE output was postprocessed by filtering out regions of low information content. SNP density in sliding, nonoverlapping 1 Mb blocks across the genome was used to filter shared segments which spanned SNP-sparse regions. Specifically, we identified and excised regions that presented less than 100 SNPs per megabase and subsequently removed shared segments, which were shorter than a continuous 3 cM. These excised regions accounted for 8.2% and 20.3% of the HapMap and Illumina data respectively, such that the total quantity of sharing will be different between platforms but each segment will be of consistent quality. Supplementary figure 5, Supplementary Material online shows the distribution of SNP density across all regions and those that have been excised, revealing the latter to be outliers of the overall distribution. These regions were primarily located around the centromere or telomere, where marker ascertainment is sparse.
Simulating AJ Population Expansion
Extreme Population Bottleneck
We conveniently define an idealized extreme bottleneck–expansion scenario where a population is formed by one individual G gbp and infinite individuals from generation G − 1 to present. In such a scenario, all coalescent events happen at generation G. For a population that underwent an extreme bottleneck–expansion at generation G, two contemporary individuals are expected to share a number of segments of length l proportional to , where the length is expressed in centiMorgans, and P = 0.01 represents the chance of a recombination event along one unit of length for a shared segment at each generation. G can be computed from and as:
therefore
Grid Search
We refine the estimate obtained from the above calculations simulating different demographic scenarios using coalescent simulations. As summarized in supplementary figure 6, Supplementary Material online, we infer the parameters of a bottleneck event performing a grid search in the richer space of ancestral population size (A), timing of the bottleneck (G), and current population size (C). We use an exponential expansion model (i.e., the number of individuals exponentially decreases from C to A until generation G, then remains constant) and test the parameter space in the ranges: A = 400–1,550 diploid individuals with steps of 150, G = 15–27 with steps of 1 and C = 75,000 or 100,000. We obtain for the HUGR data set the least absolute deviation for A = 950, G = 23, and C = 75,000 (diploid). The deviation is computed in log-space as where S and R represent, respectively, values obtained from the simulated and real data. The sharing distributions obtained from the synthetic data sets are stable, as shown through repeated independent simulations in supplementary figure 7, Supplementary Material online.
Simulation Parameters
All coalescent simulations are performed using the GENOME rapid coalescent-based simulator (Liang et al. 2007). The GENOME package simulates resultant haplotypes from a coalescent population according to a reverse-time model; in particular, it allows for complex population histories and generates sequences with realistic LD structure. Because we are concerned primarily with segment length rather than total sharing, we limit the analysis to the first three chromosomes (unless otherwise specified). All diploid samples are created randomly mating haploid individuals, which are generated using a recombination rate of 1 cM per 1 Mb and mutation rate of 1 × 10−08 per generation per base pair. For each synthetic data set genotypes are obtained simulating ten times, the number of markers used for the analysis of the HUGR data set (unless otherwise specified). The number of synthetic markers is then matched to the HUGR data set uniformly sampling markers with MAF ≥ 0.05.
Effects of Admixture
To determine the influence of admixture on the sharing distributions, we simulate the first chromosome of two populations, P1 and P2. For the demographic profile of P1, we use the best-fit parameters for the AJ population (A = 950, G = 23, and C = 75,000). Population P2 has a constant size of 150,000 diploid individuals from generation 0 to 400 and 10,000 individuals from generation 401 on. We assess the influence of admixture on the sharing distribution of 500 samples from P1, allowing the flow of a varying number of individuals from P2 to P1 at generation 23. As the admixture proportions approach 50%, we observe a deviation of the distribution from the case of no admixture (supplementary fig. 8, Supplementary Material online).
Effects of SNP Ascertainment
Here, we explore the effects of potential ascertainment bias in GERMLINE’s IBD detection. First, we consider the impact of minor allele frequency (MAF)-based thresholding in two related populations within real data. We reanalyze the Idb data set after excluding any markers with less than 15% MAF in both AJ and EU populations (25% of the total sites) to establish an allele frequency distribution similar in both cohorts (supplementary fig. 14A, Supplementary Material online). Even with this overly conservative filtering criterion, we observe that only the overall abundance of IBD sharing decreases, whereas the segment length decay is unchanged (Pearson r of 0.991, supplementary fig. 14B, Supplementary Material online) and the giant AJ component remains (supplementary fig. 14C, Supplementary Material online).
Using synthetic data, we also seek to measure the effect of ascertaining SNP targets in one population and collecting them in another when the two are divergent. We simulate two large populations (P1 and P2) of 300,000 haploid individuals exponentially expanding from 10,000 individuals 200 gbp. The two groups merge 1,300 gbp, resulting in an FST of 0.18, comparable to the FST measured between HapMap 3 Chinese and Nigerian samples (supplementary table 2, Supplementary Material online), the most extreme population difference of the continental groups. All FST in the table were computed using the Eigenstrat software package (Price et al. 2006), with resulting values that are consistent with previous analyses of the HapMap data (International HapMap Consortium 2005). We sample 500 haploid individuals from each population to simulate a realistic chromosome with the GENOME algorithm (described previously). We ascertain markers from each of the two populations, independently selecting synthetic SNPs with MAF greater than 0.05 such that the total in each population corresponds to the HapMap 3 chromosome 22 data. We run GERMLINE with minimal parameters “-err_hom 0 -err_het 0 -bits 50” on the samples from population P1, first using the set of markers ascertained in P1, and then using the alternate set of markers independently ascertained in P2. We observe a mild fluctuation in the IBD length distributions between the two scenarios (supplementary fig. 9, Supplementary Material online, bottom), suggesting that the ascertainment of common markers from P2 moderately influences IBD discovery due to the difference in allele frequencies from two highly divergent populations. We repeat the experiment under the same conditions for two populations merging at 250 gbp, matching the FST of 0.02 observed between the AJ and CEU samples. In this instance, there is no difference in the IBD length distributions between the two scenarios (supplementary fig. 9, Supplementary Material online, top), demonstrating that SNP ascertainment has negligible effect on IBD discovery in these two populations and is unlikely to affect our conclusions regarding the AJ bottleneck.
Population Clustering
To allow for population-wide analysis, we build a graph model where each individual is represented with a vertex, and the amount of IBD sharing between two individuals corresponds to a single weighted edge. The weight of an edge between a pair of individuals is proportional to the sum of the length (in centiMorgan) of the IBD segments shared between the individuals. To account for the higher informativeness of rarely shared regions, the sum is normalized by the region specific frequency of sharing in the entire population. More formally, given a set of n ordered SNPs , we define a function to represent the normalized length of an interval between two SNPs as follows:
 |
where l(s,s+1) is the length of the segment [s,s+1], and π (s,s+1) is the number of individuals sharing the segment [s,s+1]. The maximum normalized length (all SNPs being shared by a pair of individuals) is then:
For each pair of individuals i and j sharing a set of segments K, we compute a raw edge weight normalizing the total shared length by the maximum normalized segmental length:
 |
Where and are the first and the last SNPs in the segment r.
The obtained value is representative of the total sharing between the two individuals and ranges between 0 (i.e., no sharing) and 1 (i.e., sharing of the whole genome). To account for the exponential decrease in the segmental length that occurs with the number of meioses, we use the weight on the edges in our clustering calculations.
The clustering is performed on this relatedness graph using the Markov Cluster Algorithm (MCL), detailed in (Stijn Van 2008). MCL detects clusters based on the recurrence of a random walk across a weighted graph. We run MCL with default parameters as well as the “force-connected” flag which adjusts the output clusters to ensure that they are connected components. We perform the clustering in an iterative procedure that seeks to find the underlying population structure as well as identify genetic regions that are shared between clusters. We begin with all shared segments longer than 3 cM and perform the following analysis in each iteration:
Compute the sharing graph from the current set of shared segments. This weighted graph is then provided as input for MCL, which identifies clusters of increased relatedness.
Calculate the distribution of sharing between the identified clusters as it fluctuates across the genome (as in fig. 1). We analyze this distribution and identify any genomic regions that are enriched for cross-cluster sharing (1 standard deviation [SD] above the mean genome wide).
As with regions of low information content, we excise all enriched cross-cluster regions as well as any affected matches that overlapped these regions and were shortened below 3 cM. The un-excised data are used as input for the next iteration.
FIG. 1.
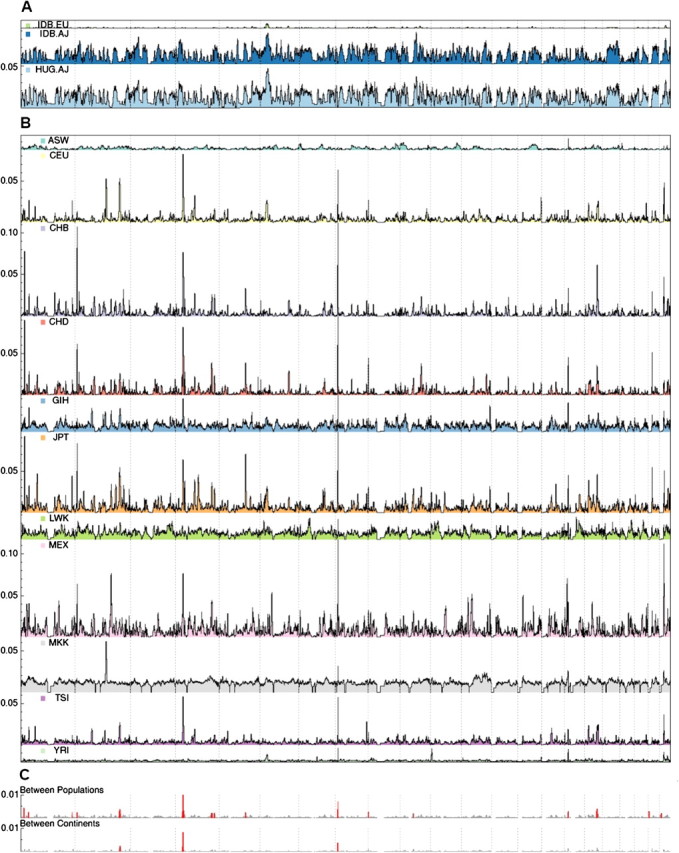
Manhattan-style plots of IBD segment sharing in worldwide populations. Fraction of pairs of individuals IBD, on the y axis, at a locus shown as a function of the genomic position at the locus (A) within Ashkenazi/European cohorts, (B) within HapMap cohorts, and (C) between HapMap continents/populations (scale not consistent with A, B). Panel c highlights enriched regions, consistent with intrapopulation sharing. Within populations, the normalization factor was equal to the number of unique pairs; between populations, the normalization factor was the product of the respective cohort sizes.
This iterative process is performed until the cluster membership converges at which point all excised regions and final clusters are reported.
Inference of Haplotype Frequency Using Pairwise Haplotype Sharing
The locus-specific chance of sharing (fig. 1) can be used to infer bounds on the frequency of haplotypes. For a region that presents a chance of sharing f, the maximum frequency reached by an underlying haplotype is:
Considering the sharing graph (e.g., fig. 2) for the locus, this quantity corresponds to , where K is the cardinality of the maximal complete subgraph that can be formed from edges (pairs of sharing individuals). In the case of N haploid individuals, considering the minimum haplotype frequency corresponding to a chance of sharing f, given that
 |
we have
In the case of diploid individuals
 |
and
FIG. 2.

Graph plot of IBD sharing in HapMap populations and resultant clusters. Nodes denote individuals, color-coded by cohort, and edges represent normalized genome-wide IBD sharing. (A) Initial clusters from unfiltered sharing—{GIH},{LWK},{JPT,CHD,CHB},{CEU,TSI} segregate. (b) Final clusters after cross-cluster edges have been iteratively removed—{TSI},{CEU} newly segregated.
Significance Testing of Known Annotations
Significance in the overlap of elevated sharing with known annotations was calculated through permutation testing. In all instances, segments of length corresponding to the test set were randomly placed along the genome and tested for overlap against features in the annotation databases. For structural variants, the permutations were performed across regions identified in 30 individuals from HapMap using array-based comparative genome hybridization (Iafrate et al. 2004; Perry et al. 2008). A segment was considered positive when the simulated region overlapped either partially or entirely with a reported variant. The number of permutations which result in as many or more positive segments than the test set are reported. Regions of positive selection previously reported in Voight et al. (2006), Sabeti et al. (2007), and Pickrell et al. (2009) were similarly tested for overlap with loci enriched for IBD segments. Permutations were performed considering regions of overlap (three regions for Sabeti et al. (2007): P < 0.0034; two regions for Voight et al. (2006): P < 0.0439; seven regions for Pickrell et al. (2009): P < 0.0027; and eight regions considering the union: P < 0.0017).
Sharing Graph Visualization
We have developed ShareViz, a publicly available Java application for visualizing and navigating large data sets of related individuals (as in figs. 2 and 3). ShareViz uses a traditional force-directed graph visualization algorithm to lay out individuals (as nodes) based on their pairwise connections and contains flexible representation options such as color-coded individuals, graphical clusters, and weighted edge thickness.
FIG. 3.

Graph plot of IBD sharing between samples of Ashkenazi (blue/dark) and European (green/light) origin. Each colored vertex represents a sample from the respective population, edges represent IBD sharing between incident individuals, and edge width represents total amount of sharing genomewide. Ashkenazi samples form “giant connected component” and no edges longer than 100 cM to the European population.
Potential Insights from Sharing Graph
The ShareViz software used to visualize the sharing graphs is provided as a supplement to this paper, as well as three self-loading data sets: “HapMap3 by population” which lays out sharing between individuals in HapMap3 and clusters according to self described population status (supplementary fig. 10, Supplementary Material online); “HapMap3 by cluster” which lays out sharing according to the groups automatically generated by the iterative clustering procedure detailed previously (fig. 2B); and “HapMap3 close relatives” which shows sharing between individuals identified as avuncular or closer relatives, primarily from the MKK cohort (supplementary fig. 11, Supplementary Material online). Further information on running and using ShareViz is described in the attached documentation.
Comparison of Principal Component Analysis and Multidimensional Scaling Visualizations
The use of IBD to investigate population structure may complement existing methodologies, such as principal component analysis (PCA). This is illustrated in supplementary figure 12, Supplementary Material online, where we simulated a population of 50,000 individuals that separate into two populations of 49,000 and 1,000 individuals, the latter expanding to 5,000 in 50 generations. The GENOME software package was adopted for all simulations, for which we used the same parameter previously described for the simulation of AJ population expansion. Fifty diploid samples are extracted from each population, and their internal genetic structure is investigated through different methods. We compare the visualization obtained by PCA using the Eigenstrat (Price et al. 2006) software package and the multidimensional scaling (MDS) plots obtained using the IBD and IBS distance matrices for all samples. The MDS plots were obtained using the Matlab Toolbox for Dimensionality Reduction. The distance between two individuals for the IBD matrix was computed as the fraction of the Genome that is not shared IBD, whereas the Plink Software package was used to compute the IBS distance matrix. This simulated scenario shows how haplotype-based analysis of relatedness may provide a more detailed insight into recent events of diversification among populations that are difficult to distinguish using unlinked markers.
Results
In a homogeneous population, a random pair of individuals has a chance p to demonstrate genetic relatedness, where p depends on the demography (chance of coalescence) and the required threshold for relatedness. We can therefore define the relatedness graph G, with nodes corresponding to individuals and edges to genetic relatedness such that across a cohort of size n, one expects p(n choose 2) edges. Under various assumptions, graph theory essentially guarantees that in a random graph, if pn > 1 + ϵ (where ϵ is a fixed constant), the majority of nodes will be transitively linked in what is known as a “giant” connected component (William et al. 2000). We set out to test this prediction.
We first examined the Idb of 903 New York Health Study participants (see Materials and Methods and table 1). After filtering five samples to eliminate closely related pairs, an average pair of samples has a chance of one-third of sharing at least one IBD segment (123,173 pairs share a total average of 35.4 cM). Analyzing the relatedness graph, only 424 of the 898 nodes (fig. 3) are spanned by a large connected component. This result represents a consistent deviation from the theoretical expectation for the case of a random graph, where such strong node partitioning is very unlikely to be maintained (P value << 10–100 under a hypergeometric distribution). The cohort is indeed structured, and the node membership in the connected component is highly correlated with self-identification as AJ (99.7% of Ashkenazi individuals are spanned by the connected component, constituting 91.5% of the component’s nodes). Overall, the total genome-wide sharing for an average pair of AJ samples (54.25 cM) is considerably higher than that of EU samples (1.81 cM). Examining specific relationship types, we also see that the AJ samples are enriched within “intermediate” relatives, accounting for 85.6% of the total 77,676 such pairs and, accordingly, depleted within “remote” single-segment relatives, accounting for only 18.5% of the total 45,497 such pairs.
To investigate whether this increased intermediate relatedness amongst AJ is specific to Idb, we compared sharing to 400 additional AJ samples from the Hebrew University Genetic Research (HUGR). We observed the two AJ cohorts to have similar levels of sharing within each data set, as well as across data sets, with the HUGR samples exhibiting the highest amount of sharing internally and to other AJ samples (supplementary table 3, Supplementary Material online). On average, a pair of AJ samples from HUGR stands out as having larger percentage of the genome shared (1.94%—table 1 “HUGR AJ”) compared with the non-AJ European population on the same platform (0.06%—table 1 “Idb EA”).
Looking forward, we briefly consider the implications that this abundance of recent sharing may have for inference from high-throughput sequencing (Kaiser 2008). Probabilistic models of more distant relatedness have been successfully used to infer missing genotypes from a subset of individuals genotyped at high resolution (Chen and Abecasis 2007). We contend that IBD shared segments between sequenced and genotyped individuals can also be used for such inference. In the HUGR samples, where 1.73% of the genome is shared between an average pair, we would expect a single individual to share 82.2% of the genome with at least one other sample from a cohort of 100. This shared fraction would then be used for inference of uncommon variants if the remaining 99 individuals are sequenced. Analyzing this inference potential in practice, we perform a similar empirical calculation on 100 HUGR samples. Over 100 iterations, we exclude a single individual from the pool and calculate the percentage of its genome that is shared with at least one of the remaining 99 samples. We find that an average individual shares 68.8% (SD 10.8%) of the 2.78 Gbp genotyped genome with at least one other sample. This deviates from the expectation due to the nonuniform distribution of sharing we have demonstrated previously but still represents significant inference potential. We caution that this analysis assumes fully accurate inference within a single shared segment and represents only an upper-bound estimate.
The large number of segments shared between AJ samples facilitates analysis of the length distribution of these segments; particularly the exponential decay along the segment-length range of 3–25 cM (fig. 4A, supplementary table 4, Supplementary Material online), which accounts for >99.97% of the shared-segment pairs. In an idealized population bottleneck where all individuals concurrently coalesce to the same MRCA, the observed exponential decay of 0.671 per cM (SD 0.055) is consistent with a bottleneck event around 20 generations before present, followed by a rapid expansion (Materials and Methods). We used extensive simulations to perform grid search in a richer parameter space (timing of the bottleneck, ancestral population size, and current population size) using an exponential expansion model. We observe the effect of the ancestral population size on the frequency of short IBD segments, whereas the current population size mainly affects the longer segments (supplementary fig. 13, Supplementary Material online). The timing of the bottleneck affects the entire distribution, with stronger effects on midrange segments. Our grid search suggests a rapid expansion of about 950 diploid individuals 23 generations ago to the current hundreds of thousands (supplementary fig. 6, Supplementary Material online). Furthermore, summary statistics on haplotype sharing length obtained from a constant-size population model are not compatible with the empirical distributions (fig. 4A, Materials and Methods). More complex models may be required to explain the deviation observed for segments shorter than 5 cM. The estimated timing is consistent with a model of AJ population structure inferred from historical data (Slatkin 2004) and can be reconciled with previous analysis of rare mutations (Risch et al. 2003) and mithocondrial data (Behar et al. 2006). Although significant admixture can be shown to influence the sharing distributions (supplementary fig. 8, Supplementary Material online), our use of a single-population model seems reasonable due to the limited amount of recent sharing observed between European and Ashkenazi samples (table 1) and by the strong similarity of the length distributions for AJ individuals sampled in Israel and USA (Idb.AJ and HUGR, see Materials and Methods). In other populations, the number of shared-segment pairs is smaller (fig. 4B) and does not yet allow for robust inference of demography, thought we still provide measures of exponential decay for comparison.
In order to examine locus-specific phenomena, we focus our analysis on local segment sharing due to intermediate and remote relatedness rather than genome-wide sharing between close relatives. IBD sharing is detected everywhere along the genome, averaging population-specific background levels (fig. 1A and B). We analyze the physical distribution of IBD sharing (Materials and Methods) within and across populations, observing regions with a much higher amount of sharing than expected (fig. 1A and B). Analyzing AJ samples, the most prominent such region is the human leukocyte antigen (HLA) locus (fig. 1A). The entire segment of chromosome 6, between 25 and 35 Mb, is shared among individuals unrecombined at least 4-fold more than any other region in the genome (4.2-fold in Idb, 5.1-fold in HUGR). This is in accordance with previous observations of complex haplotype structure along the HLA locus (de Bakker et al. 2006).
Examining the regions of intense sharing within HM3 populations, HLA still exhibits a very high sharing density for some of the populations: Western Europeans (CEU), Gujarati Indians (GIH), Luhya Kenyans (LWK), and Yoruba Nigerians (YRI). Additional regions along the genome exhibit notably high sharing densities within populations. Interestingly, many of these tend to also recur across unrelated individuals of different geographical origin (table 2 and fig. 1C). Segments at the recurrently shared regions in chromosomes 2, 4, and 8 are shared even across different continents of origin. Of particular interest may be the most commonly shared region, on chromosome 8p23.1, overlapping 5 Mb of a common inversion polymorphism—the third longest reported structural variant in the entire genome (Iafrate et al. 2004).
Table 2.
Annotated Regions Enricheda for IBD Sharing between HapMap Populations.
| Sharing Pairsb | Chromosome | Region | Peak (Mb) | Region (Mb) | Structural Variationc | Number of Samples | ||
| 44,774 | 4d | p15.1–p14 | 33.1 | 31.0 | 36.0 | 319,772 | CNV | 23 |
| 2,833 | 8d | p23.1–p22 | 12.2 | 11.1 | 13.3 | 5,081,341 | INV | 30 |
| 1,694 | 1 | p36.21–p36.13 | 16.6 | 15.4 | 17.8 | 719,648 | CNV | 23 |
| 1,537 | 17 | q22–q23.2 | 55.5 | 53.1 | 57.0 | 703,400 | CNV | 17 |
| 1,501 | 2d | q32.3–q33.1 | 196.0 | 192.9 | 199.0 | 221,355 | CNV | 9 |
| 1,195 | 16 | p13.11–p12.3 | 16.5 | 15.9 | 17.1 | 1,863,800 | CNV | 27 |
| 1,133 | 21 | q21.1 | 16.4 | 15.7 | 17.0 | |||
| 1,022 | 9 | p24.3 | 1.5 | 1.3 | 2.0 | |||
| 929 | 2 | p25.1 | 9.3 | 8.7 | 9.8 | |||
| 928 | 1 | p34.3 | 37.1 | 35.1 | 37.3 | 266,949 | CNV | 1 |
| 927 | 1 | q42.3–q43 | 234.8 | 234.5 | 235.2 | 35,528 | CNV | 1 |
| 927 | 5 | q23.1 | 117.4 | 116.2 | 118.1 | |||
| 882 | 4 | q32.1 | 158.7 | 157.8 | 160.70 | 230,401 | CNV | 2 |
| 822 | 4 | q32.3–q33 | 170.9 | 170.2 | 171.3 | |||
| 813 | 22 | q11.22–q11.23 | 21.4 | 21.1 | 21.9 | |||
| 796 | 10 | q21.1 | 59.5 | 58.7 | 60.3 | 340,232 | CNV | 12 |
Sharing density > mean + 2 × SD.
Population mean = 191.2; SD = 284.8.
Permuted P value: 0.00052 in largest 100 structural variants.
Appears in cross-continent analysis.
Demonstrating the ability of IBD networks to reconstruct population structure across a diverse cohort, we have implemented a clustering method that recapitulates broad geographical origin (fig. 2, Materials and Methods). The network of shared segments in HM3 (supplementary fig. 10, Supplementary Material online) is dense within populations and geographic regions and sparse between them. We can immediately observe an abundance of recent sharing within the cohorts, particularly in the MKK and LWK Africans; the GIH Indians. Moreover, this high level of sharing is homogenous across most of the population and not suggestive of individual cryptic relatives. Looking across populations, only the JPT, CHD, and CHB East Asian groups exhibit a large number of shared segments, particularly between the two Chinese populations. The few remaining segments are also overwhelmingly within continental groups, particularly between CEU and TSI. To refine these networks, we use the observed unlabeled clusters (fig. 2A) to guide the filtering of shared regions, excluding regions that are recurrently shared between clusters. We iteratively repeat this procedure of filtering and clustering, until convergence, which occurs after three iterations in HM3 (Materials and Methods). The final clusters demonstrate improved resolution between populations (fig. 2B), with six cross-cluster regions remaining (supplementary table 5, Supplementary Material online).
In total, the 16 cross-population commonly shared regions span only <35 Mb (<0.92%) of the genome but account for 9.6%, 16.1%, and 18.1% of sharing within populations, between populations, and between continents, respectively. We note that these regions are not correlated to SNP density and would be unaffected by slight changes in the information content filtering (Materials and Methods; supplementary fig. 5, Supplementary Material online). Although sharing of a region may indicate recent common ancestry, the agglomeration of shared segments at 16 loci is highly nonrandom. Biological factors or recent positive selection are possible causes of the observed reduction in haplotype diversity (Discussion). Some of the identified loci correspond to previously reported regions of recent positive selection. In particular, 8 of the 16 regions were reported: 1p34.3, 2q32.3 (Voight et al. 2006); 4p15 (Voight et al. 2006; Sabeti et al. 2007; Pickrell et al. 2009); 4q32.1, 17q22 (Sabeti et al. 2007; Pickrell et al. 2009); 10q21.1, 21q21.1, 22q11.22 (Pickrell et al. 2009), an overlap not expected by chance (P < 0.0017, Materials and Methods). Further evidence for biological retention of unrecombined ancient haplotypes, rather than random retention of new ones, comes from examining annotation for these 16 commonly shared segments. Seeking commonalities, we observe 12 of these segments to overlap structural variants that are common and long enough to have been detected in the HapMap by CGH (table 2; Iafrate et al. 2004; Perry et al. 2008). Such overlap is not expected by chance (P = 0.00052 in 100 longest; Materials and Methods).
Discussion
We have presented novel analysis of long-range haplotypes of several centiMorgans shared among individuals within and across populations. The prominence of the HLA locus as a commonly shared region is likely a manifestation of the known unique structure of variation at that genomic landmark: multiple, very divergent haplotypes (Miretti et al. 2005; de Bakker et al. 2006). At the HLA, this deviation from Wright–Fisher population genetics has been attributed to mate selection (Zahavi 1975) or positive selection (Suzuki and Gojobori 1999).
Indeed, multiple methods rely on haplotype homozygosity for detecting positive selection (Sabeti et al. 2002, 2007; Voight et al. 2006; Pickrell et al. 2009) with results that overlap with significance the 16 regions we identify as enriched for IBD sharing across individuals of different geographical origin. However, despite the similarities between our work and previous work on positive selection, there are two key differences between these methodologies: a technical difference and, as a result, a second, quintessential one. First, there is a power difference between these methods across different haplotype frequencies. Although current methodologies for the detection of positively selected regions are limited to haplotypes that reached relatively high frequencies (more than 30%) (Pritchard et al. 2000), our locus-specific measure of pairwise sharing highlights (typically longer) haplotypes and combinations thereof at very low frequencies (Materials and Methods). Secondly, and as a consequence of this difference, it is harder to interpret shared IBD regions across populations as sites of recent positive selection, as this interpretation depends on using haplotype length as a surrogate for recent origin (Sabeti et al. 2002). As we work with longer segments, such interpretation would suggest they originate later than population splits, which is inconsistent with long haplotypes being shared across multiple populations (e.g., 2q32.3-q33.1, 4p15.1-p14, and 8p23.1-p22). One would need to assume more complex scenarios of demographic history, with admixture, migrations, and selection occurring at multiple places, to explain such regions. An alternative interpretation accepts the conjecture that haplotypes in these regions are indeed old, explaining their abundance and geographic spread, with their long span as unrecombined stretches being the outlier data point. The retention of such unrecombined, ancient haplotypes may be explained by reduced inter-haplotype recombination, or selection against recombinants, which is not necessarily directional. The observed enrichment for structural variations (P = 0.00052 among 100 longest segments) may suggest a mechanism for such selection, if incompatible structural alleles are less likely to recombine.
Zooming out from local regions to a genome-wide perspective, the abundance of long-range recurring haplotypes indicates widespread unreported relatedness, providing insight into recent population structure. Our bottom-up approach to studying population structure may complement existing methodologies such as PCA (Menozzi et al. 1978; Price et al. 2006) or Bayesian clustering (Pritchard et al. 2000), which seek linear patterns and trends that are data set wide (Methods, supplementary fig. 12, Supplementary Material online). Additionally, our analysis of IBD distributions provides estimations of the recent effective population size and demographic history that are robust to many simulated genealogical scenarios. Practically, this understanding may prove useful when considering high-throughput sequencing of population panels and evaluating their expansion to represent most individuals through sequenced relatives and therefore saturating our knowledgebase of human variation.
Supplementary Material
Supplementary tables 1–5 and figures 1–14 are available at Molecular Biology and Evolution online (http://www.mbe.oxfordjournals.org/).
Acknowledgments
This work was supported by the National Institute of Health (NIH U54 CA121852 to A.G. and CA121852 to I.P.); the National Science Foundation (NSF-GRFP to A.G., IIS 0845677 to P.F.P., and CCF 0829882 to I.P.); and AmGen (AmGen Undergraduate Fellowship to Z.Z.).
References
- Behar DM, Metspalu E, Kivisild T, et al. (20 co-authors) The matrilineal ancesry of Ashkenazi Jewry: portrait of a recent founder event. Am J Hum Genet. 2006;78:487–497. doi: 10.1086/500307. [DOI] [PMC free article] [PubMed] [Google Scholar]
- Browning BL, Browning SR. A unified approach to genotype imputation and haplotype-phase inference for large data sets of trios and unrelated individuals. Am J Hum Genet. 2009;84:210–223. doi: 10.1016/j.ajhg.2009.01.005. [DOI] [PMC free article] [PubMed] [Google Scholar]
- Browning SR, Browning BL. High-resolution detection of identity by descent in unrelated individuals. Am J Hum Genet. 2010;86:526–539. doi: 10.1016/j.ajhg.2010.02.021. [DOI] [PMC free article] [PubMed] [Google Scholar]
- Chen WM, Abecasis GR. Family-based association tests for genomewide association scans. Am J Hum Genet. 2007;81:913–926. doi: 10.1086/521580. [DOI] [PMC free article] [PubMed] [Google Scholar]
- de Bakker PI, McVean G, Sabeti PC, et al. (29 co-authors) A high-resolution HLA and SNP haplotype map for disease association studies in the extended human MHC. Nat Genet. 2006;38:1166–1172. doi: 10.1038/ng1885. [DOI] [PMC free article] [PubMed] [Google Scholar]
- Duerr RH, Taylor KD, Brant SR, et al. (23 co-authors) A genome-wide association study identifies IL23R as an inflammatory bowel disease gene. Science. 2006;314:1461–1463. doi: 10.1126/science.1135245. [DOI] [PMC free article] [PubMed] [Google Scholar]
- Fisher RA. The genetical theory of natural selection. Oxford: Clarendon Press; 1930. [Google Scholar]
- Gusev A, Lowe JK, Stoffel M, Daly MJ, Altshuler D, Breslow JL, Friedman JM, Pe'er I. Whole population, genome-wide mapping of hidden relatedness. Genome Res. 2009;19:318–326. doi: 10.1101/gr.081398.108. [DOI] [PMC free article] [PubMed] [Google Scholar]
- Iafrate AJ, Feuk L, Rivera MN, Listewnik ML, Donahoe PK, Qi Y, Scherer SW, Lee C. Detection of large-scale variation in the human genome. Nat Genet. 2004;36:949–951. doi: 10.1038/ng1416. [DOI] [PubMed] [Google Scholar]
- Inernational HapMap Consortium. A haplotype map of the human genome. Nature. 2005;437:1299–1320. doi: 10.1038/nature04226. [DOI] [PMC free article] [PubMed] [Google Scholar]
- Kaiser J. DNA sequencing. A plan to capture human diversity in 1000 genomes. Science. 2008;319:395. doi: 10.1126/science.319.5862.395. [DOI] [PubMed] [Google Scholar]
- Kong A, Gudbjartsson DF, Sainz J, et al. (16 co-authors) A high-resolution recombination map of the human genome. Nat Genet. 2002;31:241–247. doi: 10.1038/ng917. [DOI] [PubMed] [Google Scholar]
- Kong A, Masson G, Frigge ML, et al. (17 co-authors) Detection of sharing by descent, long-range phasing and haplotype imputation. Nat Genet. 2008;40:1068–1075. doi: 10.1038/ng.216. [DOI] [PMC free article] [PubMed] [Google Scholar]
- Liang L, Zollner S, Abecasis GR. GENOME: a rapid coalescent-based whole genome simulator. Bioinformatics. 2007;23:1565–1567. doi: 10.1093/bioinformatics/btm138. [DOI] [PubMed] [Google Scholar]
- Menozzi P, Piazza A, Cavalli-Sforza L. Synthetic maps of human gene frequencies in Europeans. Science. 1978;201:786–792. doi: 10.1126/science.356262. [DOI] [PubMed] [Google Scholar]
- Miretti MM, Walsh EC, Ke X, et al. (14 co-authors) A high-resolution linkage-disequilibrium map of the human major histocompatibility complex and first generation of tag single-nucleotide polymorphisms. Am J Hum Genet. 2005;76:634–646. doi: 10.1086/429393. [DOI] [PMC free article] [PubMed] [Google Scholar]
- Mitchell MK, Gregersen PK, Johnson S, Parsons R, Vlahov D. The New York Cancer Project: rationale, organization, design, and baseline characteristics. J Urban Health. 2004;81:301–310. doi: 10.1093/jurban/jth116. [DOI] [PMC free article] [PubMed] [Google Scholar]
- Perry GH, Ben-Dor A, Tsalenko A, et al. (17 co-authors) The fine-scale and complex architecture of human copy-number variation. Am J Hum Genet. 2008;82:685–695. doi: 10.1016/j.ajhg.2007.12.010. [DOI] [PMC free article] [PubMed] [Google Scholar]
- Pickrell JK, Coop G, Novembre J, et al. (11 co-authors) Signals of recent positive selection in a worldwide sample of human populations. Genome Res. 2009;19:826–837. doi: 10.1101/gr.087577.108. [DOI] [PMC free article] [PubMed] [Google Scholar]
- Price AL, Patterson NJ, Plenge RM, Weinblatt ME, Shadick NA, Reich D. Principal components analysis corrects for stratification in genome-wide association studies. Nat Genet. 2006;38:904–909. doi: 10.1038/ng1847. [DOI] [PubMed] [Google Scholar]
- Pritchard JK, Stephens M, Donnelly P. Inference of population structure using multilocus genotype data. Genetics. 2000;155:945–959. doi: 10.1093/genetics/155.2.945. [DOI] [PMC free article] [PubMed] [Google Scholar]
- Purcell S, Neale B, Todd-Brown K, et al. (11 co-authors) PLINK: a tool set for whole-genome association and population-based linkage analyses. Am J Hum Genet. 2007;81:559–575. doi: 10.1086/519795. [DOI] [PMC free article] [PubMed] [Google Scholar]
- Risch N, Tang H, Katzenstein H, Ekstein J. Geographic distribution of disease mutations in the Ashkenazi Jewish population supports genetic drift over selection. Am J Hum Genet. 2003;72:812–822. doi: 10.1086/373882. [DOI] [PMC free article] [PubMed] [Google Scholar]
- Sabeti PC, Reich DE, Higgins JM, et al. (17 co-authors) Detecting recent positive selection in the human genome from haplotype structure. Nature. 2002;419:832–837. doi: 10.1038/nature01140. [DOI] [PubMed] [Google Scholar]
- Sabeti PC, Varilly P, Fry B, et al. (245 co-authors) Genome-wide detection and characterization of positive selection in human populations. Nature. 2007;449:913–918. doi: 10.1038/nature06250. [DOI] [PMC free article] [PubMed] [Google Scholar]
- Slatkin M. A population-genetic test of founder effects and implications for Ashkenazi Jewish diseases. Am J Hum Genet. 2004;75:282–293. doi: 10.1086/423146. [DOI] [PMC free article] [PubMed] [Google Scholar]
- Stijn Van D. Graph clustering via a discrete uncoupling process. SIAM J Matrix Anal Appl. 2008;30:121–141. [Google Scholar]
- Suzuki Y, Gojobori T. A method for detecting positive selection at single amino acid sites. Mol Biol Evol. 1999;16:1315–1328. doi: 10.1093/oxfordjournals.molbev.a026042. [DOI] [PubMed] [Google Scholar]
- Tajima F. Evolutionary relationship of DNA sequences in finite populations. Genetics. 1983;105:437–460. doi: 10.1093/genetics/105.2.437. [DOI] [PMC free article] [PubMed] [Google Scholar]
- Voight BF, Kudaravalli S, Wen X, Pritchard JK. A map of recent positive selection in the human genome. PLoS Biol. 2006;4:e72. doi: 10.1371/journal.pbio.0040072. [DOI] [PMC free article] [PubMed] [Google Scholar]
- William A, Fan C, Linyuan L. A random graph model for massive graphs. In: Yao F, Luks E, editors. Proceedings of the thirty-second annual ACM symposium on theory of computing. Portland (OR): ACM; 2000. pp. 171–180. [Google Scholar]
- Wright S. Evolution in Mendelian Populations. Genetics. 1931;16:97–159. doi: 10.1093/genetics/16.2.97. [DOI] [PMC free article] [PubMed] [Google Scholar]
- Zahavi A. Mate selection-a selection for a handicap. J Theor Biol. 1975;53:205–214. doi: 10.1016/0022-5193(75)90111-3. [DOI] [PubMed] [Google Scholar]
Associated Data
This section collects any data citations, data availability statements, or supplementary materials included in this article.