

Abstract
We analyzed the genome-wide pattern of single nucleotide polymorphisms (SNPs) in a sample with 12 strains of Staphylococcus aureus. Population structure of S. aureus seems to be complex, and the 12 strains were divided into five groups, named A, B, C, D, and E. We conducted a detailed analysis of the topologies of gene genealogies across the genomes and observed a high rate and frequency of tree-shape switching, indicating extensive homologous recombination. Most of the detected recombination occurred in the ancestral population of A, B, and C, whereas there are a number of small regions that exhibit evidence for homologous recombination with a distinct related species. As such regions would contain a number of novel mutations, it is suggested that homologous recombination would play a crucial role to maintain genetic variation within species. In the A-B-C ancestral population, we found multiple lines of evidence that the coalescent pattern is very similar to what is expected in a panmictic population, suggesting that this population is suitable to apply the standard population genetic theories. Our analysis showed that homologous recombination caused a dramatic decay in linkage disequilibrium (LD) and there is almost no LD between SNPs with distance more than 10 kb. Coalescent simulations demonstrated that a high rate of homologous recombination—a relative rate of 0.6 to the mutation rate with an average tract length of about 10 kb—is required to produce patterns similar to those observed in the S. aureus genomes. Our results call for more research into the evolutionary role of homologous recombination in bacterial populations.
Keywords: population genomics, bacteria, homologous recombination, demography, linkage disequilibrium
Introduction
Although bacterial species have a single haploid genome with no meiotic process, recombination plays a significant role in their genome evolution (Feil and Spratt 2001, Awadalla 2003, Falush 2009, Tenaillon et al. 2010). Recombination in bacteria is defined as the process in which a segment of a donor genome is integrated into a host genome, with two possible major outcomes. One is a homologous exchange between the foreign segment and the host genome, called homologous recombination. This potentially occurs when the host genome has regions homologous to the foreign DNA, and the rate of successful DNA exchange of homologous region would depend on the sequence identity between them (Levin 1988, Rayssiguier et al. 1989). The other outcome is the insertion of a foreign DNA segment into an arbitrary position in the host genome. When the inserted segment includes coding genes, it results in the well-known phenomenon of lateral (or horizontal) gene transfer (Griffith 1928, Ochman et al. 2000).
Here we focus on the former process, homologous recombination. The mechanism of bacterial homologous recombination is quite different from recombination (crossing-over and gene conversion) in eukaryotes. Homologous recombination in bacteria occurs by an uptake of a foreign DNA segment through various mechanisms such as natural transformation (uptake of naked DNA segments from the environment), conjugation (physical contact between donor and recipient cells), and transduction (bacteriophage-mediated transfer) (Whittam and Ake 1993, Ochman et al. 2000, Errington et al. 2001). Then a homology-dependent allelic (and possibly nonallelic) exchange occurs between the foreign DNA segment and the recipient genomic sequence (Levin 1988, Rayssiguier et al. 1989). It has been demonstrated that the rate of successful exchange can dramatically decrease with increasing sequence divergence (Majewski and Cohan 1999), so that homologous exchanges predominantly occur within species.
One approach to estimate the rate and explore the role of homologous recombination is to analyze sequence data, such as single nucleotide polymorphisms (SNPs). So far, homologous recombination in bacteria has been best documented by the multilocus sequence typing (MLST) project, in which short fragments, generally in seven housekeeping genes, were resequenced for a very large sample in various species (Maiden et al. 1998, Narra and Ochman 2006, Vos and Didelot 2009). In these data, the presence of homologous recombination is indicated by the incongruence among the genealogies of the different loci. However, our knowledge of the rate and tract length of homologous recombination is still limited. Here, we aim to quantify the extent of homologous recombination from polymorphism data. For this purpose, long collinear region data sets, rather than multiple short regions, would yield more information and be amenable to analyses using established population genetic theories.
Theories of population genetics mainly concern microevolutionary processes of orthologous loci (regions) in a single population or species. Therefore, it is straightforward to apply them to most loci in eukaryotes. However, this may not be as easy for bacteria given that bacterial genomes undergo frequent genome rearrangements, such as inversion and translocation, and lateral gene transfers, which disrupt the synteny along the genome. In such regions, it is hard to establish orthology relationships and to align genomic sequences among the strains in a single species. Thus, it has been thought that applying population genetic theories to bacteria may not be very suitable (e.g., Treangen et al. 2008, Darling et al. 2008).
Nonetheless, there are several species in which the rates of lateral gene transfers and genomic rearrangement are relatively low so that collinearity is conserved across the genomes, such as in the case of Staphylococcus aureus (Lindsay and Holden 2004) and Bacillus cereus (Rasko et al. 2005). In this study, we use S. aureus as a model organism because we find it feasible to identify orthology for most regions in the genome, so that population genetic analyses of SNPs can be verified. Staphylococcus aureus is a major pathogen that is associated with serious community-acquired and nosocomial diseases (Emori and Gaynes 1993, Steinberg et al. 1996). Methicillin-resistant strains (MRSA) of this species are well recognized because they are resistant to multiple antibiotics, including methicillin, and their infection could cause serious diseases (Panlilio et al. 1992, Speller et al. 1997, Grubb 1998). Due to these medical concerns, S. aureus is one of the species for which genomic sequences of multiple individuals are available; whole-genome sequences for this species are available for more than ten strains, including MRSA and methicillin-susceptible S. aureus (MSSA) strains (table 1). This availability of whole-genome sequences of multiple strains was one of our initial motivations for conducting this study.
Table 1.
List of Strains of Staphylococcus aureus Used in the Present Study
| Groupa | Strains | Accessionb | Genome Size (bp) | mecA + / –c | Host Species | STd | CCe | Reference |
| A | COL | NC002951 | 2,809,422 | mecA + | Human | ST250 | CC8 | (Gill et al.(2005)) |
| USA300 | NC007793 | 2,872,769 | mecA + | Human | ST8 | CC8 | (Diep et al.(2006)) | |
| NCTC8325 | NC007795 | 2,821,361 | mecA – | Human | ST8 | CC8 | Gillaspy et al.f | |
| Newman | NC009641 | 2,878,897 | mecA – | Human | ST254 | CC8 | (Baba et al.(2008)) | |
| B | MSSA476 | NC002953 | 2,799,802 | mecA – | Human | ST1 | CC1 | (Holden et al.(2004)) |
| MW2 | NC003923 | 2,820,462 | mecA + | Human | ST1 | CC1 | (Baba et al.(2002)) | |
| C | N315 | NC002745 | 2,814,816 | mecA + | Human | ST5 | CC5 | (Kuroda et al.(2001)) |
| Mu50 | NC002758 | 2,878,529 | mecA + | Human | ST5 | CC5 | (Kuroda et al.(2001)) | |
| JH9 | NC009487 | 2,906,700 | mecA + | Human | ST105 | CC5 | (Mwangi et al.(2007)) | |
| JH1 | NC009632 | 2,906,507 | mecA + | Human | ST105 | CC5 | (Mwangi et al.(2007)) | |
| D | RF122 | NC007622 | 2,742,531 | mecA – | Bovine | ST151 | NA | (Herron-Olson et al.(2007)) |
| E | MRSA252 | NC002952 | 2,902,619 | mecA + | Human | ST36 | CC30/CC39 | (Holden et al.(2004)) |
The groups were based on phylogenetic analysis in figure 2A.
Accession numbers of NCBI database.
Methicillin resistance ( + ) or susceptible ( – ).
Sequence types (STs) inferred from the concatenation of seven MLST loci (Enright200010698988,Feil200312754228).
Clonal complex (Feil200312754228,Sabat200818664262).
Direct submission.
Still, applying the standard coalescent theory to S. aureus is not very straightforward due to two major differences between eukaryotes and bacteria. First, the mechanism of recombination is different. The major recombination mechanisms in eukaryotes are crossing-over and gene conversion, whereas in bacteria homologous recombination occurs through transformation, transduction, or conjugation. The resolution of bacterial homologous recombination is an allelic exchange of a relatively short fragments, which is similar to gene conversion in eukaryotes (Maynard Smith et al. 1991, Didelot and Falush 2007). Therefore, recombination should be incorporated as such a conversion-like event in the framework of the coalescent theory. The second concerns isolation between individuals (strains). As well as eukaryotes, geography is the major factor to cause isolation. For infectious bacteria, population structure of the host species also matters. Furthermore, in bacteria, isolation could be caused by physiological factors, such as the frequency or efficacy of transformation, transduction, and conjugation. As a consequence, it is possible that a population can be genetically structured in a sympatric situation. These factors should be reflected in modeling the evolution of a bacterial population, although the coalescent is flexible enough to incorporate any kind of isolation. Throughout this work, we perform population genetic analysis of genome-wide SNPs in S. aureus, taking these factors into account.
Methods
Genome Sequences of S. aureus
The genome sequences of 12 strains of S. aureus were downloaded from the NCBI database (ftp://ftp.ncbi.nih. gov/genomes/) on November 2006, including 8 MRSA (Panlilio et al. 1992, Speller et al. 1997, Grubb 1998) and 4 MSSA strains (summarized in table 1). These strains were isolated from humans except for RF122, which was isolated from a bovine. The genome sizes of the 12 strains range from 2.74 to 2.91 Mb. Genomic sequences are currently available for more than 12 strains, but adding them to the analysis does not change our major conclusions because each of the new strains has nearly identical genomic sequence to at least one of the 12 strains we consider here.
Alignment of Whole-Genome Sequences
The whole-genome sequences of those 12 strains of S. aureus were aligned, which was not very complicated because the synteny along the entire chromosome is well conserved, as has been pointed out (Lindsay and Holden 2004). We first confirmed the synteny conservation by all-against-all BlastN searches with default parameters (Altschul et al. 1997). This process revealed that there is no large-scale structural variation such as inversion and duplication and that the major part of the genome can be reliably aligned at the nucleotide level except for some local regions, including staphylococcus cassette chromosome mec (SCCmec) element, pathogenicity islands, prophages, restriction enzymes, transposable elements, and highly repetitive sequences (Katayama et al. 2000, Ma et al. 2002, Lindsay and Holden 2004). Interrupted by those regions, the genome was divided into 33 subregions (shown in blue in fig. 1), in which reliable multiple alignments of the 12 genomes were obtained. The alignment of each subregion was constructed by using ClustalW version 1.83 with default parameters (Thompson et al. 1994), followed by visual inspection.
FIG 1.

Comparative circular map of 12 strains of Staphylococcus aureus. Red bars outside the circle indicate the positions of the seven MLST loci (Enright et al. 2000, Feil et al. 2003). The outer circle represents conserved (blue) and highly variable (gray) regions, respectively. In the second circle, the distribution of synonymous nucleotide diversity, πS, is shown in green. The third circle shows the distribution of the GC content at third positions of codons in magenta. The fourth and fifth circles are for the positions of genes with forward (cyan) and reverse (orange) orientations, respectively. Most genes in the left half of the circular genome have forward orientations and vice versa, consistent with other bacteria (Rocha 2004, Bentley and Parkhill 2004).
According to the annotation in the NCBI database, roughly > 70% of the conserved regions are protein-coding regions. Because the 12 genome sequences were determined by different research groups and gene prediction was carried out by those independent groups with different softwares, there are some variation in the annotation of coding genes in the conserved regions among the 12 strains (∼2,000 genes on average); there are a number of regions with almost no nucleotide variation, which are annotated as an open reading frame (ORF) in some strains but not in the others. In our analysis, a “gene” is defined when it is annotated as an ORF in at least 3 strains and its DNA sequence is conserved in all 12 strains without premature stop codon or frameshift mutation. According to these criteria, we found 1,788 “genes” in the well-aligned regions.
For these 1,788 genes, we applied basic population genetic analysis using the SITES software (Hey and Wakeley 1997), including calculating synonymous divergence and GC contents in the third positions of codons (GC3). To detect recombination break points, the four-gamete test of Hudson and Kaplan (1985) was used.
Results
Overview of the Pattern of Polymorphism
The 33 well-aligned regions were used in our polymorphism analysis. The regions in total consist of 2.3 Mb with 1,788 genes, which cover more than 80% of the entire S. aureus genome. There were 65,412 SNPs, 64,359 of which were biallelic. The average pairwise nucleotide difference was 0.00847 per site.
The nucleotide diversity at synonymous sites (πS) and GC contents at third position of the codon (GC3) in the 1,788 genes are plotted in green and magenta bars, respectively, in figure 1. GC3 is fairly constant, around 22.1 ± 4.0% across genes. The average synonymous nucleotide diversity is πS = 0.0247 ± 0.0237 with substantial local variations, most likely reflecting a heterogeneity in the time to most recent common ancestor (MRCA) due to homologous recombination (see below).
Using all synonymous sites, pairwise synonymous nucleotide distances were calculated, from which a neighbor joining (NJ) tree was constructed (fig. 2A). Based on the tree structure, the 12 strains were classified into 5 groups, named A, B, C, D, and E (table 1 and fig. 2A). All internal branches in the tree of the five groups were 100% supported by a bootstrap analysis. We observed large divergences (∼0.0525) between the ABC cluster and the other two, which largely explains πS for the sampled stains. The average pairwise divergences within each of the A, B, and C groups were < 0.0003, much lower than πS, the average of all pairwise comparisons. These three groups are relatively closely related, and indeed some of them are strongly related. For example, JH1 and JH9 in group C were isolated from a single patient (Mwangi et al. 2007), and they have almost identical sequences as expected. COL was isolated only about 50 years before USA300, and both strains belong to group A (Diep et al. 2006). On the other hand, MSSA476 and MW2 in group B were sampled in the United Kingdom and the United States (Holden et al. 2004), indicating that there is very recent migration between continents presumably following human immigrations.
FIG 2.

Genome-wide pattern of homologous recombination in Staphylococcus aureus. (A) An NJ tree of the 12 strains in S. aureus based on the distance matrix of all synonymous SNPs. The 12 strains were classified into five groups, named A, B, C, D, and E. (B) The proportions of different tree shapes. (C) The distribution of tree shapes across the genome, represented by colored bars. The colors correspond to those in (B).
Because our sample consists of only 12 strains, it is not clear if our data represent the pattern of SNPs in the entire species. To check this, we compared the phylogeny in figure 2A and that from the MLST project (Cooper and Feil 2006). According to Cooper and Feil (2006), thousands of strains worldwide were classified into two major clades. It was found that our groups A, B, and C (ten strains in total) belong to one and E (1 strain) belongs to the other (D was not included in their analysis), indicating our sample is strongly biased toward one of the two major groups. Thus, our work mainly describes the pattern of SNPs in one of the two major groups defined by Cooper and Feil (2006), which is well described by five representing lineages (A, B, C, D, and E). In the following analysis, we mainly focus on the relationship among these five lineages.
Homologous Recombination
If there is no recombination (i.e., strict clonality), all regions in the genome should follow a single tree. On the other hand, if recombination is active, we expect local variation in the tree shape. This can be applied not only to a panmictic population but also to a highly structured population (i.e., situation known as incomplete lineage sorting; Degnan and Rosenberg 2009). According to this logic, incongruence in the tree topology between local regions can be considered as evidence for recombination. It should be noted that the fact that the phylogenetic relationship of the five representative lineages in figure 2A is very well supported by a bootstrap analysis does not necessarily mean that all genomic regions follow this single tree. This is because the tree of figure 2A reflects only the genome-wide average of the phylogenetic relationship. Even when local trees are highly variable, with a large number of SNPs, internal branches on the genome-average tree can have high bootstrap values. Therefore, it is necessary to investigate local trees carefully in order to evaluate the role of recombination. Barring multiple mutations at same sites, recombination is the only cause of incompatibility among local trees.
We constructed NJ trees for the 1,788 genes, which were classified into several categories according to their tree shape. There were no informative sites in 344 genes, which were classified into the “no-resolution” category and excluded from the analysis.
It was found that 83% of the 1,444 informative trees are roughly consistent with the genome-average tree in figure 2A (fig. 2B). For these genes, there is almost no variation within each of the A, B, and C groups, and these three groups have a common ancestor without coalescing with D or E. Topologies with this pattern are called “major topologies,” whereas the remaining ones are referred to as “minor topologies.” The pattern within this A-B-C clade in the major topologies is highly variable. There are three possible topologies, ((A,B),C), ((B,C),A), and ((A,C),B), and we found their percentages to be 40.8:28.4:30.8 (fig. 2B). The proportion of ((A,B),C) was slightly higher than the other two, making the genome-average tree support ((A,B),C) in fig. 2A (see next section for details). We further found that these topologies distributed nearly uniformly (fig. 2C), indicating that the tree shapes have changed very frequently across genes because of extensive recombination between the ancestral lineages of the three groups. The common ancestor of ABC should next coalesce with either D or E, but their topology could not be determined because of the lack of an outgroup.
To emphasize the role of recombination, we confirmed that these observations are not caused by multiple mutations at the same sites. First of all, the level of divergence between A, B, and C is only ∼0.6%, and we found almost no sites at which more than two nucleotides are segregating (i.e., tri- and tetra-allelic sites). Because a high mutation rate creates a number of tri- and tetra-allelic sites, this observation is not consistent with the hypothesis of multiple mutations. Second, we found that the proportion of informative sites over all segregating sites (including singletons) is roughly 32%. From a simple simulation, we found that this observed proportion is much larger than explained by multiple mutations when the entire genome follows a single tree. In this simulation, assuming a strict clonal model for the A-B-C trio with no recombination, we set the phylogeny of A, B, and C such that the observed proportion of three types is consistent with the observation (40.8% for ((A,B),C), 28.4% for ((B,C),A), and 30.8% for ((A,C),B)) (i.e., a phylogenetic relationship consistent with fig. 2A). Then we placed mutations allowing multiple mutations. If we determine the mutation rate such that the total number of segregating sites is consistent with the observation, we found that the proportion of informative sites is only 3%. The observation (∼32%) is significantly larger than this expected value (P≈0; Fisher's exact test). Note that this statistical argument is conservative because the simulation assumed only two alleles at a single site, providing an upper bound for the proportion; the lower bound will be given when four symmetric alleles are allowed, and the real situation would be somewhere between the two bounds because there is a strong bias in the mutation rate between AT and GC. Third, we performed a bootstrap analysis for each of gene tree. It was found that for more than 90% of the gene trees, the branch that determines the relationship among A, B, and C (i.e., ((A,B),C) vs. (A,(B,C)) vs. ((A,C),B)) was supported with bootstrap value > 50% even when the statistical power is expected to be low due to a limited number of SNPs in each gene. Thus, these lines of evidence strongly show that the data are hardly explained by multiple mutations on a single tree and that recombination plays significant roles. We will come back to this problem later to further discriminate the effects of recombination and multiple mutations.
The patterns of minor topologies (247 genes) are highly variable, in which A, B, and C do not exhibit monophyletic topologies. Examples are illustrated in the “Minor topologies” category in figure 2B. There are two potential causes of generating minor topologies. One is that the ancestral lineage of D, for example, has received a segment from the ancestral population of C after the splits of A, B, and C, in which the branch of either D or E is placed within the ABC clade (see the fist topology in the Minor topology box in fig. 2B). The other is that the MRCA of A, B, and C are exceptionally old by some reason and they independently coalesce with D and E (see the last two topologies in the “Minor topology” box in fig. 2B). These genes with minor topologies also distribute uniformly across the genome (fig. 2C).
Although we used a gene as a unit in the above conventional analysis, recombination also occurs within coding regions. To further investigate the impact of recombination at a finer scale, the four-gamete test of Hudson and Kaplan (1985) was applied and the locations of recombination break points were inferred. The minimum number of break points to explain the genome-wide pattern of SNPs turned out to be 3,452, and the density is roughly 1 per 1.6 kb. We mapped these break points on the chromosome, and the results for five representative 10-kb regions are shown in figure 3. In each panel, the locations of inferred recombination break points and linage-specific SNPs and the spatial distribution of the level of synonymous polymorphism, πS, are presented on the map of coding genes (blue and orange arrows, representing forward and backward genes). For the locations of SNPs, those specific to A, B, and C (red, green, and blue, respectively) are shown in the upper row and those specific to D and E (cyan and magenta, respectively) are in the lower row. The distribution of πS is presented in the range from 0 to 0.1 in red and in blue if πS > 0.1. The gray boxes represents gaps in the alignment due to insertions/deletions (indels). An NJ tree is also shown for each gene if there is no signature of recombination within it; otherwise, the coding region is divided into subregions with no recombination break point within each of them, and an NJ tree is given for each subregion.
FIG 3.
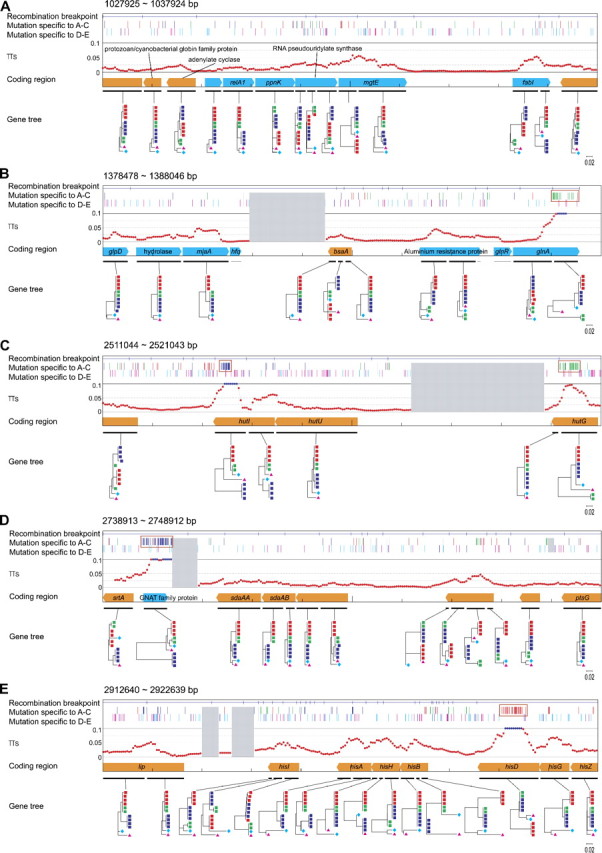
Genome-wide patterns of recombination and synonymous nucleotide polymorphism. The blue and orange arrows represent forward and backward genes, respectively. The name of each gene is given in italics when it is a specific gene, otherwise we provide the name of the gene family with significant homology. See text for details.
Figure 3A reresents the most typical pattern of the changes of tree shape across the chromosome. Most of the changes in topology are those among the three major topologies, ((A,B),C), ((B,C),A), and ((A,C),B), although there are a few minor topologies. In this region, πS ranges from 0 to 0.05, and five kinds of linage-specific SNPs distribute near evenly.
In figure 3B, there is a region with an exceptionally high level of πS due to a cluster of many B-specific SNPs (green bars in a red box), which is most likely because the lineage leading to B recently acquired a highly diverged sequence (perhaps from outside this species). Four additional such regions are shown in figures 3C–E. Thus, homologous recombination may occur not only within S. aureus but also between S. aureus and other species. However, looking at the pattern in the entire genome, there are only few such regions. The pattern shared by these regions is that divergence is extraordinarily elevated typically in a few hundred base pairs, which is much shorter than the average length of recombination blocks (1.6 kb).
Over the entire genome, the pattern of SNPs is blocky with clustering of SNPs with the same configurations (although only part of them are shown in fig. 3 because of space limitation). This blocky structure is not what is expected by a clonal model with a high mutation rate and no recombination because in such a situation, all configurations of SNP distribute randomly across the genome. This was statistically tested by using the relationship between A, B, and C, and the results are summarized in figure 4. First, we investigated clusters of the same type of informative sites. A cluster is defined as a contiguous segment of the same type of informative sites with no interruption by the other two types. Under the assumption of the presence of a single tree with no recombination, because the three types of informative sites distribute randomly, the expected distribution is easily obtained by a geometric distribution (represented by the broken line in fig. 4A). This expectation is compared with the observed distribution (bars in fig. 4A). Obviously, the observation has a larger average number of SNPs within clusters, and the difference is again very significant (P≈0; χ2 test).
FIG 4.
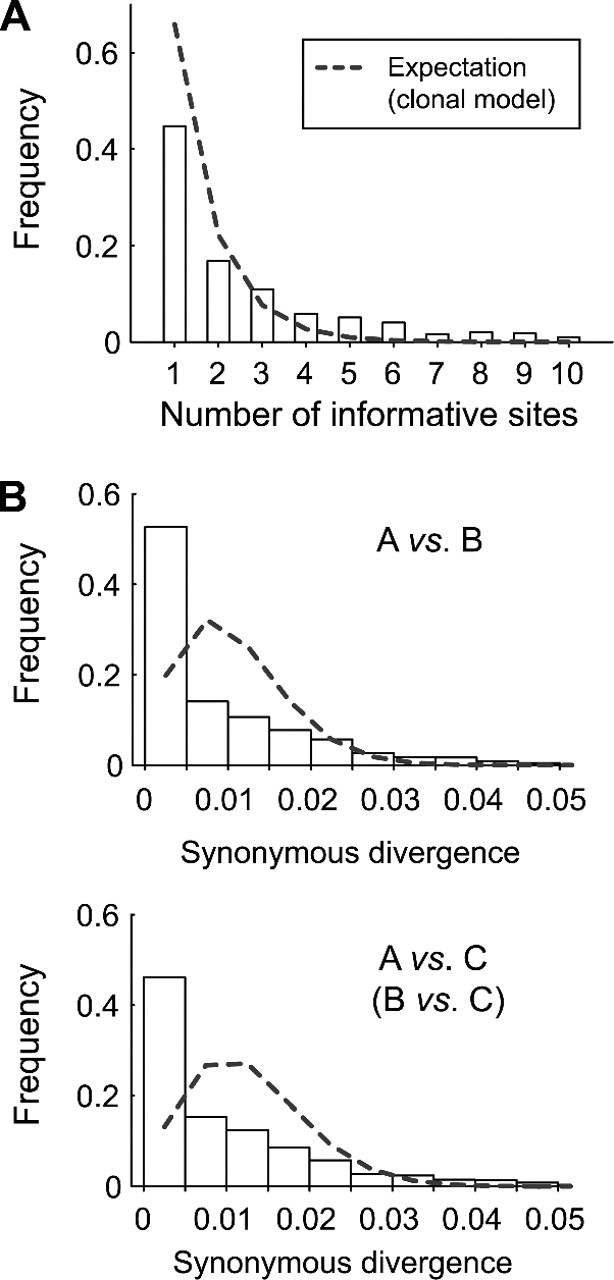
Testing a strict clonal model. (A) The number of informative sites with the same configuration in a cluster. (B) The synonymous divergences between A, B, and C. The observed distribution is shown in the bars with the expectations under the strict clonal model (gray broken line). The result for B versus C is not shown because it is almost identical to that of A versus C.
Next, we focused on the number of synonymous nucleotide differences between A, B, and C. For each gene, the A-B, A-C, and B-C synonymous divergences were computed and the density distributions are shown in figure 4B. The distributions for all three pairs are very similar; they are L-shaped with averages roughly 0.01 (although the average for the A-B pair is slightly lower than the others). We tested if this observation can be explained by the strict clonal model, in which it is predicted that the coalescent time is constant in the entire genome so that the number of synonymous differences should follow Poisson distributions. It was found that for all three cases, the observed distributions significantly differ from the Poisson distribution (P < 10 − 15; Kolmogorov–Smirnov test). The observed monotonically decreasing distributions have significantly large variances than predicted by the Poisson distribution or the strict clonal model. This should be because the variance includes the stochastic variance of the time to MRCA due to the coalescent process, in addition to the variance due to random placement of mutations (this part of the variance corresponds to that explained by the Poisson process). In contrast, as we will show later, the observed distributions fit very well to the prediction in which the coalescent process with recombination is taken into account (see below). Thus, we have shown several lines of evidence against the clonal model with no recombination. We therefore conclude that a high rate of recombination is needed to explain these observations.
Decay of Linkage Disequilibrium
We next searched for direct evidence for recombination. We focused on linkage disequilibrium (LD) between SNPs. It is well known that LD and physical distance between SNPs are expected to have a negative correlation when recombination is active. We first investigated r2, a commonly used measure of LD. r2 was computed for all pairs of SNPs. The data were binned into 100-bp windows according to distance, and the average r2 for each bin is plotted in figure 5A. In this analysis, we used the five representing strains (one from each group was randomly chosen). It was found that r2 decreases as the distance increases. This decrease of LD against distance can be considered as strong evidence for recombination. It was also found that r2 saturates in ∼10 kb at r2 = 0.5. The expectation of r2 with free recombination is 1/n in a panmictic population, where n is the sample size. In our analysis, the average r2 for long distance is 0.5, which is much larger than 1/n = 0.2, indicating that the five strains are not a sample from a single panmictic population. Thus, the result can be summarized that LD decays as increasing distance by recombination, but the genome-wide LD is elevated by population structure possibly due to geographic and/or physiological isolations between strains. Because the effects of recombination and population structure are confounding, it is difficult to evaluate the effect of recombination alone from this plot of r2.
FIG 5.
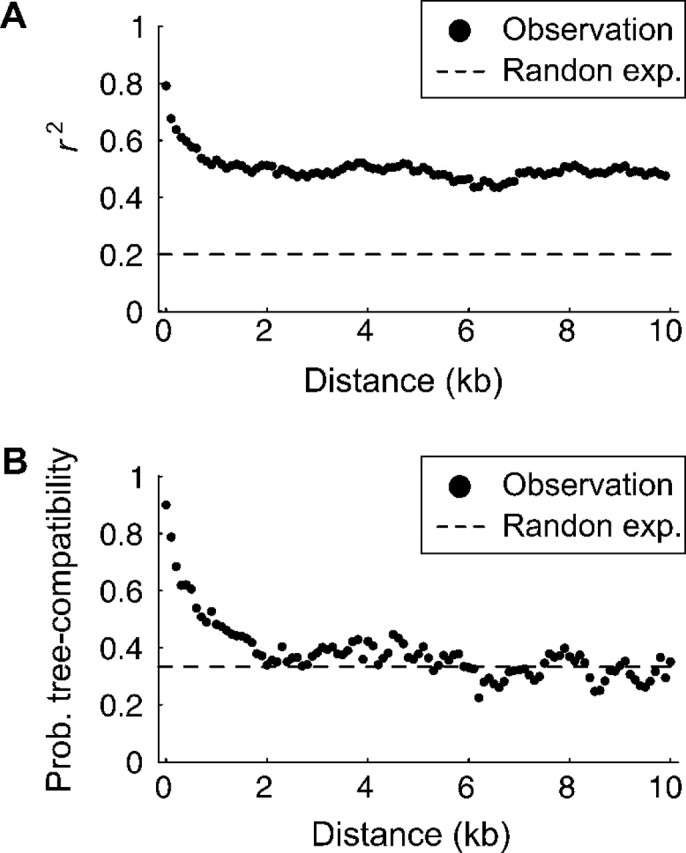
The decay of LD with distance. r2 and the probability of tree compatibility are plotted as a function of distance in kilobase up to 10 kb. The expectation when free recombination is shown by broken lines.
In contrast, if we focused on the relationship between A, B, and C, fortunately, we found that this problem is very minor. For this analysis, we used another measure of LD instead of r2 because the computation of r2 requires at least four strains. Representatives of the three groups, A, B, and C, provide the minimum sample size to detect recombination when an outgroup (D or E) is available. Following the method of Ruderfer et al. (2006), we used 5,289 SNPs at which the allelic configuration of {A, B, C, D, E}∈{{1,1,0,0,0},{0,1,1,0,0},{1,0,1,0,0}}, where 0 and 1 represent two variable nucleotides. For these sites, it is very likely that 0 is the ancestral allelic state; therefore, the tree shape at each SNP can be parsimoniously inferred (i.e., ((A,B),C), ((B,C),A), and ((A,C),B) are given for {1,1,0,0,0}, {0,1,1,0,0}, and {1,0,1,0,0}, respectively). It is expected that the probability of tree-shape compatibility for a pair of completely linked sites is 1 and this probability decreases as the recombination rate between the two sites increases. When the two sites are completely unlinked, the probability is expected to be 0.33 in a panmictic population. Thus, the decrease of the probability of tree-shape compatibility against distance is analogous to the decay of r2. Following the procedure for r2, the tree-shape compatibility was examined for all pairs of SNPs and the data were binned into 100-bp windows according to distance. Then the proportion of compatible SNP pairs for each bin is plotted in figure 5B. It was found that the tree-shape compatibility decreases dramatically and becomes close to the theoretical minimum in a panmictic population (0.33) when the distance is larger than 5 kb. The major difference from the plot of r2 is that the saturated level of tree-shape compatibility is close to the expectation under a panmictic population but not for r2. It can be concluded that the relationship between A, B, and C is very close to that for a sample with n = 3 from a panmictic population, so that we do not observe significant elevation of genome-wide LD in figure 5B. This near-panmictic situation provides excellent opportunity to quantitatively evaluate the role of recombination.
Before we estimate the recombination rate using the relationship between A, B, and C (see the next section), we further checked if the observed decay of LD can be explained by a clonal model. It should be noted that our tree compatibility analysis used only informative sites and singletons were excluded. An informative site is defined such that two alleles segregate with frequencies 2 and 2 in the alignment of A, B, C, and an outgroup (D or E). There are three possible types of informative sites, AB/CD segregation (red boxes), AC/BD segregation (blue boxes), and AD/BC segregation (green boxes), as illustrated in supplementary figure S3, Supplementary Material online, which is consistent with the typical pattern of informative sites in our observation (see also fig. 3). As mentioned above, in the S. aureus genome, the same type of informative sites tends to make a cluster (see fig. 4A), which makes the probability of tree compatibility nearly one for a small distance and it decreases as distance increases (fig. 5). In contrast, a strict clonal model predicts no correlation between LD and distance (i.e., broken lines in fig. 5). This is obvious because informative sites arise by multiple mutations at the same sites so that the three types distribute randomly across the genome. As expected, in the simulation data used for the previous analysis, we found that the probability of tree compatibility is flat at ∼0.33 (supplementary fig.S4, Supplementary Material online).
One might think that recombination from an external source might create a negative correlation because it could cause an elevation of local LD. As demonstrated in supplementary figure S4, Supplementary Material online, this is indeed true but not very relevant because our analysis excluded regions that likely experienced recombination from an external source. It is expected that such regions should exhibit a clear signature in the shape of local gene tree. For example, a local region with phylogenetic relationship (((A,D),(B,C)),E) suggests that the sequence of D (or A) was recently transferred to A (or D). As was demonstrated earlier, very small parts of the entire genome (roughly 8%) support such patterns of minor topologies (see figs. 2 and 3). In our LD analysis, because these regions were excluded, recombination with an external source cannot be the major explanation of the observed decay of LD. This argument does not completely rule out the contribution of recombination with an external source, but the quantitative effect should be very minor even when we missed signature of recombination with an external source for some regions and have included in the LD analysis.
Quantifying the Rate of Homologous Recombination
Our next task was to quantify the extent of recombination. More specifically, we set out to estimate the rate of homologous recombination and the length of integrated tract by homologous recombination. A possible strategy in population genetics is to fit a theoretical prediction to observe data, for example, decay of LD (Nielsen 2000, Haddrill et al. 2005, Plagnol et al. 2006). The theoretical prediction should be derived under the conditions of the correct demography because the decay of LD is strongly affected by demography (Ohta 1982, Slatkin 1994, Kruglyak 1999, McVean 2002, Stumpf and McVean 2003, Slatkin 2008). This posed a challenge to applying the theory directly to the LD plot for the five strains in figure 5A, but it would be easier for the tree compatibility plot in figure 5B because it has very little genome-wide elevation of LD so that there may not be strong population structure within it.
As a first approximation, we assumed that the A-B-C trio are a random sample from a single panmictic population. The theoretical prediction on the decay of tree compatibility was obtained by coalescent simulations. A homologous recombination event can be modeled such that the outcome is analogous to allelic gene conversion (Wiuf and Hein 2000, Didelot and Falush 2007). We take the parameter g to represent the initiation rate of a transferring event per site per generation and G to be the population rate, G = 2Ng, where N is the effective population size. The elongation of the converted tract starts at the initiation site and is terminated at a constant rate, q. Therefore, the tract length follows a geometric function with mean 1/q, and the two parameters G and q determine the decay function (Supplementary Material online). Under this setting, we changed G and q to investigate what values of these two parameters can produce a similar pattern to the observation in figure 5B. We found that with kb explains the observation very well (fig. 5B; see Supplementary Material online). Then the g/μ = G/θ ratio is estimated to be roughly 0.45 because θ was estimated to be 0.0156 from the average number of pairwise nucleotide differences.
Next, we tried to be more precise about the effect of demography as the above assumption of a single panmictic population may not be very correct. This is because the proportion of ((A,B),C) is slightly higher than those of ((A,C),B) and (A,(B,C)); accordingly the synonymous divergences between A and C and between B and C are slightly larger than that between A and B. It is interesting to point out that the situation of A, B, and C may be very similar to that of human, chimpanzee, and gorilla. It has been well known that these three species shared a large ancestral population, so that the coalescent pattern is different gene by gene and all three coalescent patterns, ((human,chimp),gorilla), ((human,gorilla),chimp), and (human,(chimp,gorilla)), arise. Because the speciation of human and chimpanzee is younger, the proportion of ((human,chimp),gorilla) is higher than the other two (Wu 1991, Li 1997, Chen and Li 2001). In the case of the A-B-C trio of S. aureus, because A and B are closely related, A, B, and C should correspond to human, chimp, and gorilla, respectively. This is a situation known as incomplete lineage sorting (Degnan and Rosenberg 2009), where a gene tree is not necessarily consistent with the species tree. When we observe various patterns in local gene trees, it is indicated that recombination between local regions are active (unless the mutation rate is extremely high, which is not the case here as demonstrated earlier).
Therefore, we employed a simple model illustrated in figure 6A, which is commonly applied to the human–chimp–gorilla case, and we estimated the ancestral population sizes and divergence times. According to the theories in Hudson (1983) and Takahata et al. (1995), we estimated the demographic parameters involved in the model (Supplementary Material online; see also Wu 1991, Chen and Li 2001). We found that the A-B-C trio shared a very large ancestral population; our maximum likelihood estimate of the population mutation rate is , where N2 and μ are the effective population size and mutation rate per site per generation, respectively, so that is estimated to be 5.3×10⁷ if μ = 10 − 10 is assumed (Drake 1991). was estimated to be 3.5×10⁶ generations, which corresponds to only 7% of the mean coalescent time in the ancestral population. After the split of AB and C, A and B shared an ancestral population of size N1, which was estimated to be , and the time of population split between A and B was estimated to be . Conditional on this estimated demography, the rate of homologous recombination was estimated. We found that with kb explains the observation very well (fig. 6B; see Supplementary Material online). Then the g/μ = G/θ ratio is roughly 0.6 because we have . The quantitative results are essentially identical to those assuming a single panmictic population.
FIG 6.

(A) The population model for the A-B-C trio used in this study. (B) The decay of LD as the proportion of compatible tree. The red line represents the expected decay of LD with the estimated rate, , kb. (C) The distributions of the synonymous nucleotide divergence between A and B (upper panel) and between A and C (lower panel). The expected distributions under the inferred demography are shown by red lines.
It should be noted that the observed distributions of synonymous divergences are also very well explained by the three-population model with the estimated parameters, although it was difficult to fit a strict clonal model (fig. 4). Figure 6C shows that the distributions of observed divergences between A, B, and C are in excellent agreement with the expectations under the inferred demographic model. Together with the excellent fit of LD decay in figure 6B, it is indicated that the inferred model well approximates the coalescent process among the A-B-C trio.
Discussion
By analyzing the genome-wide pattern of SNPs in S. aureus, we demonstrated that homologous recombination is abundant across the entire chromosome. We found signatures of recombination break points on average every 1.6 kb, which resulted in different phylogenetic relationship between regions. This level of recombination caused a dramatic decrease in LD (fig. 5), making phylogenetic relationships of two loci more than 10 kb apart essentially independent. We also showed that there were a number of short regions that exhibited strong evidence for recombination with distinct species (fig. 3). As recombination rate and sequence similarity are negatively correlated (Majewski and Cohan 1999, Fraser et al. 2007), homologous recombination should predominantly occur within species and recombination between different species should be relatively less frequent. However, if it occurs, a number of nucleotide variations are introduced into the species, indicating that this mechanism could play an important role in maintaining nucleotide variation within species. Even within S. aureus, we were able to detect regions that should have experienced recent homologous recombination between relatively distant strains, that is, between one of the A-B-C trio and the other two. Similar to recombination between different species, footprints of such recombinations were clear; the tree does not exhibit a monophyletic topology of A, B, and C.
Although these types of recombination have been drawn quite much attention in previous studies of bacterial homologous recombination (Milkman and Crawford 1983, Ochman et al. 2000, Dingle et al. 2005, Didelot et al. 2007), the major interest of this article is in recombination between very close strains. Because such recombination does not leave clear direct footprints, it has been difficult to elucidate the rate and contribution to genome evolution. Therefore, it was necessary to focus on indirect footprint, the decay of LD over distance, which is commonly used to estimate the recombination rate in eukaryotes. Still, estimating the rate of homologous recombination in a bacterial natural population is a challenging task mostly because a bacterial population is usually structured geographically and/or physiologically. Changes of population size also affect the decay of LD (Slatkin 1994, Kruglyak 1999, McVean 2002, Stumpf and McVean 2003, Slatkin 2008). Nevertheless, the situation for the A-B-C trio happened to be very similar to that for a random sample from a single panmictic population, so that we can apply conventional population genetic analyses. We successfully applied population genetic theories to estimate the homologous recombination between the A-B-C trio and estimated the ratio of the recombination to mutation rate to be 0.6 (i.e., G/θ or g/μ).
Our estimate of homologous recombination rate is much higher than previous estimates (0.067–0.1) (Feil et al. 2003, Vos and Didelot 2009), which is simply because previous estimates concern only recombinations with very clear footprints, that is, recombination between diverged strains (Feil et al. 1999, Feil et al. 2000, Didelot and Falush 2007, Didelot et al. 2010). In contrast, our estimate is for recombination between close strains with high sequence identity. Considering the well-recognized negative correlation between sequence identity and the rate of recombination, it may not be surprising that we obtained roughly one order of magnitude higher estimate of the homologous recombination rate.
The average length of recombination tracts was estimated to be > 10 kb. This estimation of long tract length is reasonable in species like S. aureus, in which phage-mediated transduction should be the major mechanism of recombination. (Novick et al. 2010). Empirical work has suggested that tracts of homologous recombination sometimes exceed 10 kb (occasionally > 100 kb) (Milkman et al. 1999, Robinson and Enright 2004).
Our results indicate that homologous recombination should be quite active between closely related strains, although it does not always cause drastic changes in DNA sequence. This hypothesis should not be unreasonable provided the nature of S. aureus. This human associate pathogen should have a high migration rate among strains, which is consistent with the fact that major clades including A, B, and C (i.e., CC8, CC1, and CC5) have worldwide distributions. A most likely scenario may be that the ancestral population of the A-B-C trio was one of the major strains of this species, and it has spread over the world with recent extensive migration from humans. In this expansion, the spread of the three strains might have been emphasized, and they became to be recognized as CC8, CC1, and CC5 (A, B, and C according to our notation). Our estimate of population split between the A-B ancestor and C is t2 = 3.5×10⁶ generations, which is obviously after the initiation of the expansion of modern humans. Although the generation time of this species in nature is unknown, if it is at most several days, t2 would be very recent, at most on the order of 100 years. Alternatively, there might be still frequent recombination between the A-B-C trio because a panmictic model also showed a reasonable fit to the data. A slight excess of regions with topology ((A,B),C) might be explained by a minor heterogeneity in the rate of recombination (i.e., perhaps heterogeneity in the rate of transduction).
Our results naturally give rise to two major questions. First, to what extent can our high estimate of homologous recombination be applied. It has been known that there is substantial variation between species in the rate of homologous recombination. Our estimate may be applied only to the A-B-C trio of S. aureus, but at least it implies that there would be a number of occasions where homologous recombination between closely related strains plays a significant role. More SNP data with sophisticated population genetic analyses are required to improve our understanding of the rates of bacterial homologous recombination.
The second major question would be what evolutionary role does homologous recombination play in a bacterial population? In eukaryotes, it is thought that recombination within a population is advantageous in facilitating the fixation of beneficial mutations and avoiding the hitchhiking of deleterious mutations. Does this theory apply to bacteria? In our SNP analysis, we found that there is almost no LD between SNPs that are more than 10 kb apart—a scenario similar to that in sexual eukaryotes. For example, in humans, although there are substantial amounts of local variation in the recombination rate, it seems that the typical distance at which r2 decreases to a half of its initial value is < 50 kb (International HapMap Consortium 2007). This distance may be shorter in Arabidopsis ( < 10 kb; Kim et al. 2007), yeast ( < 5 kb; Liti et al. 2009), and Drosophila (0.2 ∼ 0.3 kb; Ometto et al. 2005).
Thus, it seems that the level of decay of LD in S. aureus is not very different from those of eukaryotes, but it is a very difficult problem to compare the evolutionary role of homologous recombination in bacteria and that of meiotic crossing-over in eukaryotes because there are many differences in the mechanism of recombination and other population genetic parameters including population size. To address this question, we need further theoretical understanding on the behaviors of advantageous and deleterious mutations in a bacterial population, in which the effect of homologous recombination and population structure is seriously taken into account.
Supplementary Material
Supplementary figures S3 and S4 are available at Molecular Biology and Evolution online (http://www.mbe.oxfordjournals.org/).
We thank Olivier Tenaillon, Daniel Falush, and an anonymous reviewer for valuable comments. This work is primarily supported by National Institutes of Health and National Science Foundation grants to L.N.; H.I. S.T. is a Japan Society for the Promotion of Science (JSPS) Postdoctoral Fellow for Research Abroad. R.P.S. is also supported by a JSPS Predoctoral Fellowship.
References
- Altschul SF, Madden TL, Schäffer AA, Zhang J, Zhang Z, Miller W, Lipman DJ. Gapped BLAST and PSI-BLAST: a new generation of protein database search programs. Nucleic Acids Res. 1997;25:3389–3402. doi: 10.1093/nar/25.17.3389. [DOI] [PMC free article] [PubMed] [Google Scholar]
- Awadalla P. The evolutionary genomics of pathogen recombination. Nat Rev Genet. 2003;4:50–60. doi: 10.1038/nrg964. [DOI] [PubMed] [Google Scholar]
- Baba T, Bae T, Schneewind O, Takeuchi F, Hiramatsu K. Genome sequence of Staphylococcus aureus strain Newman and comparative analysis of staphylococcal genomes: polymorphism and evolution of two major pathogenicity islands. J Bacteriol. 2008;190:300–310. doi: 10.1128/JB.01000-07. [DOI] [PMC free article] [PubMed] [Google Scholar]
- Baba T, Takeuchi F, Kuroda M, et al. (14 co-authors) Genome and virulence determinants of high virulence community-acquired MRSA. Lancet. 2002;359:1819–1827. doi: 10.1016/s0140-6736(02)08713-5. [DOI] [PubMed] [Google Scholar]
- Bentley SD, Parkhill J. Comparative genomic structure of prokaryotes. Annu Rev Genet. 2004;38:771–792. doi: 10.1146/annurev.genet.38.072902.094318. [DOI] [PubMed] [Google Scholar]
- Chen FC, Li WH. Genomic divergences between humans and other hominoids and the effective population size of the common ancestor of humans and chimpanzees. Am J Hum Genet. 2001;68:444–456. doi: 10.1086/318206. [DOI] [PMC free article] [PubMed] [Google Scholar]
- Cooper JE, Feil EJ. The phylogeny of Staphylococcus aureus—which genes make the best intra-species markers? Microbiology. 2006;152:1297–1305. doi: 10.1099/mic.0.28620-0. [DOI] [PubMed] [Google Scholar]
- Darling AE, Miklós I, Ragan MA. Dynamics of genome rearrangement in bacterial populations. PLoS Genet. 2008;4:e1000128. doi: 10.1371/journal.pgen.1000128. [DOI] [PMC free article] [PubMed] [Google Scholar]
- Degnan JH, Rosenberg NA. Gene tree discordance, phylogenetic inference and the multispecies coalescent. Trends Ecol Evol. 2009;24:332–340. doi: 10.1016/j.tree.2009.01.009. [DOI] [PubMed] [Google Scholar]
- Didelot X, Achtman M, Parkhill J, Thomson NR, Falush D. A bimodal pattern of relatedness between the Salmonella Paratyphi A and Typhi genomes: convergence or divergence by homologous recombination? Genome Res. 2007;17:61–68. doi: 10.1101/gr.5512906. [DOI] [PMC free article] [PubMed] [Google Scholar]
- Didelot X, Falush D. Inference of bacterial microevolution using multilocus sequence data. Genetics. 2007;175:1251–1266. doi: 10.1534/genetics.106.063305. [DOI] [PMC free article] [PubMed] [Google Scholar]
- Didelot X, Lawson D, Darling A, Falush D. Inference of homologous recombination in bacteria using whole-genome sequences. Genetics. 2010;186:1435–1449. doi: 10.1534/genetics.110.120121. [DOI] [PMC free article] [PubMed] [Google Scholar]
- Diep BA, Gill SR, Chang RF, et al. (12 co-authors) Complete genome sequence of USA300, an epidemic clone of community-acquired methicillin-resistant. Staphylococcus aureus. Lancet. 2006;367:731–739. doi: 10.1016/S0140-6736(06)68231-7. [DOI] [PubMed] [Google Scholar]
- Dingle KE, Colles F, Falush D, Maiden MC. Sequence typing and comparison of population biology of Campylobacter coli and. Campylobacter jejuni. J Clin Microbiol. 2005;43:340–347. doi: 10.1128/JCM.43.1.340-347.2005. [DOI] [PMC free article] [PubMed] [Google Scholar]
- Drake JW. A constant rate of spontaneous mutation in DNA-based microbes. Proc Natl Acad Sci U S A. 1991;88:7160–7164. doi: 10.1073/pnas.88.16.7160. [DOI] [PMC free article] [PubMed] [Google Scholar]
- Emori TG, Gaynes RP. An overview of nosocomial infections, including the role of the microbiology laboratory. Clin Microbiol Rev. 1993;6:428–442. doi: 10.1128/cmr.6.4.428. [DOI] [PMC free article] [PubMed] [Google Scholar]
- Enright MC, Day NPJ, Davies CE, Peacock SJ, Spratt BG. Multilocus sequence typing for characterization of methicillin-resistant and methicillin-susceptible clones of. Staphylococcus aureus. J Clin Microbiol. 2000;38:1008–1015. doi: 10.1128/jcm.38.3.1008-1015.2000. [DOI] [PMC free article] [PubMed] [Google Scholar]
- Errington J, Bath J, Wu LJ. DNA transport in bacteria. Nat Rev Mol Cell Biol. 2001;2:538–545. doi: 10.1038/35080005. [DOI] [PubMed] [Google Scholar]
- Falush D. Toward the use of genomics to study microevolutionary change in bacteria. PLoS Genet. 2009;5:e1000627. doi: 10.1371/journal.pgen.1000627. [DOI] [PMC free article] [PubMed] [Google Scholar]
- Feil EJ, Cooper JE, Grundmann H, et al. (12 co-authors) How clonal is. Staphylococcus aureus? J Bacteriol. 2003;185:3307–3316. doi: 10.1128/JB.185.11.3307-3316.2003. [DOI] [PMC free article] [PubMed] [Google Scholar]
- Feil EJ, Maiden MCJ, Achtman M, Spratt BG. The relative contributions of recombination and mutation to the divergence of clones of. Neisseria meningitidis. Mol Biol Evol. 1999;16:1496–1502. doi: 10.1093/oxfordjournals.molbev.a026061. [DOI] [PubMed] [Google Scholar]
- Feil EJ, Maynard Smith J, Enright MC, Spratt BG. Estimating recombinational parameters in Streptococcus pneumoniae from multilocus sequence typing data. Genetics. 2000;154:1439–1450. doi: 10.1093/genetics/154.4.1439. [DOI] [PMC free article] [PubMed] [Google Scholar]
- Feil EJ, Spratt BG. Recombination and the population structures of bacterial pathogens. Annu Rev Microbiol. 2001;55:561–590. doi: 10.1146/annurev.micro.55.1.561. [DOI] [PubMed] [Google Scholar]
- Fraser C, Hanage WP, Spratt BG. Recombination and the nature of bacterial speciation. Science. 2007;315:476–480. doi: 10.1126/science.1127573. [DOI] [PMC free article] [PubMed] [Google Scholar]
- Gill SR, Fouts DE, Archer GL, et al. (29 co-authors) Insights on evolution of virulence and resistance from the complete genome analysis of an early methicillin-resistant Staphylococcus aureus strain and a biofilm-producing methicillin-resistant Staphylococcus epidermidis strain. J Bacteriol. 2005;187:2426–2438. doi: 10.1128/JB.187.7.2426-2438.2005. [DOI] [PMC free article] [PubMed] [Google Scholar]
- Griffith F. The significance of pneumococcal types. J Hyg. 1928;27:113–159. doi: 10.1017/s0022172400031879. [DOI] [PMC free article] [PubMed] [Google Scholar]
- Grubb WB. Genetics of MRSA. Rev Med Microbiol. 1998;9:153–162. [Google Scholar]
- Haddrill PR, Thornton KR, Charlesworth B, Andolfatto P. Multilocus patterns of nucleotide variability and the demographic and selection history of Drosophila melanogaster populations. Genome Res. 2005;15:790–799. doi: 10.1101/gr.3541005. [DOI] [PMC free article] [PubMed] [Google Scholar]
- Herron-Olson L, Fitzgerald JR, Musser JM, Kapur V. Molecular correlates of host specialization in Staphylococcus aureus. PLoS One. 2007;2:e1120. doi: 10.1371/journal.pone.0001120. [DOI] [PMC free article] [PubMed] [Google Scholar]
- Hey J, Wakeley J. A coalescent estimator of the population recombination rate. Genetics. 1997;145:833–846. doi: 10.1093/genetics/145.3.833. [DOI] [PMC free article] [PubMed] [Google Scholar]
- Holden MTG, Feil EJ, Lindsay JA, et al. (45 co-authors) Complete genomes of two clinical Staphylococcus aureus strains: evidence for the rapid evolution of virulence and drug resistance. Proc Natl Acad Sci U S A. 2004;101:9786–9791. doi: 10.1073/pnas.0402521101. [DOI] [PMC free article] [PubMed] [Google Scholar]
- Hudson RR. Testing the constant-rate neutral allele model with protein sequence data. Evolution. 1983;37:203–217. doi: 10.1111/j.1558-5646.1983.tb05528.x. [DOI] [PubMed] [Google Scholar]
- Hudson RR, Kaplan NL. Statistical properties of the number of recombination events in the history of a sample of DNA sequences. Genetics. 1985;111:147–164. doi: 10.1093/genetics/111.1.147. [DOI] [PMC free article] [PubMed] [Google Scholar]
- International HapMap Consortium. A second generation human haplotype map of over 3.1 million SNPs. Nature. 2007;449:851–861. doi: 10.1038/nature06258. [DOI] [PMC free article] [PubMed] [Google Scholar]
- Katayama Y, Ito T, Hiramatsu K. A new class of genetic element, staphylococcus cassette chromosome mec, encodes methicillin resistance in. Staphylococcus aureus. Antimicrob Agents Chemother. 2000;44:1549–1555. doi: 10.1128/aac.44.6.1549-1555.2000. [DOI] [PMC free article] [PubMed] [Google Scholar]
- Kim S, Plagnol V, Hu TT, Toomajian C, Clark RM, Ossowski S, Ecker JR, Weigel D, Nordborg M. Recombination and linkage disequilibrium in. Arabidopsis thaliana. Nat Genet. 2007;39:1151–1155. doi: 10.1038/ng2115. [DOI] [PubMed] [Google Scholar]
- Kruglyak L. Prospects for whole-genome linkage disequilibrium mapping of common disease genes. Nat Genet. 1999;22:139–144. doi: 10.1038/9642. [DOI] [PubMed] [Google Scholar]
- Kuroda M, Ohta T, Uchiyama I, et al. (37 co-authors) Whole genome sequencing of methicillin-resistant. Staphylococcus aureus. Lancet. 2001;357:1225–1240. doi: 10.1016/s0140-6736(00)04403-2. [DOI] [PubMed] [Google Scholar]
- Levin BR. The evolution of sex in bacteria. In: Michod RE, Levin BR, editors. 1988. The evolution of sex. Sunderland, (MA): Sinauer Associates, Inc. p. 194–211. [Google Scholar]
- Li WH. 1997 Molecular evolution. Sunderland (MA): Sinauer. [Google Scholar]
- Lindsay JA, Holden MTG. Staphylococcus aureus: superbug, super genome? Trends Microbiol. 2004;12:378–385. doi: 10.1016/j.tim.2004.06.004. [DOI] [PubMed] [Google Scholar]
- Liti G, Carter DM, Moses AM, et al. (26 co-authors) Population genomics of domestic and wild yeasts. Nature. 2009;458:337–341. doi: 10.1038/nature07743. [DOI] [PMC free article] [PubMed] [Google Scholar]
- Ma XX, Ito T, Tiensasitorn C, Jamklang M, Chongtrakool P, Boyle-Vavra S, Daum RS, Hiramatsu K. Novel type of staphylococcal cassette chromosome mec identified in community-acquired methicillin-resistant. Staphylococcus aureus strains. Antimicrob Agents Chemother. 2002;46:1147–1152. doi: 10.1128/AAC.46.4.1147-1152.2002. [DOI] [PMC free article] [PubMed] [Google Scholar]
- Maiden MCJ, Bygraves JA, Feil E, et al. (13 co-authors) Multilocus sequence typing: a portable approach to the identification of clones within populations of pathogenic microorganisms. Proc Natl Acad Sci U S A. 1998;95:3140–3145. doi: 10.1073/pnas.95.6.3140. [DOI] [PMC free article] [PubMed] [Google Scholar]
- Majewski J, Cohan FM. DNA sequence similarity requirements for interspecific recombination in Bacillus. Genetics. 1999;153:1525–1533. doi: 10.1093/genetics/153.4.1525. [DOI] [PMC free article] [PubMed] [Google Scholar]
- Maynard Smith J, Dowson CG, Spratt BG. Localized sex in bacteria. Nature. 1991;349:29–31. doi: 10.1038/349029a0. [DOI] [PubMed] [Google Scholar]
- McVean GAT. A genealogical interpretation of linkage disequilibrium. Genetics. 2002;162:987–991. doi: 10.1093/genetics/162.2.987. [DOI] [PMC free article] [PubMed] [Google Scholar]
- Milkman R, Crawford IP. Clustered third-base substitutions among wild strains of. Escherichia coli. Science. 1983;221:378–380. doi: 10.1126/science.6346486. [DOI] [PubMed] [Google Scholar]
- Milkman R, Raleigh EA, McKane M, Cryderman D, Bilodeau P, McWeeny K. Molecular evolution of the Escherichia coli chromosome. V. Recombination patterns among strains of diverse origin. Genetics. 1999;153:539–554. doi: 10.1093/genetics/153.2.539. [DOI] [PMC free article] [PubMed] [Google Scholar]
- Mwangi MM, Wu SW, Zhou Y, et al. (11 co-authors) Tracking the in vivo evolution of multidrug resistance in Staphylococcus aureus by whole-genome sequencing. Proc Natl Acad Sci U S A. 2007;104:9451–9456. doi: 10.1073/pnas.0609839104. [DOI] [PMC free article] [PubMed] [Google Scholar]
- Narra HP, Ochman H. Of what use is sex to bacteria? Curr Biol. 2006;16:R705–R710. doi: 10.1016/j.cub.2006.08.024. [DOI] [PubMed] [Google Scholar]
- Nielsen R. Estimation of population parameters and recombination rates from single nucleotide polymorphisms. Genetics. 2000;154:931–942. doi: 10.1093/genetics/154.2.931. [DOI] [PMC free article] [PubMed] [Google Scholar]
- Novick RP, Christie GE, Penadés JR. The phage-related chromosomal islands of gram-positive bacteria. Nat Rev Microbiol. 2010;8:541–551. doi: 10.1038/nrmicro2393. [DOI] [PMC free article] [PubMed] [Google Scholar]
- Ochman H, Lawrence J, Groisman E. Lateral gene transfer and the nature of bacterial innovation. Nature. 2000;405:299–304. doi: 10.1038/35012500. [DOI] [PubMed] [Google Scholar]
- Ohta T. Linkage disequilibrium with the island model. Genetics. 1982;101:139–155. doi: 10.1093/genetics/101.1.139. [DOI] [PMC free article] [PubMed] [Google Scholar]
- Ometto L, Glinka S, De Lorenzo D, Stephan W. Inferring the effects of demography and selection on Drosophila melanogaster populations from a chromosome-wide scan of DNA variation. Mol Biol Evol. 2005;22:2119–2130. doi: 10.1093/molbev/msi207. [DOI] [PubMed] [Google Scholar]
- Panlilio AL, Culver DH, Gaynes RP, Bannerjee S, Henderson TS, Tolson JS, Martone WJ. Methicillin-resistant Staphylococcus aureus in US hospitals, 1975–1991. Infect Control Hosp Epidemiol. 1992;13:582–586. doi: 10.1086/646432. [DOI] [PubMed] [Google Scholar]
- Plagnol V, Padhukasahasram B, Wall J, Marjoram P, Nordborg M. Relative influences of crossing over and gene conversion on the pattern of linkage disequilibrium in. Arabidopsis thaliana. Genetics. 2006;172:2441–2448. doi: 10.1534/genetics.104.040311. [DOI] [PMC free article] [PubMed] [Google Scholar]
- Rasko DA, Altherr MR, Han CS, Ravel J. Genomics of the Bacillus cereus group of organisms. FEMS Microbiol Rev. 2005;29:303–329. doi: 10.1016/j.femsre.2004.12.005. [DOI] [PubMed] [Google Scholar]
- Rayssiguier C, Thaler DS, Radman M. The barrier to recombination between Escherichia coli and Salmonella typhimurium is disrupted in mismatch-repair mutants. Nature. 1989;342:396–401. doi: 10.1038/342396a0. [DOI] [PubMed] [Google Scholar]
- Robinson DA, Enright MC. Evolution of Staphylococcus aureus by large chromosomal replacements. J Bacteriol. 2004;186:1060–1064. doi: 10.1128/JB.186.4.1060-1064.2004. [DOI] [PMC free article] [PubMed] [Google Scholar]
- Rocha EPC. The replication-related organization of bacterial genomes. Microbiology. 2004;150:1609–1627. doi: 10.1099/mic.0.26974-0. [DOI] [PubMed] [Google Scholar]
- Ruderfer DM, Pratt SC, Seidel HS, Kruglyak L. Population genomic analysis of outcrossing and recombination in yeast. Nat Genet. 2006;38:1077–1081. doi: 10.1038/ng1859. [DOI] [PubMed] [Google Scholar]
- Sabat AJ, Wladyka B, Kosowska-Shick K, Grundmann H, van Dijl JM, Kowal J, Appelbaum PC, Dubin A, Hryniewicz W. Polymorphism, genetic exchange and intragenic recombination of the aureolysin gene among Staphylococcus aureus strains. BMC Microbiol. 2008;8:129. doi: 10.1186/1471-2180-8-129. [DOI] [PMC free article] [PubMed] [Google Scholar]
- Slatkin M. Linkage disequilibrium in growing and stable populations. Genetics. 1994;137:331–336. doi: 10.1093/genetics/137.1.331. [DOI] [PMC free article] [PubMed] [Google Scholar]
- Slatkin M. Linkage disequilibrium—understanding the evolutionary past and mapping the medical future. Nat Rev Genet. 2008;9:477–485. doi: 10.1038/nrg2361. [DOI] [PMC free article] [PubMed] [Google Scholar]
- Speller DCE, Johnson AP, James D, Marples RR, Charlett A, George RC. Resistance to methicillin and other antibiotics in isolates of Staphylococcus aureus from blood and cerebrospinal fluid, England and Wales, 1989–1995. Lancet. 1997;250:323–325. doi: 10.1016/s0140-6736(97)12148-1. [DOI] [PubMed] [Google Scholar]
- Steinberg JP, Clark CC, Hackman BO. Nosocomial and community-acquired Staphylococcus aureus bacteremias from 1980 to 1993: impact of intravascular devices and methicillin resistance. Clin Infect Dis. 1996;23:255–259. doi: 10.1093/clinids/23.2.255. [DOI] [PubMed] [Google Scholar]
- Stumpf MPH, McVean GAT. Estimating recombination rates from population-genetic data. Nat Rev Genet. 2003;4:959–968. doi: 10.1038/nrg1227. [DOI] [PubMed] [Google Scholar]
- Takahata N, Satta Y, Klein J. Divergence time and population size in the lineage leading to modern humans. Theor Popul Biol. 1995;48:198–221. doi: 10.1006/tpbi.1995.1026. [DOI] [PubMed] [Google Scholar]
- Tenaillon O, Skurnik D, Picard B, Denamur E. The population genetics of commensal. Escherichia coli. Nat Rev Microbiol. 2010;8:207–217. doi: 10.1038/nrmicro2298. [DOI] [PubMed] [Google Scholar]
- Thompson JD, Higgins DG, Gibson TJ. CLUSTAL W: improving the sensitivity of progressive multiple sequence alignment through sequence weighting, position-specific gap penalties and weight matrix choice. Nucleic Acids Res. 1994;22:4673–4680. doi: 10.1093/nar/22.22.4673. [DOI] [PMC free article] [PubMed] [Google Scholar]
- Treangen TJ, Ambur OH, Tonjum T, Rocha EPC. The impact of the neisserial DNA uptake sequences on genome evolution and stability. Genome Biol. 2008;9:R60. doi: 10.1186/gb-2008-9-3-r60. [DOI] [PMC free article] [PubMed] [Google Scholar]
- Vos M, Didelot X. A comparison of homologous recombination rates in bacteria and archaea. ISME J. 2009;3:199–208. doi: 10.1038/ismej.2008.93. [DOI] [PubMed] [Google Scholar]
- Whittam TS, Ake SE. Genetic polymorphisms and recombination in natural populations of. In: Takahata N, Clark AG, editors. Escherichia coli. 1993. Mechanisms of molecular evolution. Sunderland (MA): Sinauer Associates, Inc. p. 223–245. [Google Scholar]
- Wiuf C, Hein J. The coalescent with gene conversion. Genetics. 2000;155:451–462. doi: 10.1093/genetics/155.1.451. [DOI] [PMC free article] [PubMed] [Google Scholar]
- Wu CI. Inferences of species phylogeny in relation to segregation of ancient polymorphisms. Genetics. 1991;127:429–435. doi: 10.1093/genetics/127.2.429. [DOI] [PMC free article] [PubMed] [Google Scholar]
Associated Data
This section collects any data citations, data availability statements, or supplementary materials included in this article.