Abstract
The advent of techniques with the ability to scan massive changes in cellular makeup (genomics, proteomics, etc.) has revealed the compelling need for analytical methods to interpret and make sense of those changes. Computational models built on sound physico-chemical mechanistic basis are unavoidable at the time of integrating, interpreting, and simulating high-throughput experimental data. Another powerful role of computational models is predicting new behavior provided they are adequately validated.
Mitochondrial energy transduction has been traditionally studied with thermodynamic models. More recently, kinetic or thermo-kinetic models have been proposed, leading the path toward an understanding of the control and regulation of mitochondrial energy metabolism and its interaction with cytoplasmic and other compartments. In this work, we outline the methods, step-by-step, that should be followed to build a computational model of mitochondrial energetics in isolation or integrated to a network of cellular processes. Depending on the question addressed by the modeler, the methodology explained herein can be applied with different levels of detail, from the mitochondrial energy producing machinery in a network of cellular processes to the dynamics of a single enzyme during its catalytic cycle.
Keywords: Systems biology, Kinetic and thermo-kinetic models, Mitochondrial energy transduction, Ordinary differential equations, Model parameters
1. Introduction
The emergence of “Systems Biology” signals the recognition of an integrative era in Biology, by contrast to the analytical period of biochemistry, cellular, and molecular biology (1–4). Systems biology encompasses a series of integrative approaches attempting to describe extensive changes in gene expression at the RNA, protein, or in the metabolite cellular makeup. In this regard, Systems Biology combines high-throughput technologies with a variety of quantitative methods, including computational modeling, in order to gain a more comprehensive understanding of systemic changes (5). Computational approaches include thermodynamic, kinetic, and stoichiometric models.
In the past, thermodynamic models have been extensively used for describing energy transduction in microbial physiology and mitochondrial energetics (6–10). The advantage of these earlier attempts was their simplicity and agreement with the fundamental principles ruling biological free energy transduction, i.e., the thermodynamic laws. However, the lack of mechanistic details accounting for many of the observed behaviors was a serious drawback. A kinetic approach allows mechanisms and regulatory properties to be specified. A direct link between the purely thermodynamic approach and the kinetic one described in this work, is that at steady state, and assuming that fluxes are linearly related with their respective driving forces, kinetic information is contained implicitly within the phenomenological coefficients in the Onsager equation (11).
Stoichiometric models can encompass large networks of biological processes, taking into account only the net stoichiometry of the transformations occurring during their operation (12–14). They will render a space of solutions for the system and as no explicit regulatory interactions are accounted for in this formulation, they will inform essentially about steady-state fluxes without any possibility of transient behavior or regulatory interactions.
Kinetic models can circumvent the limitations of both thermodynamic and stoichiometric, approaches since their description comprises regulatory interactions and kinetic mechanisms (15, 16). Limitations in the availability of quantitative kinetic information (e.g., maximal velocities, affinity constants) are among the drawbacks of the kinetic approach. However, when quantitative data is lacking, the model can be used as a tool for testing hypotheses concerning the mechanism(s) underlying an observed behavior. Kinetic models can also be phenomenological, i.e., not based on known or hypothetical chemical or transport reaction schemes. The power-law formalism (17) is an example of phenomenological kinetics, according to which the exponent of a power law represents the molecularity of a reaction, and accounts for the nonlinear dependence of fluxes on the concentration of intermediaries in a network (18). However, phenomenological models, by not considering a molecular mechanism specific to the reaction or the process being modeled, cannot be adequately tested and therefore have limited applicability.
Our approach consists of modular building of models, in which each module represents the known or hypothesized kinetic scheme available for that process (16, 19–21). In the modular approach of computational modeling, a module is an edge linking at least two nodes, in analogy with the topological view of networks conceived as a collection of edges and nodes exhibiting large-scale organization (22, 23). Our modular approach, however, takes account of functional and regulatory interactions of reconstructed networks, a decisive feature for analyzing the dynamics of complex physiological responses.
The modular approach of computational modeling also allows zooming in and out in a network of processes, this meaning that it is possible to choose how much detail the modeler will like to include. For instance, the tricarboxylic acid cycle (TCA cycle), or the glycolytic pathway may be described as set of reactions (8 or 10 reactions, respectively) or as a single aggregated step. Or a biochemical reaction may be written down considering the elementary kinetic steps of the catalytic cycle (24). New spatio-temporal organization properties appear when the modules are assembled into a unified scheme, that are considered emergent because they are unique, and thus could not had been anticipated from the properties of the isolated modules.
In the following sections, we describe the modular approach followed to build models as applied to the bio-chemistry and -energetics of mitochondrial function. The following set of criteria specify the reliability of a computational model (1) sound physicobiochemical basis, (2) ability to reproduce qualitative and quantitative experimental data, (3) provision of meaningful explanation of the simulated experimental behavior, and (4) predictive power (4). Along the build-up and testing of our models we emphasize how we account for these criteria of reliability.
2. Materials
- Basic biochemical information about the metabolic pathways and transport processes that are being modeled. This information can be obtained in biochemistry or physiology textbooks and some biochemical databases such as:
- KEGG, Kyoto Encyclopedia of Genes and Genomes (http://www.genome.jp/kegg/).
- BRENDA, a comprehensive enzyme information database (http://www.brenda-enzymes.org).
- Repository databases of models are a source for building our own model, constituting a good starting point for a beginner in the field of computational modeling. Many repositories of models are available, among them:
- EMBL-EBI European Bioinformatics Institute (http://www.ebi.ac.uk/biomodels-main/).
- The IUPS Physiome Proyect repository (http://models.cellml.org).
- ModelDB (http://senselab.med.yale.edu/ModelDB/).
-
Pathways Logic Models (http:///mcs.une.edu.au/~iop/Bionet/index.html).The models in these databases are stored according to a series of standards in language, annotations (e.g., SMBL, CellML) and are publicly available for download.
Experimental data to constrain the modules’ kinetics, usually obtained under in vitro conditions (see below), and data to constrain the assembled model are available as well.
Computational tools to work with the modules, such as Matlab (www.mathworks.com), Mathematica (http://www.wolfran.com), Maple (http://www.maplesoft.com). These tools may be used in the modular analysis, while the model is built up, or with the assembled model. Some useful computational modeling packages have been developed for, e.g., Matlab. Among them the graphical package MatCont (http://www.matcont.ugent.be) is able to simulate time-dependent behavior and calculate the stability and the parameter sensitivity of the model (25).
3. Methods
Clear identification of the level of organization (e.g., molecular, (sub)cellular, (multi)cellular) being modeled, which should suit the question(s) addressed by the model. An important decision is whether the model will take into account spatial coordinates. This choice will determine if the model will be represented by a set of ordinary differential equations (ODEs, the only independent variable is time), or by partial differential equations (with time and spatial coordinates in one, two, or three dimensions, act as independent variables). We restrict the scope of this chapter to the discussion of models of ODEs (15).
Identification of the set of processes of interest along with observables (experimental variables) that have to be included in the model. For example, if the interest is to model the movement of a noncharged compound across the mitochondrial inner membrane, we need to account for the concentration gradient of the compound itself, and the kinetics of the transporter if mediated by a carrier, or the diffusion coefficient if moving through simple diffusion. However, for modeling the movement of a charged molecule or ion, the contribution of other charged compounds participating in the transport process, along with the driving force (mitochondrial membrane potential, pH gradient), will need to be considered as well.
-
Choice of the kinetic expressions describing the rate of the processes identified in point (2). According to our modular approach, the rate expression that best represents what is known about the mechanisms underlying the behavior of a particular step, will be chosen. Kinetic models of transport processes may encompass, for example, the Goldman–Hodgkin–Katz voltage equation (26, 27), or the Fick’s laws of diffusion for noncharged molecules following a concentration gradient in a homogeneous medium (28).
Models will not always be mechanistically sound. Many processes have not been yet quantitatively and/or kinetically studied, to enable a mechanistic description. In such cases, an “ad hoc” equation may be written down, or a hypothetical functional relation. Savageau had proposed a power-law formalism postulating that each rate expression follows fractal kinetics where the order of the reaction with respect to each substrate/effector is the fractal dimension of the process (18). An attempt of a general formalism has been recently proposed, according to which kinetic models may be constrained using perturbation data (29).
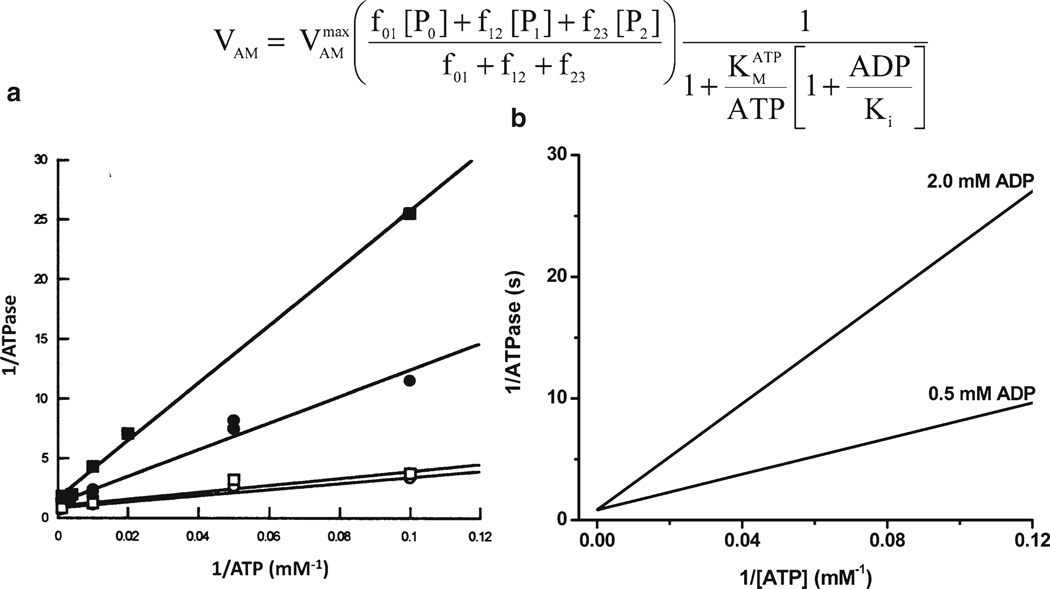
Using your favorite program (MatLab, Maple, Mathematica, etc.), the first step is to represent the kinetic behavior of a particular module as a function of each one of the variables participating in the rate equation (16, 20, 26, 30, 31). Critical in this procedure is to choose the right set of parameters, which in the case of, e.g., an enzyme following Michaelis–Menten kinetics, correspond to the KM values for each of the substrates, products, or effectors participating in the equation, and the Vmax value of the enzyme at saturating levels of all substrates and/or effectors. When available, a first hint about parameter values can be obtained from experimental data (32). These values may need some adjustment since the conditions in which they have been measured may not correspond to physiological ones (see Subheading 4). As an example of a mechanistic rate equation, we consider the ATP hydrolysis associated with the activity of the actomyosin ATPase in cardiac muscle myofibrils (Fig. 1). The kinetics of this enzyme was described according to a Michaelis–Menten mechanism (30). The saturable dependence of the enzyme activity on ATP concentration, represented by the Lineweaver–Burk plot of the experimental data (Fig. 1a), and the competitive ADP inhibition (Fig. 1a, b), justify the rate expression adopted for this process (see ref. 20).
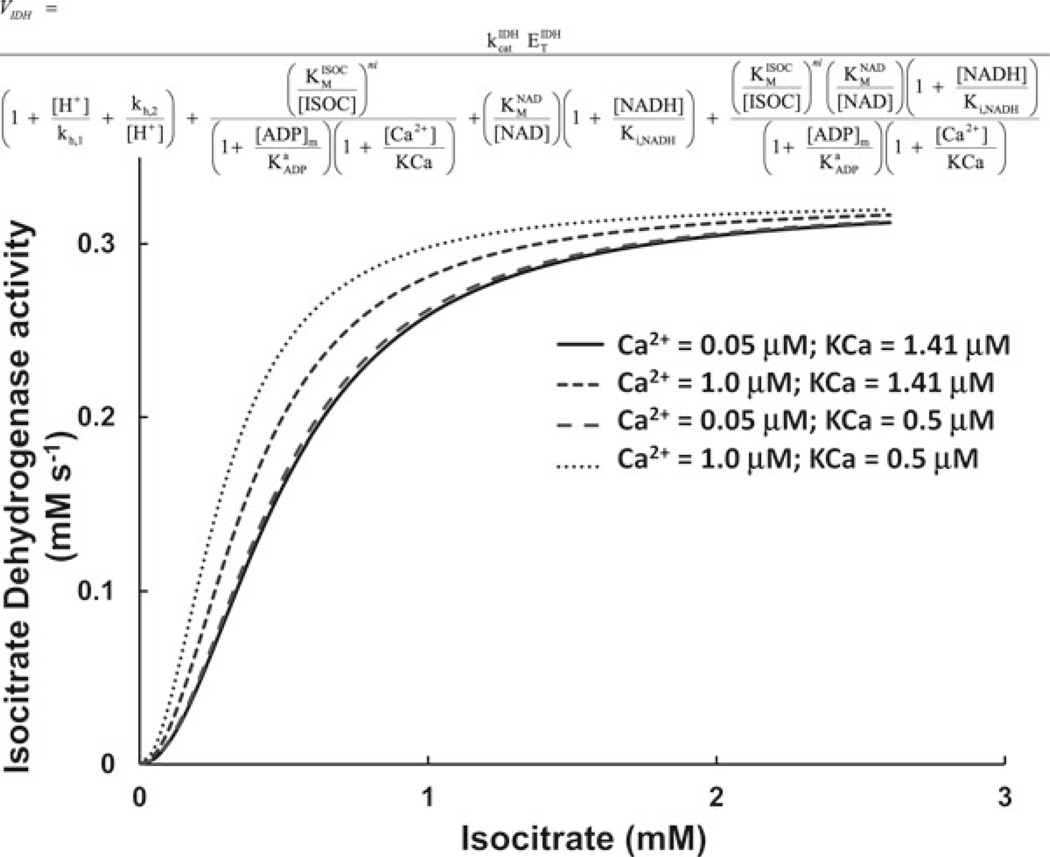
The sensitivity of the curve relating the rate of a given process, versus substrate or effector concentration to the values of the kinetic parameters, need to be studied. This will provide information about ways to modify a module behavior in the fully assembled model when the simulated output differs from experimental data. Studying the sensitivity of, e.g., the enzyme to parameters or variables also provides information about mechanisms through which its activity might be modulated in vivo. As an illustration of this point, Fig. 2 shows the plots of the rate of isocitrate dehydrogenase as a function of isocitrate at two levels of Ca2+ (enzyme activator) and for different values of the activation constant for Ca2+, KCa. The decrease in KCa, allowed to simulate the stimulation of TCA cycle flux, within physiological Ca2+ levels in the mitochondrial matrix, and at different stimulation frequencies in ventricular cardiomyocytes.
The individual behavior of a module should be compared with experimental data obtained in vitro, from the isolated activity measured either in crude extracts, permeabilized cells, tissues, or partially purified. Eventually, in vivo experimental data can be obtained for some biological processes, and used to test the equation standing for the description of that process. The agreement of theoretical and experimental data may be qualitative, quantitative or, at best, both.
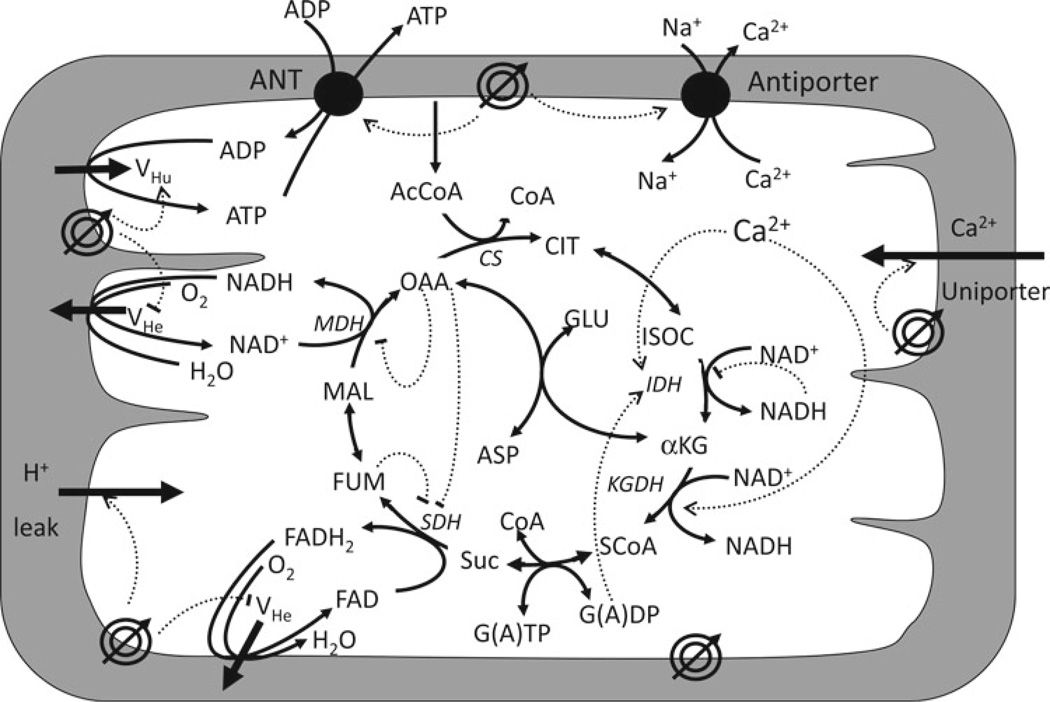
- The modules may be assembled once their individual behavior is proved satisfactory according to the above criteria 1–6. At this stage, it may be convenient to schematize the relationship among modules in a diagram such as shown in Fig. 3 for the model of mitochondrial energetic (16). The next step is to decide which of the variables participating in the equations will become state variables (i.e., whose values will inform the status of a system), and which will be adjustable parameters. For each state variables an ODE may be written with the following general scheme:
where M represents an intermediary (metabolite) in the system, or in a compartment thereof, Vproduction, the sum of the rates of all processes contributing M, Vconsumption, the sum of the rates of all processes consuming M, and Vtransport, the rates of the process that carry M inside or outside the compartment, or system being modeled. Table 1 shows the system of ODEs used in our model of mitochondrial energetics (16). Worth of notice at this stage is that the rate in ODEs may be subjected to scaling factors to account for volume or buffering effects. In Table 1, the buffering of the concentration of mitochondrial-free Ca2+ is taken into account by a constant factor, f [Table 1, (12)]. In the case that several compartments are considered, the volume ratio of the compartments has to be used to scale the rates if they belong to different compartments. In order to perform a simulation, we need to consider the format with which to write the differential equations. The best advice there is to take a sample model from the chosen simulation package, and modify it to include the specific ODE from your own model. Then, parameter files have to be assembled and linked or included, as well as a set of initial values of the state variables (initial conditions).
Another important issue is the choice of the integration algorithm that will be used to simulate the model’s behavior. Among the matters to be considered for choosing the integration algorithm, include the “stiffness” of the model, i.e., if the time scale in which different processes attain steady state is very different (>102 of the time unit used), usually milliseconds for channel gating events and seconds for mitochondrial energy transduction processes. If some rapid kinetics is being accounted for, such as fast ion-transport mechanisms, then “stiff” solvers may be required. Most ODEs solver packages have their own integrators. Matlab includes a series of integrators for nonstiff ODEs systems (ode45, ode23, ode113), or for stiff ones (ode15s, ode23s), to name but a few. Fourth-order Runge-Kutta and Euler are commonly used integrators for nonstiff equations.
Simulate the behavior of the assembled model as a function of time; first for a very short time (depending on the temporal resolution of the model may be a few ms, min, or hours) to see the stability of the model. To watch is whether some state variables take negative or very large or small values, or if they exhibit large deviations from physiological values. This step, which is the most experience-demanding one for the modeler, will provide key insights into which and how (extent and direction of change: increasing or decreasing) parameters may be adjusted to render reasonable simulations of the model behavior.
The next step is to run a model simulation till it reaches a steady state, i.e., where the derivatives of the state variables are less than 10−6 - 10−8 in relative terms (Δx / x). For the first simulations this may take a long time, depending on the initial values of the state variables.
At this stage, the modeler should start comparing the model output with experimental data (e.g., steady-state values of variables, or fluxes). Such comparison will lead to the fine-tuning of parameters, and the criteria utilized to do the parameter adjustment will need to be made explicit (see Note 2 on this subject).
-
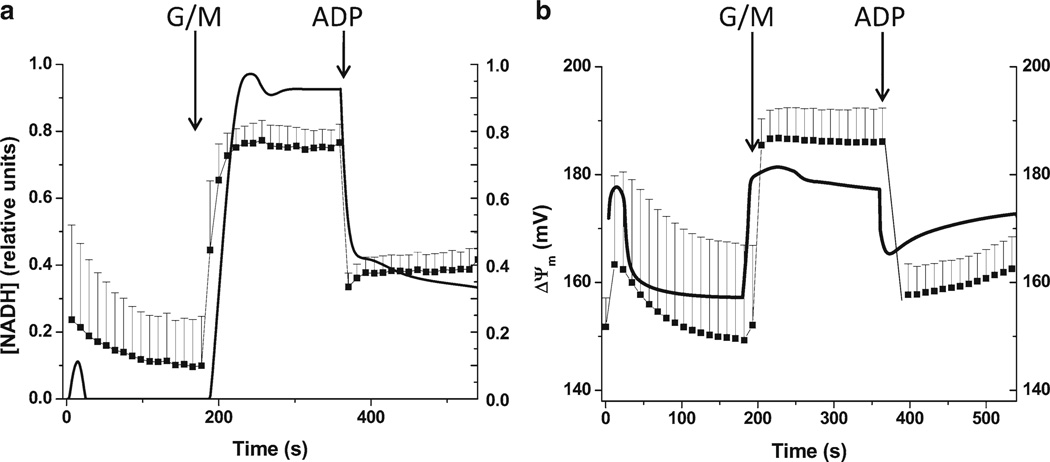
When available, experimental data from transient behavior should be compared with model simulations, obtained under parametric conditions that reproduce those in which the experiment was carried out. As an illustrative example, Fig. 4 shows the temporal profile of bioenergetic variables (NADH, ΔΨm) from isolated mitochondria. The similarity between the experimental and simulated behavior, qualitatively and quantitatively, indicates that the model accounts for the mechanisms operating in mitochondria when challenged with substrates, ADP, and uncouplers under in vitro conditions. The experimental–theoretical agreement achieved in the time-dependent behavior is of utmost importance since it is the performance of the model during transients that provides the most stringent test of its ability to represent physiological mechanisms. In the case of the ECME model (20), the dynamic response of mitochondrial energetics, following changes in workload conditions in heart trabeculae, was a main test of the model’s capacity to discriminate between competing hypotheses regarding the mechanisms underlying transient energy supply-demand matching. This is precisely what we mean by “explanatory power,” as mentioned in the introductory section.
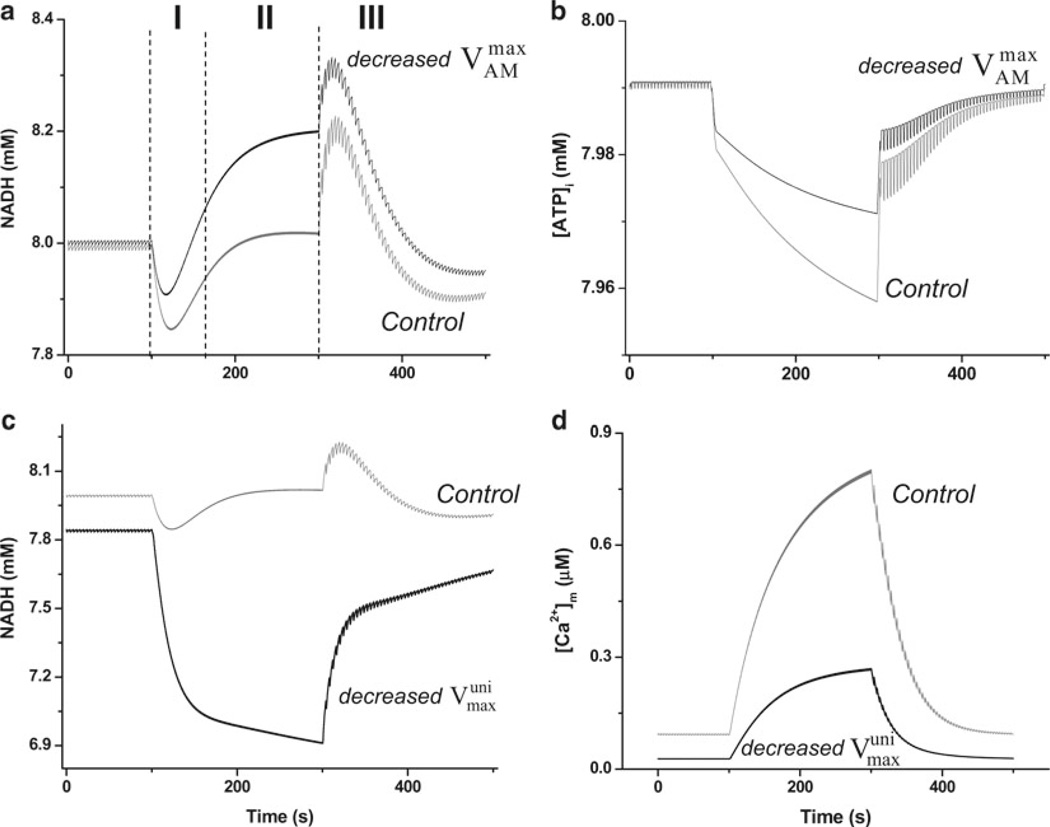
Utilizing the ECME model, the coupling between energy supply and demand, being hypothetically mediated by either ATP or Ca2+, was tested during transients in which the temporarily increased workload imposed on the cardiomyocyte was simulated by means of a higher stimulation frequency (20, 33) (Fig. 5). Under those conditions, the involvement of ATP was investigated by modifying the rate constant of ATP hydrolysis by the myofibrils, which represents the most conspicuous source of ATP consumption in the working state. Similarly, in order to investigate the involvement of Ca2+, the maximal transport rate of Ca2+ through the mitochondrial Ca2+ uniporter was decreased. In each situation, simulations of the temporal profile of mitochondrial NADH and Ca2+ were obtained, and conclusions drawn (see caption of Fig. 5).
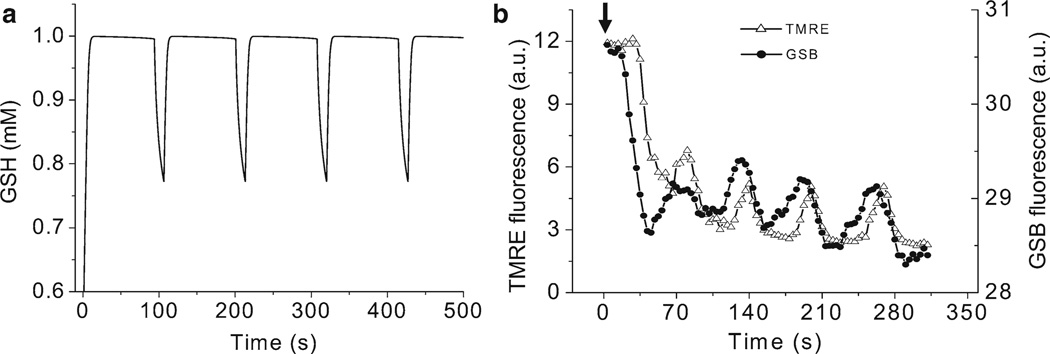
Regarding the “predictive power” of a model, it will be necessary to go beyond the traditional interpretation of the word “prediction.” Understandably, a model is able to predict if it can simulate a behavior that has not yet been observed. In the example shown in Fig. 6, the oscillatory behavior of reduced glutathione, GSH, was first observed in the model (Fig. 6a), and later confirmed experimentally (Fig. 6b) (31). Broadly speaking, if an integrated model is able to reproduce a behavior, whose mechanism was not intrinsically built in, even if such behavior was known beforehand, then it can be considered that the model is able to predict it.
Fig. 1.
Comparison of modeled and experimental behavior of myofibrillar ATPase. The figure shows (a) the Lineweaver–Burk representation of the experimentally measured rate of myofibrillar ATPase as a function of ATP concentration (36), whereas (b) shows the simulation of the experimental data after applying the equation on top of the figure. The competitive inhibition by ADP is shown by the addition of 0.5 or 2.0 mM ADP. The plots were produced with a maximal rate of the myofibrillar ATPase, , of 2.88 s−1, with P1, P2, and P3 representing the forms of tropomyosin that belong with an actomyosin complex with one, two or three cross-bridges, respectively. f01, f12, and f23, represent rate constants associated with the formation of cross-bridges. For parameter values and more detailed explanation see (20). (a) Is from Karatzaferi et al. (36) used with permission from the American Physiological Society.
Fig. 2.
Sensitivity of the plot of isocitrate dehydrogenase rate versus isocitrate to the level of Ca2+ and the Ca2+ activation constant. The activity of isocitrate dehydrogenase was studied as a function of the substrate, isocitrate, and at different levels of the activating Ca2+. To achieve a good reproduction of the stimulatory effect of Ca2+ as has been reported by (37), the Ca2+ association constant KCa (see equation on top of the plot) was varied to 0.5 µM with respect to the original level reported in ref. 16.
Fig. 3.
Schematic representation of the mitochondrial energetics model. Depicted are the mitochondrial electrophysiological and metabolic pathways, encompassing oxidative phosphorylation and matrix-based processes, along with their interactions, accounted for by the model. The tricarboxylic acid (TCA) cycle in the mitochondrial matrix is fed by acetyl CoA (AcCoA), which represents the point of convergence for fatty acids and glucose oxidation pathways, the two main fuels of the heart. The TCA cycle oxidizes AcCoA to CO2 producing NADH and FADH2 which provide the redox driving force for oxidative phosphorylation. NADH and FADH2 are oxidized by the respiratory chain and the concomitant pumping of protons across the mitochondrial inner membrane establishes an electrochemical gradient, or proton motive force (ΔµH), composed of electrical (ΔΨm) and proton (ΔpH) gradients. The ΔµH drives the phosphorylation of matrix ADP to ATP by the F1F0-ATPase (ATP synthase). The large ΔΨm of the inner membrane (−150 to −200 mV; matrix negative with respect to the cytoplasm) also governs the electrogenic transport of ions, including the cotransport of ATP and ADP by the adenine nucleotide translocator, Ca2+ influx via the Ca2+ uniporter and Ca2+ efflux via the Na+/Ca2+ exchanger (21). The model also accounts for the explicit dependence of the TCA cycle enzymes isocitrate dehydrogenase and α-ketoglutarate dehydrogenase on Ca2+. In this way, the rate of Ca2+ uptake by mitochondria is involved in membrane energization through the TCA cycle and oxidative phosphorylation. Key to symbols: ΔΨm is represented by the concentric circles with an arrow across located at the inner mitochondrial membrane. Reproduced from Cortassa et al. (16) with permission of Elsevier Science and Technology Journals in the format other book via Copyright Clearance Center.
Table 1.
Mitochondrial energetic model ordinary differential equations
| State variable | Differential equation | ||
|---|---|---|---|
| [ADP]m | (1) | ||
| ΔΨm | (2) | ||
| [NADH] | (3) | ||
| [ISOC] | (4) | ||
| [αKG] | (5) | ||
| [ScoA] | (6) | ||
| [Suc] | (7) | ||
| [FUM] | (8) | ||
| [MAL] | (9) | ||
| [OAA] | (10) | ||
| [ASP] | (11) | ||
| [Ca2+]m | (12) |
For further details concerning the definition of each rate see ref. 16
Fig. 4.
Time-dependent behavior of mitochondrial energetic variables during the state 4 → state 3 transition. Left panel shows the dynamic response of the endogenous fluorescent signal derived from NADH when a suspension of mitochondria were challenged by successive addition of glutamate plus malate (G/M, 5 mM each) or ADP (1 mM). Right panel shows the corresponding traces of ΔΔm as obtained from the calibrated ratiometric method with TMRM (tetramethylrhodamine methyl ester), and measured simultaneously with NADH. Experimental data are represented by filled squares, whereas the continuous (a) and dashed (b) lines stand for the simulated behavior obtained with the mitochondrial model of energy metabolism. Very recently, this model has been extended to comprise Na+, H+, Pi, and pH as state variables, including the regulation of mitochondrial activities by pH (40).
Fig. 5.
Effects of modifying the activities of myofibrillar ATPase and the mitochondrial Ca2+ uniporter in the ECME model energetic behavior following changes in workload (20). (a) Shows the NADH behavior when the ECME model was studied during transitions in pacing frequency. Before region I, 0.25 Hz pacing was applied whereas in regions I and II the pacing frequency was kept at 2 Hz and decreased back to 0.25 Hz in region III. The black trace shows the effect of lowering the maximal rate of ATP hydrolysis by the AM-ATPase to one half = (3.6 × 10⁻³ mM/ms) with respect to the control simulation (gray trace); all other parameters being identical in the two simulations. (b) Depicts the average profile of cytoplasmic ATP, ATPi, following changes in workload under control (gray trace) or decreased myofibrillar ATPase activity (black trace) according to the same protocol described in (a). (c) Exhibits the NADH profile obtained when the ECME model was studied with the same pacing protocol described in (a) but decreasing the maximal rate of the mitochondrial Ca2+ uniporter to one-tenth (black trace) = 2.75 × 10⁻³ mM/ms), with respect to the control (gray trace) simulation. (d) Shows the corresponding profile of mitochondrial Ca2+ when the uniporter activity was reduced in the simulation depicted in (c). Notice the strong reduction in [Ca2+]m accumulation (black trace) compared to the control simulation (gray trace). Reproduced from (20). with permission of Elsevier Science and Technology Journals in the format other book via Copyright Clearance Center.
Fig. 6.
Glutathione oscillations. (a) Displays the simulation of reduced glutathione (GSH) oscillations (100 s period) obtained under conditions of ΔΨm oscillations. (b) Shows the experimental demonstration of GSH oscillations (70-s period) recorded simultaneously with ΔΨm. Freshly isolated cardiomyocytes were loaded with 100 nM TMRM (ΔΨm probe) and 50 µM MCB (glutathione reporter) as described (31, 38). Oscillations were triggered after a localized laser flash, as previously described (39). Arrow indicates the timing of the flash. The decrease in the GSB signal corresponds to a drop in the GSH pool. Reproduced from (31) with permission of Elsevier Science and Technology Journals in the format other book via Copyright Clearance Center.
Table 2.
Comparison of Vmax values of enzymes in vivo and in vitro from isolated enzyme kinetics determinations
| Enzyme | Vvivo (mM/min) | Vmax (mM/min) |
|---|---|---|
| Isocitrate dehydrogenase | 271.0 | 1.8 |
| α-Ketoglutarate dehydrogenase | 7,608.0 | 4.8 |
| Malate dehydrogenase | 77.8 | 196 |
| Malic enzyme | 3.08 | 8.6 |
| Succinate dehydrogenase | 3.15 | 45 |
| Citrate synthase | 8.23 | 1,071 |
| Pyruvate dehydrogenase | 258.0 | 2.1 |
Data presented in ref. 34 where the Vvivo shows the in vivo values of maximal rates of enzyme obtained from NMR experiments with Dictyostelium discoideum TCA cycle dynamics, whereas Vmax stands for the purified enzyme maximal rate under in vitro conditions
Acknowledgments
This work was supported by grants from the National Institute of Health R37 HL 54598, P01HL081427, and R01 HL091923.
Footnotes
A crucial issue regarding the values of parameters and state variables concern the physical units used to represent them (19) see Chapter 2 there in. Modeling packages and numerical integrators work with numbers, disregarding their physical or physiological meaning. It is the modeler’s responsibility of providing equations with compatible units, which will render meaningful simulations. It is in modeler’s hands to interpret and give meaning to the output of a model. Experimental biologists, who sometimes do not trust quantitative computational models, often dismiss them with the expression “garbage in, garbage out”. Only a rigorous work with the layout and input of a model can disproof such claims. In our 20 years of work with various modeling approaches, we have seen many instances of units’ compatibility neglect that a simple troubleshooting could have exposed.
Regarding the issue of adjusting model parameters, the main inconvenient appears when different sources of data render very dissimilar values. Different sources, regarding organism or tissue from which the activity of interest has been isolated and/or determined, or different assay conditions, can provide widely different results vis-â-vis, e.g., maximal rates a system is able to sustain. As a parameter, the Vmax of a process is the most likely candidate to be adjusted had an inconsistency in the dynamic behavior of the assembled model been detected. Table 2 shows data from (34) regarding experimentally measured differences in Vmax values of TCA cycle enzymes between in vitro and in vivo determinations. It can be recognized that the differences may be up to three orders of magnitude as in the case of pyruvate, isocitrate, and α-ketoglutarate dehydrogenases as well as citrate synthase. These examples indicate that the in vitro condition provides an initial guess rather than an accurate figure of a parameter value. A more reliable estimation should be possible to obtain from parameter values which simulate more accurately experimental data with the computational model.
With the advent of Systems Biology, computational modeling is utilized to interpret and understand the physiological meaning of the information provided by high-throughput technologies such as genomics or proteomics. However, when multiple polypeptides are responsible of a single activity, such as in complex I in the electron transport chain, it is very difficult to predict what the effect on the activity will be when changes reported by proteomics in, e.g., polypeptide abundance of different magnitude and direction, are observed (see table 1 in (5)). In those cases, there are several criteria that should orient the course of action. First, it is necessary to know if the process in question exerts control over the fluxes in the network of interest (35). That means if the activity of the process is modulated, how much that will influence the fluxes throughout the network. This can be achieved with control analysis, in the biological system, by any of the methods developed to deal with the control of metabolic networks (35). In case the control is large, then, it will be necessary to estimate experimentally the impact of changing the subunit composition of the protein or complex on its activity. Another strategy is to test by model simulations which consequences bring about a parameter variation representing that activity. This is equivalent to applying control analysis to the model describing the metabolic network. If the effects of modulating the activity of interest are large, it would be justified to perform a detailed study regarding the influence of subunits composition on the activity of the enzyme or complex.
References
- 1.Kell DB. Theodor Bucher Lecture. Metabolomics, modelling and machine learning in systems biology – towards an understanding of the languages of cells 3 July 2005 at the 30th FEBS Congress and the 9th IUBMB conference in Budapest. FEBS J. 2006;273:873–894. doi: 10.1111/j.1742-4658.2006.05136.x. [DOI] [PubMed] [Google Scholar]
- 2.Winslow RL, Cortassa S, Greenstein JL. Using models of the myocyte for functional interpretation of cardiac proteomic data. J Physiol. 2005;563:73–81. doi: 10.1113/jphysiol.2004.080457. [DOI] [PMC free article] [PubMed] [Google Scholar]
- 3.Oltvai ZN, Barabasi AL. Systems biology. Life’s complexity pyramid. Science. 2002;298:763–764. doi: 10.1126/science.1078563. [DOI] [PubMed] [Google Scholar]
- 4.Aon MA, Cortassa S. Metabolic dynamics in cells viewed as multilayered, distributed, mass-energy-information networks. In: Jorde L, Little P, Dunn M, Subramaniam S, editors. Encyclopedia of genetics, genomics, proteomics and bioinformatics. New York: Wiley; 2006. [Google Scholar]
- 5.Yung CK, Halperin VL, Tomaselli GF, Winslow RL. Gene expression profiles in end-stage human idiopathic dilated cardiomyopathy: altered expression of apoptotic and cytoskeletal genes. Genomics. 2004;83:281–297. doi: 10.1016/j.ygeno.2003.08.007. [DOI] [PubMed] [Google Scholar]
- 6.Pietrobon D, Zoratti M, Azzone GF, Caplan SR. Intrinsic uncoupling of mitochondrial proton pumps. 2. Modeling studies. Biochemistry. 1986;25:767–775. doi: 10.1021/bi00352a005. [DOI] [PubMed] [Google Scholar]
- 7.Stucki JW. The optimal efficiency and the economic degrees of coupling of oxidative phosphorylation. Eur J Biochem. 1980;109:269–283. doi: 10.1111/j.1432-1033.1980.tb04792.x. [DOI] [PubMed] [Google Scholar]
- 8.Westerhoff HV, Lolkema JS, Otto R, Hellingwerf KJ. Thermodynamics of growth. Non-equilibrium thermodynamics of bacterial growth. The phenomenological and the mosaic approach. Biochim Biophys Acta. 1982;683:181–220. doi: 10.1016/0304-4173(82)90001-5. [DOI] [PubMed] [Google Scholar]
- 9.Tager JM, Wanders RJ, Groen AK, Kunz W, Bohnensack R, Kuster U, Letko G, Bohme G, Duszynski J, Wojtczak L. Control of mitochondrial respiration. FEBS Lett. 1983;151:1–9. doi: 10.1016/0014-5793(83)80330-5. [DOI] [PubMed] [Google Scholar]
- 10.Westerhoff HV, Van Dam K. Thermodynamics and control of biological free-energy transduction. Amsterdam: Elsevier; 1987. [Google Scholar]
- 11.Cortassa S, Aon MA, Westerhoff HV. Linear nonequilibrium thermodynamics describes the dynamics of an autocatalytic system. Biophys J. 1991;60:794–803. doi: 10.1016/S0006-3495(91)82114-2. [DOI] [PMC free article] [PubMed] [Google Scholar]
- 12.Cortassa S, Aon JC, Aon MA. Fluxes of carbon, phosphorylation, and redox intermediates during growth of saccharomyces cerevisiae on different carbon sources. Biotechnol Bioeng. 1995;47:193–208. doi: 10.1002/bit.260470211. [DOI] [PubMed] [Google Scholar]
- 13.Savinell JM, Palsson BO. Network analysis of intermediary metabolism using linear optimization. I. Development of mathematical formalism. J Theor Biol. 1992;154:421–454. doi: 10.1016/s0022-5193(05)80161-4. [DOI] [PubMed] [Google Scholar]
- 14.Christensen B, Nielsen J. Metabolic network analysis. A powerful tool in metabolic engineering. Adv Biochem Eng Biotechnol. 2000;66:209–231. [PubMed] [Google Scholar]
- 15.Segel LA. Mathematical models in molecular and cellular biology. New York: Cambridge University Press; 1980. [Google Scholar]
- 16.Cortassa S, Aon MA, Marban E, Winslow RL, O’Rourke B. An integrated model of cardiac mitochondrial energy metabolism and calcium dynamics. Biophys J. 2003;84:2734–2755. doi: 10.1016/S0006-3495(03)75079-6. [DOI] [PMC free article] [PubMed] [Google Scholar]
- 17.Savageau MA. Biochemical systems theory: operational differences among variant representations and their significance. J Theor Biol. 1991;151:509–530. doi: 10.1016/s0022-5193(05)80367-4. [DOI] [PubMed] [Google Scholar]
- 18.Savageau MA. Michaelis�Menten mechanism reconsidered: implications of fractal kinetics. J Theor Biol. 1995;176:115–124. doi: 10.1006/jtbi.1995.0181. [DOI] [PubMed] [Google Scholar]
- 19.Cortassa S, Aon MA, Iglesias AA, Lloyd D. An introduction to metabolic and cellular engineering. 1st edn. Singapore: World Scientific Publishers; 2002. [Google Scholar]
- 20.Cortassa S, Aon MA, O’Rourke B, Jacques R, Tseng HJ, Marban E, Winslow RL. A computational model integrating electrophysiology, contraction, and mitochondrial bioenergetics in the ventricular myocyte. Biophys J. 2006;91:1564–1589. doi: 10.1529/biophysj.105.076174. [DOI] [PMC free article] [PubMed] [Google Scholar]
- 21.Magnus G, Keizer J. Minimal model of beta-cell mitochondrial Ca2+ handling. Am J Physiol. 1997;273:C717–C733. doi: 10.1152/ajpcell.1997.273.2.C717. [DOI] [PubMed] [Google Scholar]
- 22.Jeong H, Tombor B, Albert R, Oltvai ZN, Barabasi AL. The large-scale organization of metabolic networks. Nature. 2000;407:651–654. doi: 10.1038/35036627. [DOI] [PubMed] [Google Scholar]
- 23.Almaas E, Kovacs B, Vicsek T, Oltvai ZN, Barabasi AL. Global organization of metabolic fluxes in the bacterium Escherichia coli. Nature. 2004;427:839–843. doi: 10.1038/nature02289. [DOI] [PubMed] [Google Scholar]
- 24.Hill TL, Chay TR. Theoretical methods for study of kinetics of models of the mitochondrial respiratory chain. Proc Natl Acad Sci USA. 1979;76:3203–3207. doi: 10.1073/pnas.76.7.3203. [DOI] [PMC free article] [PubMed] [Google Scholar]
- 25.Dhooge A, Govaerts W, Kuznetsov YA, Meijer HGE, Sautois B. New features of the software MatCont for bifurcation analysis of dynamical systems. Math Comput Model Dyn Syst. 2008;14:147–175. [Google Scholar]
- 26.Gunn RB, Curran PF. Membrane potentials and ion permeability in a cation exchange membrane. Biophys J. 1971;11:559–571. doi: 10.1016/S0006-3495(71)86235-5. [DOI] [PMC free article] [PubMed] [Google Scholar]
- 27.Hille B. Ion channels of excitable membranes. 3rd edn. Sunderland, MA: Sinauer; 2001. [Google Scholar]
- 28.Crank J. The mathematics of diffusion. 2nd edn. Oxford: Clarendon; 1975. [Google Scholar]
- 29.Tran LM, Rizk ML, Liao JC. Ensemble modeling of metabolic networks. Biophys J. 2008;95:5606–5617. doi: 10.1529/biophysj.108.135442. [DOI] [PMC free article] [PubMed] [Google Scholar]
- 30.Segel IH. Enzyme kinetics: behavior and analysis of rapid equilibrium and steady state enzyme systems. New York: Wiley; 1975. [Google Scholar]
- 31.Cortassa S, Aon MA, Winslow RL, O’Rourke B. A mitochondrial oscillator dependent on reactive oxygen species. Biophys J. 2004;87:2060–2073. doi: 10.1529/biophysj.104.041749. [DOI] [PMC free article] [PubMed] [Google Scholar]
- 32.Barthelmes J, Ebeling C, Chang A, Schomburg I, Schomburg D. BRENDA, AMENDA and FRENDA: the enzyme information system in 2007. Nucleic Acids Res. 2007;35:D511–D514. doi: 10.1093/nar/gkl972. [DOI] [PMC free article] [PubMed] [Google Scholar]
- 33.Brandes R, Bers DM. Simultaneous measurements of mitochondrial NADH and Ca(2+) during increased work in intact rat heart trabeculae. Biophys J. 2002;83:587–604. doi: 10.1016/S0006-3495(02)75194-1. [DOI] [PMC free article] [PubMed] [Google Scholar]
- 34.Wright BE, Butler MH, Albe KR. Systems analysis of the tricarboxylic acid cycle in Dictyostelium discoideum. I. The basis for model construction. J Biol Chem. 1992;267:3101–3105. [PubMed] [Google Scholar]
- 35.Cortassa S, O’Rourke B, Winslow RL, Aon MA. Control and regulation of mitochondrial energetics in an integrated model of cardiomyocyte function. Biophys J. 2009;96:2466–2478. doi: 10.1016/j.bpj.2008.12.3893. [DOI] [PMC free article] [PubMed] [Google Scholar]
- 36.Karatzaferi C, Myburgh KH, Chinn MK, Franks-Skiba K, Cooke R. Effect of an ADP analog on isometric force and ATPase activity of active muscle fibers. Am J Physiol. 2003;284:C816–C825. doi: 10.1152/ajpcell.00291.2002. [DOI] [PubMed] [Google Scholar]
- 37.Rutter GA, Denton RM. Regulation of NAD + -linked isocitrate dehydrogenase and 2-oxoglutarate dehydrogenase by Ca2+ ions within toluene-permeabilized rat heart mitochondria. Interactions with regulation by adenine nucleotides and NADH/NAD+ ratios. Biochem J. 1988;252:181–189. doi: 10.1042/bj2520181. [DOI] [PMC free article] [PubMed] [Google Scholar]
- 38.Aon MA, Cortassa S, Maack C, O’Rourke B. Sequential opening of mitochondrial ion channels as a function of glutathione redox thiol status. J Biol Chem. 2007;282:21889–21900. doi: 10.1074/jbc.M702841200. [DOI] [PMC free article] [PubMed] [Google Scholar]
- 39.Aon MA, Cortassa S, Marban E, O’Rourke B. Synchronized whole cell oscillations in mitochondrial metabolism triggered by a local release of reactive oxygen species in cardiac myocytes. J Biol Chem. 2003;278:44735–44744. doi: 10.1074/jbc.M302673200. [DOI] [PubMed] [Google Scholar]
- 40.Wei AC, Aon MA, O’Rourke B, Winslow RL, Cortassa S. Mitochondrial energetics, pH regulation, and ion dynamics: a computational-experimental approach. Biophys J. 2011;100:2894–2903. doi: 10.1016/j.bpj.2011.05.027. [DOI] [PMC free article] [PubMed] [Google Scholar]


