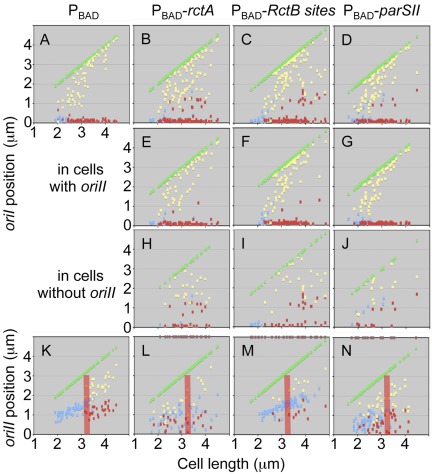
FIG 4 .
Effect of additional rctA on V. cholerae origin position. The plots show the positions of oriI and oriII foci in different cells. The cells were arranged according to increasing lengths along the abscissa. One pole is placed on the abscissa and the other is shown by green dots. Focus positions were measured from the pole placed on the abscissa. This pole was chosen because the nearest focus from this pole was closer than the nearest focus from the opposite pole. Small cells usually showed one focus (blue dot) and larger cells two foci (red and yellow dots). (A to J) Plots of oriI positions. Cells with oriI did not always show oriII foci. Cells with oriI irrespective of the presence of oriII foci are in panels A to D. These cells were separated into two groups: ones with oriII foci (E to G) and ones without oriII foci (H to J). (K to N) The plot of oriII positions. The pink bars mark the cell size at which two-focus cells appear in the wild type (K). The bars serve as a reference in other panels (L to N). The cell size at which the two foci appeared varied in the mutants. The brown dots on the top axis in panels L to N show the sizes of cells without oriII (these are the same cells as shown in panels H to J). The dots show that oriII-less cells can be of all possible sizes.

