Abstract
We analyze the deformability of individual red blood cells (RBCs) using SiCMA technology. Our approach is adequate to quickly measure large numbers of individual cells in heterogeneous populations. Individual cells are trapped in a large-scale array of micro-wells, and dielectrophoretic (DEP) force is applied to deform the cells. The simple structures of micro-wells and DEP electrodes facilitate the analysis of thousands of RBCs in parallel. This unique method allows the correlation of red cell deformation with cell surface and cytosolic characteristics to define the distribution of individual cellular characteristics in heterogeneous populations.
The ability to deform is essential for red blood cell (RBC) function in the circulation of capillary vessels. Cellular deformability in general is an important characteristic that defines the physiology of cells.1, 2 Alterations in membrane properties affect RBC deformation, but similarly, cytosolic alterations affect their ability to deform. In malaria-infected RBCs, the deformation was reported to be different depending on the intracellular developmental stage of the parasite.2, 3 While RBC deformability is a well recognized clinical parameter, deformation of other cells will likely be linked to clinical conditions. For example, abnormal cells have been reported to exhibit an altered deformability compared to normal cells. Benign and malignant cancer cells were reported to be significantly different in their deformability.4
Ektacytometry,5 slit rheometry,6, 7, 8 and similar technology9 have been used to expose the entire RBC population to a defined shear stress and correlate the average morphology to measure elongation of RBC. In filtration measurements,10 the transit time of an RBC suspension through a filter with micropores is measured. The ability to pass through these filters is related to the deformability of the RBC. These well-established measurements provide information on the deformability of the average RBC in a population, but are poorly able to define sub-populations with an altered deformability. Several methods have been developed to measure deformability of individual RBCs, including pipette aspiration,11 optical tweezers,12, 13, 14 dielectrophoresis,15, 16, 17 and atomic force microscopy.4, 18, 19 While powerful to characterize deformation of small numbers of individual cells, these approaches are inadequate to quickly measure large numbers of individual cells in heterogeneous populations. Defining the presence of abnormal cells in heterogeneous populations is important in physiology and pathology,20, 21 and the presence of subpopulations of altered RBCs is well recognized in RBC pathology.22, 23, 24 Moreover, the ability to correlate RBC deformability with other cellular measurements, either in cytosol or membrane, is important to better define the underlying mechanisms for altered deformability. While flowcytometry or (automated) microscopy can provide data for cell surface markers, correlation with deformation is not available.
We present a method based on the SiCMA (single-cell microchamber array) technology25 to analyze deformability of individual RBCs in a large heterogeneous population, allowing correlation of RBC deformation with cell surface and cytosolic characteristics. Individual RBCs are trapped in a large-scale array of micro-wells. Dielectrophoretic (DEP) force is applied to deform RBCs, and the shape changes are analyzed by software assisted image analysis. The simple structures of micro-wells and DEP electrodes facilitate the analysis of thousands of RBCs in parallel. In addition, fluorescence analysis can be used to measure cell surface and cytosolic markers. Histograms of deformation and fluorescence allow the identification of subpopulations of RBCs with altered characteristics.
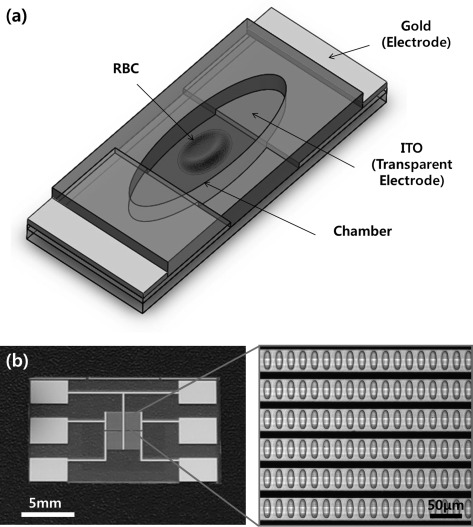
A schematic view of the chamber unit for the deformability measurement is shown in Figure 1a. The elliptical cylindrical micro-wells adapt the deformed shape of a single RBC. An electrical field to each micro-well is provided by a combination of transparent indium tin oxide (ITO) and gold patterns. ITO allows image analysis in visible light. However, the high electric resistance of ITO results in a voltage drop, and consequently, a non-homogeneous electric field across the micro-wells in the array is generated. A low resistance gold backbone delivers an identical electric potential to the ITO in each micro-well. The micro-wells were defined by a 10 μm thick SU8 layer, and the electrodes in the device were fabricated by deposition of 20/100 nm thick Cr/Au and 120 nm thick ITO layers on a pyrex glass wafer. Figure 1b shows the fabricated device with an enlarged view of the micro-well array. A DEP force, exerted by non-uniform AC electric fields, aligns the cells in the chambers and stretches each single cell. The length of the major (x) and the minor axes (y) is measured, and elongation index (EI) [%] = 100 × (x−y)/(x + y) is calculated to evaluate the deformation of each cell.
Figure 1.
The present SiCMA chip: (a) a schematic view of a chamber unit for deformability measurement and (b) Fabricated SiCMA chip with an enlarged view of chamber array. Black lines are gold backbone electrodes shown through inverted microscope.
To test our application, RBC deformation was measured of normal RBCs collected from healthy donors after obtaining informed consent, and RBCs from individuals with hereditary spherocytosis. The fabricated chips were attached to the bottom of a petri dish and placed in a CO2 chamber for 30 min. Subsequently, the chips were immersed in a buffered saline solution with 2% bovine serum albumin (BSA) (10 mM Hepes, pH 7.4, 190 mM sucrose, 20 mg/ml BSA, 8 mM NaCl, and 1 mM CaCl2). CO2 bubbles trapped in the chambers disappeared within a minute, due to high solubility of the CO2 gas in buffer. The presence of BSA greatly improved the prevention of non-specific binding of RBCs to chip material. The chips were washed again with buffered saline containing 0.2% BSA before use.
RBCs were fluorescently labeled with sulfo-NHS-LC-biotin and streptavidin-FITC conjugate, and the SiCMA chips were loaded with RBCs as described before.25 A drop of fluorescently labeled RBC suspension in Hepes-buffered saline (10 mM Hepes, pH 7.4, 190 mM sucrose, 2 mg/ml BSA, 8 mM NaCl, and 1 mM CaCl2) was applied to the fabricated devices attached in the petri dish. Up to 30% of the wells showed occupation by a single cell using this simple loading procedure. Single cell occupancy could be increased by the optimization of the chamber size and automated loading using a micro channel guide and syringe pumps. The image analysis software rapidly identified the wells with a single cell. Even at a modest single cell occupation, significant appropriate numbers of cells could be analyzed in parallel for their ability to deform in an electrical field.
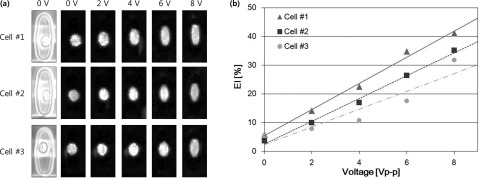
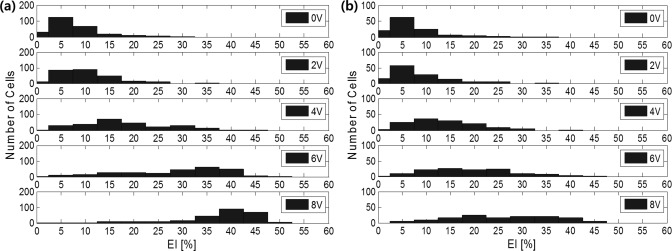
A 0-8 Vp-p, 20 MHz AC signal from a function generator (50 Ω of input impedance) was applied to the device and cell behavior was observed by inverted microscopy with either bright-field or fluorescence imaging. After loading, the RBCs were randomly oriented in the wells. Application of a 2 Vp-p, 20 MHz field switched at 1 Hz for 10 s aligned the cells between the electrodes with minimal stretching. Subsequently, the voltage was varied from 0-8 volts at 20 MHz. Figure 2a shows both bright-field and fluorescence images of RBCs in three typical micro-wells in electrical fields at 0, 2, 4, 6, and 8 V respectively. A custom, matlab based program26 was used to select chambers containing single cells and to measure the EI of each cell relative to the voltage applied. The EI increases as the applied voltage increases as shown in Figure 2b for the cells depicted in Figure 2a. Figure 3 shows the distributions of EIs of both samples at 5 different voltages. Also depicted as such the distribution of deformability is very different between normal and spherocytic cells. The EI at 8 V in the normal cell population showed a distribution with an average of 36.9% ± 9.4% (Table TABLE I.). The RBCs from the spherocytosis patient showed an EI of 25.6% ± 10.4%. Low deformability of red cells in hereditary spherocytosis is a well-recognized characteristic of this cytoskeletal disorder.27 In addition, the distribution of EI is much larger in spherocytosis, as compared to normal cells at higher electric fields reflecting the heterogeneous cell population as seen by microscopy. Ektacytometry is a well-defined method to characterize the average deformation of a red cell population under fluid shear stress and is used to diagnose hereditary spherocytosis. Table TABLE I. compares the measured results from our SiCMA chip and the measured deformation at 100 dynes/cm shear stress in an isotonic polyvinylpyrrolidone (PVP) solution by ektacytometry. Whereas a direct comparison between electrical and shear stress induced deformations is not possible, interestingly, both methods show deformability reductions around 30% for spherocytosis as compared to normal RBC. The present method can easily be combined with analyses that relate deformation to other parameters of the cell including membrane or cytosolic markers. It will also allow research that is focused on the deformation of protein filaments within cells. The isolated chambers containing single cell with the optically transparent substrate enables the adaption of any appropriate imaging technique or other combined methods. This in turn could provide a high-throughput data to link cell mechanics to molecular mechanics in heterogeneous populations.
Figure 2.
Typical measurement of single cell elongation in the chambers: (a) images of RBC at different voltages and (b) relation between EI and voltage.
Figure 3.
Measured deformability distribution of individual cells depending on applying voltage (V): (a) RBCs from a healthy volunteer and (b) RBCs from a patient with spherocytosis.
TABLE I.
Measured results of RBC deformability.
| Normal RBC | Abnormal RBC | |||
|---|---|---|---|---|
| Electrical voltage | SiCMA Chip | Ektacytometry a | SiCMA Chip | Ektacytometry a |
| 0 | 7.3 ± 5.0 | 7.3 ± 6.3 | ||
| 2 | 10.0 ± 5.5 | 8.5 ± 6.4 | ||
| 4 | 18.2 ± 8.8 | 0.53 | 13.6 ± 7.4 | 0.38 |
| 6 | 28.5 ± 10.7 | 19.4 ± 9.2 | ||
| 8 | 36.9 ± 9.4 | 25.6 ± 10.4 | ||
Data from ektactrometry were obtained at 290 mOsmol at 100 dynes/cm shear stress.
In conclusion, we present a method to analyze the deformability of single cells in heterogeneous cell populations. Moreover, each cell in the SiCMA chip can also be analyzed on membrane and cytosolic fluorescent markers. This will allow the correlation of such markers in each cell with the ability of the cell to deform. We envision that the SiCMA technology can be used in a variety of applications that would benefit from the ability to measure the distribution of cellular characteristics in complex RBC populations, important to define hematologic disorders.
Acknowledgments
This work was supported by the US National Institutes of Health Grants 5R21HL092535-02, 1R24TW008822-01, and 1R43GM090515-01 and by the Converging Research Center Program funded from the Ministry of Education, Science and Technology (2011K000864) in the Republic of Korea.
References
- Buehler M. J. and Yung Y. C., Nature Mater. 8, 175–188 (2009). 10.1038/nmat2387 [DOI] [PubMed] [Google Scholar]
- Mills J. P., Diez-Silva M., Quinn D. J., Dao M., Lang M. J., Tan K., Lim C. T., Milon G., David P. H., Mercereau-Puijalon O., Bonnefoy S., and Suresh S., Proc. Natl. Acad. Sci. U.S.A. 104, 9213–9217 (2007). 10.1073/pnas.0703433104 [DOI] [PMC free article] [PubMed] [Google Scholar]
- Suresh S., Spatz J., Mills J. P., Micoulet A., Dao M., Lim C. T., Beil M., and Seufferlein T., Acta Biomater. 1, 15–30 (2005). 10.1016/j.actbio.2004.09.001 [DOI] [PubMed] [Google Scholar]
- Li Q. S., Lee G. Y. H., Ong C. N., and Lim C. T., Biochem. Biophys. Res. Commun. 374, 609–613 (2008). 10.1016/j.bbrc.2008.07.078 [DOI] [PubMed] [Google Scholar]
- Clark M. R., Mohandas N., and Shohet S. B., Blood 61, 899 (1983). Available at: http://bloodjournal.hematologylibrary.org/content/61/5/899.long [PubMed] [Google Scholar]
- Shin S., Ku Y., Park M.-S., and Suh J.-S., Rheology 16, 85–90 (2004). Available at: http://www.cheric.org/research/tech/periodicals/view.php?seq=442213 [Google Scholar]
- Shin S., Ku Y., Park M.-S., and Suh J.-S., Cytometry. Part B, Clinical Cytometry 65, 6–13 (2005). 10.1002/cyto.b.20048 [DOI] [PubMed] [Google Scholar]
- Tomaiuolo G., Barra M., Preziosi V., and Cassinese A., Lab Chip 11, 449–454 (2010). 10.1039/C0LC00348D [DOI] [PubMed] [Google Scholar]
- Hardeman M., Goedhart P., and Dobbe J., Hemorheology 32, 121–121 (1994). 10.1016/0006-355X(95)91969-A [DOI] [Google Scholar]
- Kikuchi Y., Arai T., and Koyama T., Med. Biol. Eng. Comput. 21, 270–276 (1983). 10.1007/BF02478493 [DOI] [PubMed] [Google Scholar]
- Glenister F. K., Blood 99, 1060–1063 (2002). 10.1182/blood.V99.3.1060 [DOI] [PubMed] [Google Scholar]
- Lim C., Acta Mater. 52, 1837–1845 (2004). 10.1016/j.actamat.2003.12.028 [DOI] [Google Scholar]
- Lincoln B., Erickson H. M., Schinkinger S., Wottawah F., Mitchell D., Ulvick S., Bilby C., and Guck J., Cytometry. Part A 59, 203–209 (2004). 10.1002/cyto.a.20050 [DOI] [PubMed] [Google Scholar]
- Bambardekar K., Dharmadhikari A. K., Dharmadhikari J. A., Mathur D., and Sharma S., J. Biomed. Opt. 13, 064021 (2009). 10.1117/1.3037342 [DOI] [PubMed] [Google Scholar]
- Chen J., Abdelgawad M., Yu L., Shakiba N., Chien W.-Y., Lu Z., Geddie W. R., Jewett M. A. S., and Sun Y., J. Micromech. Microeng. 21, 054012 (2011). 10.1088/0960-1317/21/5/054012 [DOI] [Google Scholar]
- Thom F. and Gollek H., J. Electrost. 64, 53–61 (2006). 10.1016/j.elstat.2005.04.006 [DOI] [Google Scholar]
- MacQueen L. A., Buschmann M. D., and Wertheimer M. R., J. Micromech. Microeng. 20, 065007 (2010). 10.1088/0960-1317/20/6/065007 [DOI] [Google Scholar]
- Kirmizis D. and Logothetidis S., Int. J. Nanomed. 5, 137–145 (2010). 10.2147/IJN.S5787 [DOI] [PMC free article] [PubMed] [Google Scholar]
- Mahaffy R. E., Shih C. K., MacKintosh F. C., and Käs J., Phys. Rev. Lett. 85, 880–883 (2000). 10.1103/PhysRevLett.85.880 [DOI] [PubMed] [Google Scholar]
- Brehm-Stecher B., Microbiol. Molecul. 68, 538–559 (2004). 10.1128/MMBR.68.3.538-559.2004 [DOI] [PMC free article] [PubMed] [Google Scholar]
- Carlo D. D. and Lee L. P., Anal. Chem. 78, 7918–7925 (2006). 10.1021/ac069490p [DOI] [PubMed] [Google Scholar]
- Tse W. T. and Lux S. E., Br. J. Haematol. 104, 2–13 (1999). 10.1111/j.1365-2141.1999.01130.x [DOI] [PubMed] [Google Scholar]
- Hassoun H. and Palek J., Blood Rev. 10, 129–147 (1996). 10.1016/S0268-960X(96)90021-1 [DOI] [PubMed] [Google Scholar]
- Barabino G. A., Platt M. O., and Kaul D. K., Ann. Rev. Biomed. Eng. 12, 345–367 (2010). 10.1146/annurev-bioeng-070909-105339 [DOI] [PubMed] [Google Scholar]
- Lee W. C., Rigante S., Pisano A. P., and Kuypers F. A., Lab Chip 10, 2952–2958 (2010). 10.1039/c0lc00139b [DOI] [PubMed] [Google Scholar]
- See supplementary material at http://dx.doi.org/10.1063/1.4704923 for a MATLAB code of image analysis.
- Nakashima K. and Beutler E., Blood 53, 481–485 (1979). Available at: http://bloodjournal.hematologylibrary.org/content/53/3/481.long [PubMed] [Google Scholar]


