Abstract
We have previously used cryo-electron tomography combined with sub-volume averaging and classification to obtain 3D structures of macromolecular assemblies in cases where a single dominant species was present, and applied these methods to the analysis of a variety of trimeric HIV-1 and SIV envelope glycoproteins (Env). Here, we extend these studies by demonstrating automated, iterative, missing wedge-corrected 3D image alignment and classification methods to distinguish multiple conformations that are present simultaneously. We present a method for measuring the spatial distribution of the vector elements representing distinct conformational states of Env. We identify data processing strategies that allow clear separation of the previously characterized closed and open conformations, as well as unliganded and antibody liganded states of Env when they are present in mixtures. We show that identifying and removing spikes with the lowest signal-to-noise ratios improves the overall accuracy of alignment between individual Env sub-volumes, and that alignment accuracy, in turn, determines the success of image classification in assessing conformational heterogeneity in heterogeneous mixtures. We validate these procedures for computational separation by successfully separating and reconstructing distinct 3D structures for unliganded and antibody-liganded as well as open and closed conformations of Env present simultaneously in mixtures.
Keywords: Sub-volume averaging, membrane proteins, viral glycoproteins, dynamic molecular complexes
INTRODUCTION
The organization of proteins and other macromolecules into functional complexes is a central concept in biology. Some proteins are organized into regular and well-ordered, symmetric complexes as in the case of icosahedral viral assemblies (Zhang et al., 2008); others form large assemblies such as ribosomes that have a well-defined architecture built to accommodate subtle functional changes essential for function (Fischer et al., 2010; Frank et al., 1995), while yet others assemble at the surface of cell membrane to form higher order structures with varying symmetries (Kuhlbrandt et al., 1994; Ringler et al., 1999; Yonekura et al., 2003). However, the vast majority of protein complexes found in cells and viruses are heterogeneous, display variable composition, and are not naturally present in the well-ordered and well-behaved states that are essential for 3D structure determination using methods in structural biology such as X-ray crystallography, NMR spectroscopy or conventional cryo-electron microscopy (Bartesaghi and Subramaniam, 2009; Henderson, 2004). Thus, while these established technologies provide powerful tools to analyze the structures and structural changes in well-defined, well-ordered protein complexes, they leave a gap in their applicability for the analysis of the 3D architectures of macromolecular assemblies that are too heterogeneous, too large or too dynamic in their native, physiological context.
Cryo-electron tomography is an emerging tool for the 3D structural analysis of intact cells, viruses and large, heterogeneous macromolecular assemblies (Brandt et al., 2010; Dudkina et al., 2010; Liu et al., 2008; Murphy et al., 2006). Biological specimens can be prepared in near-native states for analysis by cryo-electron tomography by rapidly plunge-freezing them in liquid cryogens without the addition of fixatives and stains. When these specimens are thin enough (typically < 0.5 microns thick), their three-dimensional structure can be investigated by collecting a series of images spanning a wide tilt range, and by combining this information to generate a 3D image (or tomogram) of the imaged object. The structures of a large number of viruses, bacterial cells, the thin edges of several mammalian cells, and cell-virus contact zones have now been analyzed in near-native states using cryo-electron tomography, and have revealed a plethora of insights into the in situ organization of macromolecular assemblies (Borgnia et al., 2008; Carlson et al., 2010; Cyrklaff et al., 2007; Grunewald et al., 2003; Kurner et al., 2005; Liu et al., 2010; Loney et al., 2009; Patla et al., 2010). Individual tomograms can now be routinely obtained at resolutions as high as ~ 5 nm (Ben-Harush et al., 2010). When multiple copies of the complex of interest are present within tomograms, by carrying out 3D alignment and averaging of individual sub-volumes (Bartesaghi et al., 2008; Walz et al., 1997), the high frequency components of the noise are decreased. Thus, while each of the sub-volume densities is a relatively noisy representation of the structure of the relevant protein complex, the averaging of multiple accurately aligned sub-volumes can improve the signal-to-noise ratios (SNR) at higher resolutions significantly, and density maps with distinct features at resolutions as high as ~ 2 nm have already been achieved (Liu et al., 2008; White et al., 2010). Further, by fitting the known structures of subcomponents of larger protein complexes whose structures have been determined using crystallographic or NMR approaches, it is possible to obtain molecular models for the 3D architecture of these larger assemblies.
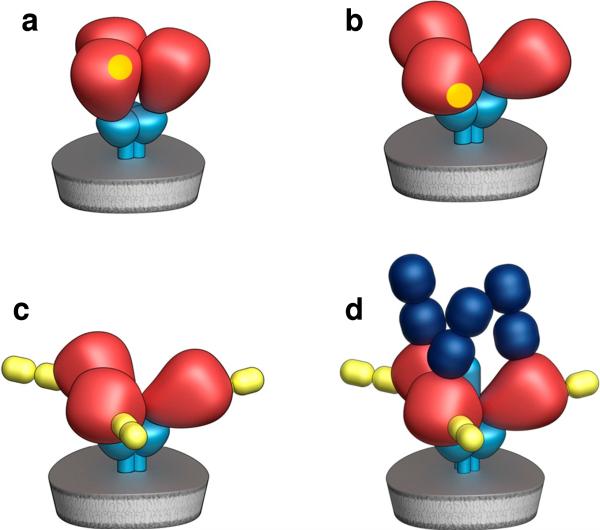
This type of approach, which combines the information available from cryo-electron tomography, 3D sub-volume averaging and X-ray crystallography has been used successfully to obtain molecular models for trimeric HIV-1 and SIV envelope glycoproteins (Env) (Liu et al., 2008; White et al., 2010). Although these recent advances have demonstrated success in obtaining averaged structures in situations when a single predominant conformation is present, it is important and useful to study the ability of these methods to derive 3D structures of multiple conformations when they are present simultaneously. For example, mixed populations could be present when only a fraction of Env is bound to neutralizing antibodies. Mixed populations could also be present in virus mixtures that display trimeric Env in distinct conformations, or when there is differential binding of the trimeric Env variants to cell-surface ligands such CD4 (Figure 1). Averaging can lead to improved visualization of structural features only if the sub-volumes are structurally homogeneous and properly aligned. Hence, the ability to achieve better separation of individual conformations by increasing the accuracy of 3D image classification will also be a critical step in improving the resolution of 3D structures of trimeric Env.
FIGURE 1.
Illustration of quaternary conformational states of trimeric Env. Cryo-electron tomographic studies of intact virions and soluble trimeric gp140 have identified distinct arrangements of Env with unliganded gp120 or when it is bound to antibodies or ligands such as sCD4. Schematic representations of four well-defined structures are shown, representing native trimeric Env in the closed conformation, which is observed on CD4-dependent viruses (a), trimeric Env in the open conformation, which is observed on CD4-independent viruses (b), trimeric Env in the open conformation, complexed with sCD4 (c) and trimeric Env in the open conformation complexed with sCD4 and a co-receptor binding site antibody such as 17b or 7D3 (d).
Several techniques for classification of simulated sub-tomograms and sub-tomograms collected under various experimental conditions have been proposed and used to derive structural information on macromolecular assemblies (Bartesaghi et al., 2008; Förster et al., 2008; Heumann et al.; Liu et al., 2008; Stolken et al., 2011; White et al., 2010; Yu and Frangakis, 2011). Here we focus our efforts on addressing a question of fundamental interest in the HIV field, which is the feasibility of separating distinct conformations of trimeric Env spikes present in a heterogeneous mixture. Two types of variability of particular interest are explored: one involving separation of mixtures of unliganded and antibody-bound Env, and another involving separation of distinct populations of unliganded trimeric Env. We evaluate the extent to which iterative classification and alignment methods complemented by simple post-processing, are able to achieve conformational separation, and demonstrate their application to distinguishing distinct conformational subpopulations present in mixtures containing unliganded and antibody-liganded trimeric HIV-1 Env complexes.
METHODS
Tomography
The image classification methods for analyzing conformational heterogeneity presented here were developed in part using the biological data for intact SIV viruses reported in White et al. (2011) and the data for soluble gp140 trimers presented in (Harris et al., 2011). Data collection and tomographic reconstruction to perform the separation of unliganded and 17b Fab-bound conformations in mixed populations of soluble spikes was carried out as previously described (Harris et al., 2011) using an FEI Polara G2 microscope, equipped with a Gatan GIF 2002 imaging filter and 2K × 2K CCD camera, at a pixel size of 4.1 Å in the specimen plane.
Automated sub-volume extraction and image processing
The methods presented here integrate and automate several stages for performing sub-tomogram averaging. At the 1st stage sub-volumes with trimeric Env spikes displayed on the surface of intact viruses are found and extracted. For that purpose, individual virions were manually located in the tomograms. The trimeric Env spikes were identified automatically in each tomographic volume using a cylindrically symmetric template. The search for spikes was confined to the external membrane of the virions and the longitudinal axis of the template was always normal to the membrane. In order to prevent biased selection and to better simulate real operation conditions, the same template was used to select spikes from all the data sets involving viruses. The initial orientation of the long axis of the spikes was set according to membrane normal and the remaining in-plane rotation was randomized to prevent the possibility of biased alignment. Except for selection of particles from tomograms of soluble SOSIP gp140 trimers, where there are no virions, this procedure was carried out for all the data sets described in this paper. The particles from tomograms of soluble SOSIP gp140 trimers were manually selected.
The alignment and averaging methods are an extension of algorithms we have previously reported to carry out iterative classification and 3D alignment in a way that accounts for the missing wedge of data that is inherent to limited angle tomography (Bartesaghi et al., 2008). In this approach, we find the optimal alignment between multiple sub-volumes by iterative classification and alignment involving a six parameter search (3 angles and 3 displacements) followed by 3D averaging of the aligned sub-volumes. The computational strategy is designed to overcome the high levels of noise in each sub-volume by performing dimensionality reduction and averaging sub-groups of spikes according to their similarity. The raw density profiles of trimeric spike volumes extracted from the surfaces of viral membranes are contained in sub-volumes comprising 100x100x100 voxels, corresponding to objects situated in a vector space with 106 dimensions. We first reduced the effective dimensionality of the space with an elliptical shape mask that surrounds the visible density of the spike. Following the rationale in Winkler and Winkler and Taylor (Winkler and Taylor, 1999), and Kirby et al (Kirby, 2001), a further dimensionality reduction was achieved for the purposes of classification by projecting the data onto the 16 highest order base vectors found by principal component analysis (PCA). Determination of the Euclidean norm between the 16-dimensional vectors representing the sub-volumes provides a quantitative measure of similarity and classification into sub-groups is achieved by performing k-means (MacQueen, 1967) analysis using this metric. After classification, averaged maps were calculated for each class. The averaged-map that had the highest correlation coefficient with respect to its 120 degree or 240 degree rotated version around the symmetry axis, was selected as a reference for aligning the rest of the classes. The newly aligned classes are then averaged together and the resulting map used as a reference to align all the individual sub-volumes. Using the resulting alignments, sub-volumes are subjected to the next round of classification and the entire process is repeated multiple times until the resulting average structure was unchanged, indicating convergence. In all cases presented here, the algorithm converged after 6 iterations. 3-fold symmetry was applied to the average reference maps from the third iteration onwards.
Generation of mixed data sets for testing the algorithm
In-silico mixtures of sub-tomograms were produced by combining the same number of sub-tomograms from two distinct data sets, each resulting in a different averaged structure. Prior to the preparation of in-silico mixtures, the sub-volumes from each sample were analyzed independently by performing six iterations of classification and alignment. At this stage, sub-volumes with low levels of similarity (typically the lowest 10%) to the reference map were discarded from the calculation of the average map in any given iteration. The rotation angle around the symmetry axis of the spikes (in-plane rotations) of the sub-tomograms was randomized prior to the iterative classification and alignment. This procedure was performed for mixed and unmixed data sets alike. The orientations of the spikes determined during the analysis of the unmixed data sets were deleted when mixtures were formed. Sub-volumes with reduced noise were obtained by the clustering and averaging of increasingly larger number of sub-tomograms. For that purpose, clusters of varying average numbers of individual sub-volumes (2-35) of the original sub-tomograms were produced. Clustering of the original sub-volumes was carried out by analysis of the reduced representation of the data set as described before. When more than two sub-volumes were combined, clustering was performed by application of k-means algorithm 2000 times for each clustering attempt and the solution with the smallest average cluster size was chosen. We note that equivalent, alternative methods of combining the multiple k-means runs, such as voting, could also be used for this purpose. Pairs of sub-volumes with the shortest distance were then grouped. With the exception of the analysis using “superspikes” (see Figure 6), clustering was carried out on the different data sets both prior to mixing and after six iterations of classification and alignment as described above. The orientation of the sub-volumes with reduced noise resulting from bundling and averaging of sub-tomograms was deleted by applying random rotation to each sub-volume in the mixture. The in-plane rotation angle of each sub-volume was randomized followed by a rotation around a random rotation vector. The extent of the random rotation was uniformly distributed between -5° and 5°.
FIGURE 6.
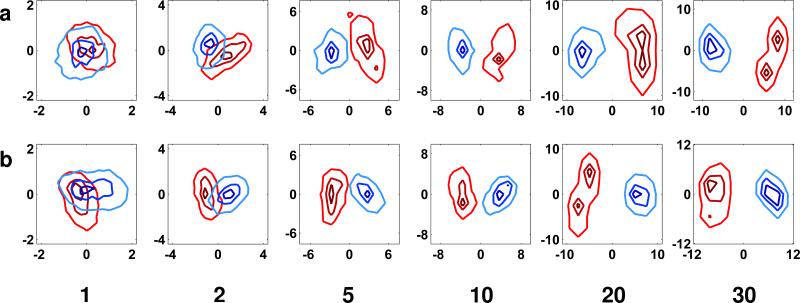
Improvement in separation of conformations with bundling of spikes. Contour plots of the 2D histograms for the scatter-clouds generated after iterative classification and alignment on mixtures, where the sub-tomograms from individual spikes were averaged together prior to alignment and classification to include 1 (control), 2, 5, 10, 20 or 30 spikes. The improvement in separation is observed both for mixtures of SIVmac239 and SIV CP-MAC data sets (see Figure 3b for comparison) and for the mixtures of SIVmac239 and SIV CP-MAC+sCD4+7D3 mixtures (see Figure 5b for comparison). The numbers beneath the panels indicate the average number of sub-volumes included in each “bundle”.
Determination of the signal-to-noise ratio
Prior to the analysis of the mixed data sets, each data set was analyzed separately to generate the averaged structures related to the known, unmixed, “ground truth” data sets. These structures were used as the templates for calculating the SNR of the aligned sub-volumes. The signal in each sub-volume was evaluated by calculating the absolute value of the projection of the 16 PCA components representing the sub-volume on the same vector representation of the averaged template structure. The length of the components of the vector representation of the sub-volume perpendicular to the template vector provides a measure of the noise. Averaging the SNR of all the sub-volumes in the mixed data set used for testing the automated analysis gave rise to the average SNR reported in the paper.
Separation of conformations
The success of the algorithm in terms of separating between the different conformations was evaluated and visualized using several different approaches described below:
1) Average mixing-ratio of neighborhoods
For each sub volume, the n-closest neighbors, measured by the Euclidian norm of the projection of the vector representation of the sub volumes on the first 16 PCA vectors were calculated. For each such neighborhood, the mixing-ratio, mr=1-abs(nA-nB)/(nA+nB), was calculated, with nA and nB representing the number of sub-volumes belonging to each conformation in the mixture. The average of all the mixing-ratios of all the sub-volumes of in a data set was calculated, and the average mr was obtained for neighborhoods with number of neighbors set to 5, 10, 15 or 20.
2) Average mixing-ratio of k-means classes
The aligned sub volumes were classified by k-means using the first 16 components of the PCA representation, and the average mixing-ratios of the classes was calculated. The number of the classes for k-means was set to 5, 10, 15 or 20.
3) Histograms of the projection of the “scatter” of sub-volumes
The distribution of the vector representation of the sub-volumes was visualized as a “scatter” plot by depicting the histograms resulting from projection of the vector representation of the sub volumes on each of the first 16 PCA vectors. The histograms are calculated separately for each component of the mixture and the overlap-integral between the two normalized-histograms was determined.
Two-dimensional (2D) histogram and 2D scatter plots of the projection of the vector representation of the sub volumes on the two PCA vectors that yielded the histograms with the smallest overlap were obtained. The overlap integral between the 2D histograms was also used as a measure for the success of the algorithm in separating the different conformations.
The 1D histograms, the 2D histograms and 2D scatter plots are illustrated as a set of 2x2 panels: the two 1D histograms were placed on the diagonal panels and 2D histograms were placed above and below the diagonal respectively. The nature and extent of structural differences of subpopulations present in the mixtures were analyzed with respect to different features of the histograms. All the numerical evaluation methods for the successes of the algorithm gave similar results, indicating that they all reflect the same geometrical properties of the multi dimensional scatter of the vector representation of the sub volumes. Among all the numerical evaluations of success, the average mixing-ratio of k-means classes with the number of classes set to 10 has the strongest relationship to the tested algorithm. Consequently, this value is reported in the paper. This type of analysis does not preclude a more rigorous study with advanced tools that use all the dimensions of the data; but constitutes a simple and intuitive tool that helps concisely convey our findings.
RESULTS
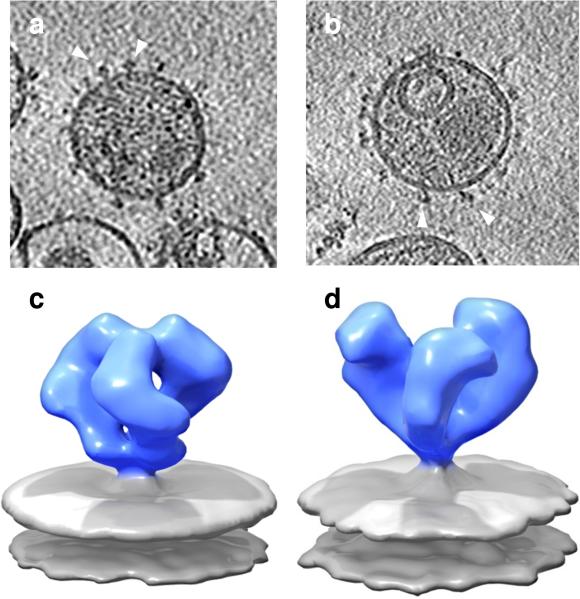
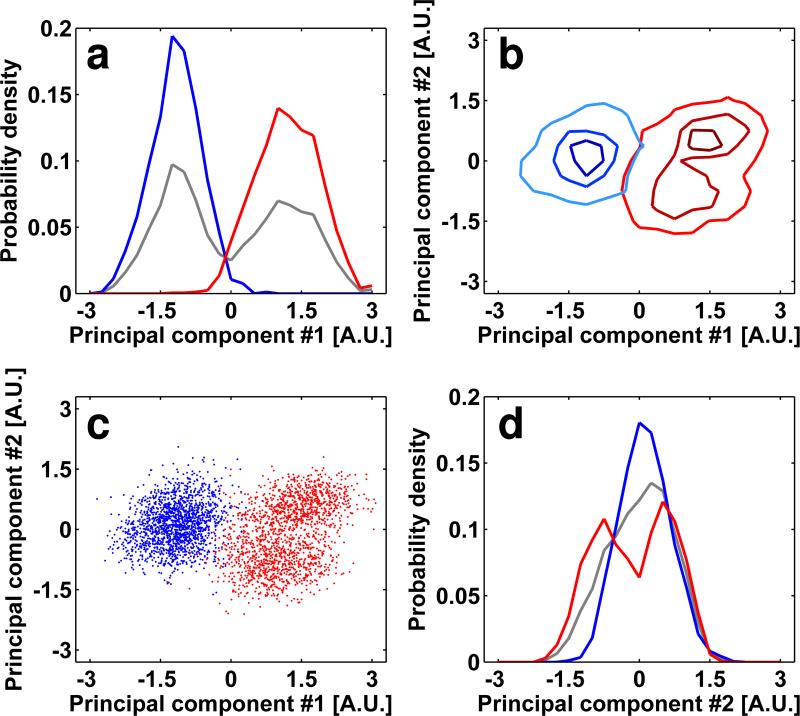
We first analyzed the effectiveness of separating two closely related structures of trimeric Env (also referred to in the text as the HIV “spike”): a closed quaternary conformation that is observed for CD4-dependent strains such as HIV-1 BaL, SIVmac239 and SIVmneE11S, and an open conformation that is observed in the CD4-independent strain SIV CP-MAC (Liu et al 2008, White et al 2010). In the closed conformation, the V1/V2 loop regions of gp120 are closer together at the apex of the trimer, while in the open conformation they are farther apart. The noise levels present in tomographic sub-volumes of single spikes are, however, too high to visually assess differences in conformation by examining the densities of single spikes (Figures 2a, 2b). However, when ~1000 spike sub-volumes are averaged, the differences in the architecture of closed and open conformations are readily apparent even in density maps at modest (~ 2 nm) resolution (Figures 2c, 2d), reflecting the predominant conformation of trimeric Env present in these preparations. To assess whether the closed and open conformations can be distinguished and averaged separately when they are present simultaneously, we combined equal numbers of sub-volumes corresponding to SIVmac239 (closed conformation) and SIV CP-MAC (open conformation) and carried out the above described iterative classification and alignment, treating them as a single data set. Analysis of the histograms (Figures 3a, 3d) obtained as described in the methods section (Figures 3b, 3c) shows a large overlap (~58%) of the two distributions. The two scatter-clouds occupy essentially the same region except at the very edges of the scatter-cloud. Thus, if these two conformations were present in a mixture, the structural similarities between them would be too high for this simple scheme to obtain reliable separation into the respective distinct conformations consistent with an average mixing ratio of 0.60. When the individual data sets are first aligned in the absence of each other and then aligned to a common reference and combined before the generation of a reduced dimensionality representation, the histograms of the distributions are largely non-overlapping, and the separation between the scatter-clouds is clear (Figures 4a-4d). The result from this exercise is that in the vast majority of the sub-volumes (~87%) there is enough signal to allow the map to be computationally associated to the correct conformation, provided that the alignments were obtained from processing each data set independently.
FIGURE 2.
Improvement in visualization of structural detail with averaging. Representative slices through individual cryo-electron tomograms of SIVmac239 (a) and SIV CP-MAC (b) virions. Trimeric Env spikes are distributed on the surface of the virus, as indicated by the white arrows. Alignment and 3D averaging of the density distribution of ~ 1500 individual spikes from SIVmac239 (c) or SIV CP-MAC (d) results in increased SNRs, allowing visualization of the density maps at resolutions of ~ 20 Å.
FIGURE 3.
Analysis of the reduced dimensionality representation of the SIVmac239/SIV CP-MAC spike mixture after iterative alignment and classification. Panels correspond to the scatter-cloud representation (see Methods for details) generated after conducting six iterations of classification and alignment on the mixed data set. Lines and markers related to the SIVmac239 sample are colored red and line and markers related to the SIV CP-MAC sample are blue. Gray lines in (a,d) are the normalized histograms of all of the data represented in the mixture. After six iterations of alignment and classification the overlap between the point-clouds of the SIVmac239 and SIV CP-MAC sub-volumes is ~57%.
FIGURE 4.
Analysis of the reduced dimensionality representation of the SIVmac239/SIV CP-MAC spike mixture after independent iterative alignment and classification of each dataset. Panels correspond to the point-cloud representation (see Methods section for details) generated by combining the two data sets after they were aligned separately (by six iterations of iterative classification and alignment) followed by alignment of one data set to the other. Lines and markers related to the SIVmac239 sample are colored red and line and markers related to the SIV CP-MAC sample are blue. Gray lines in (a,d) are the normalized histograms of all of the data represented in the mixture. The overlap between the 2D histograms of the SIVmac239 and SIV CP-MAC sub-volumes is only ~13%.
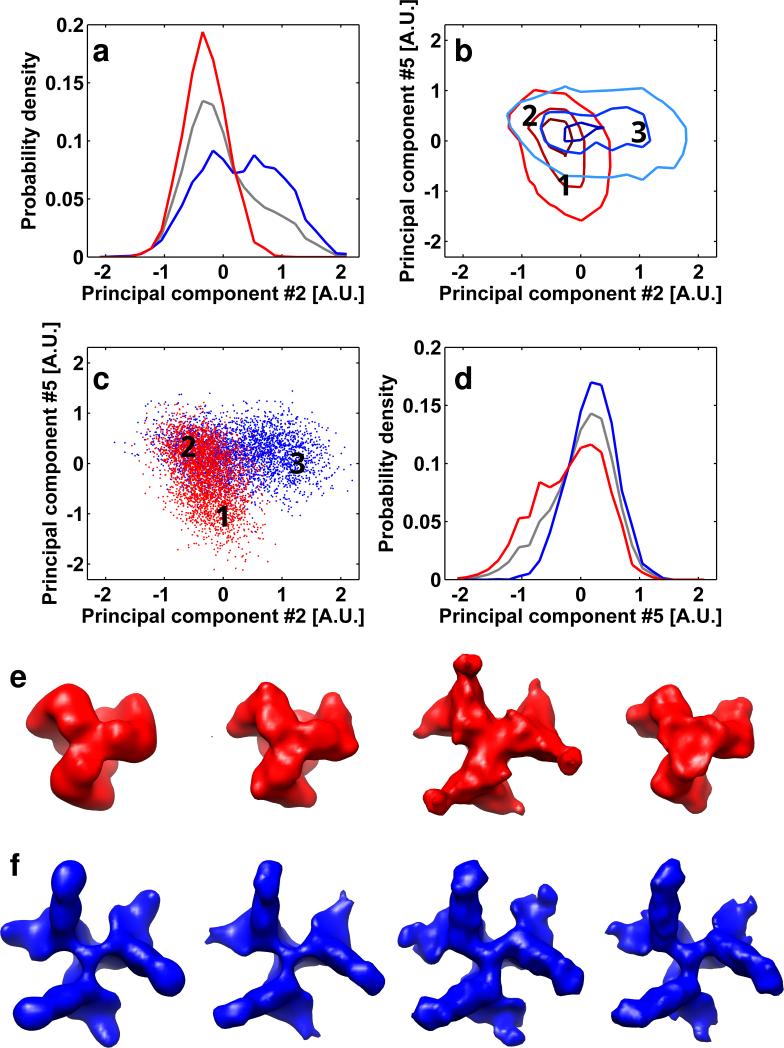
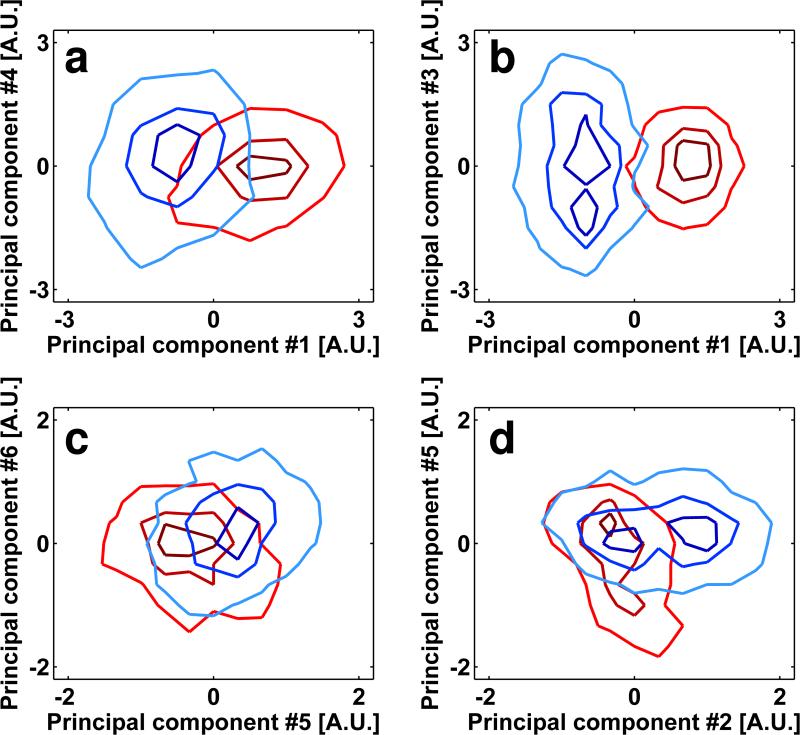
Among the factors that can adversely affect the separation between the open and closed conformations when they are present simultaneously are: (i) the similarity between the structures, (ii) the high noise levels that are intrinsic to the data collection strategies that we use in cryo-electron tomography, and (iii) interference from a subpopulation of exceptionally noisy sub-volumes that result in errors in classification and alignment of the rest of the data set. To better understand the importance of each of these factors in achieving computational separation of conformations that are present simultaneously, we first tested whether structures with large structural differences could be clearly distinguished when they are present in mixtures. For this purpose, we mixed volumes of the closed spike conformation (SIVmac239) with that of the open spike conformation complexed to two ligands (SIV CP-MAC complexed with sCD4 and the Fab fragment from the 7D3 antibody). Our expectation was that the additional mass arising from the sCD4 and Fab fragment would enhance the structural differences between the two kinds of trimeric Env species present in a mixture and allow better separation of the respective scatter-clouds, and therefore allow extraction of the distinct conformations. Analysis of the resulting histograms confirms this expectation, and also provides important new insights into the origins of achieving good structural separation (Figure 5). Inspection of the 2D histograms indicates that the scatter-clouds of the respective components in the mixture display distinct regions that are separate as well regions that are overlapping. Determination of the averaged 3D structures from spikes present in the well-separated regions (regions 1 and 3) shows the expected structural difference between the two conformations. However, 3D averaging of the structures from the SIV mac239 and the sCD4/7D3 complexed SIV CP-MAC virions present in the overlapping region reveals that they fall somewhere in between the two distinct structures. This result suggests that the alignment of the sub-volumes that are in this overlap region may be incorrect making the conformational separation difficult. To test this, we separated the sub-volumes located in this region of the 2D histogram into two groups according to their known membership to the respective parent data sets. The two sets of spikes were then independently re-processed by randomizing their orientations and performing six iterations of classification and alignment. Inspection of the averaged structures obtained from these two subsets established that the spikes derived from the SIVmac239 data set produced an averaged structure that was the same as that of the parent SIVmac239 data set. Similarly, the spikes derived from the SIV CP-MAC+sCD4+7D3 data set produced an averaged structure that was the same as that of the parent data set. Thus, the presence of these spikes in the zone of overlap (region 2; Figure 5c) is solely a consequence of errors in alignment of the individual sub-tomograms. These studies establish one of the central results of our analysis, which is that proper alignment of sub-volumes is essential for successful separation between conformations, consistent with findings presented in Figure 4 that independent alignment of each dataset prior to mixing results in clearer separation of sub-volumes.
FIGURE 5.
Analysis of geometrical features of the reduced dimensionality representation of the SIVmac239/SIV CP-MAC+sCD4+7D3 mixture. (a,d) The point-cloud is visualized as described in the methods. Red lines and markers are related to the SIVmac239 sample and blue lines and markers are related to the SIV CP-MAC+sCD4+7D3 sample. The gray lines in panels (a) and (d) are the normalized histograms of all of the data represented in the mixture. Sub-volumes from the regions designated by the numbers on the 2D histogram contour plots (panels b and c) were averaged separately. The overlap between the scatter-clouds is ~45%. Three regions were selected for this type of analysis: two regions that contain sub-volumes only from one of the data sets in the mixture, region 1 with SIVmac239 sub-volumes, and region and 3 with SIV CP-MAC+sCD4+7D3 sub-volumes; and one region where sub-volumes from the two data sets reside in the same place (region 2). Top views of the maps resulting from averaging subtomograms originating from SIVmac239 and SIV CP-MAC+sCD4+7D3 data sets are illustrated in panels e (red) and f (blue) respectively. From left to right, the maps in panels (e) and (f) indicate (i) the averaged structures using all of the data, (ii) the maps derived from clearly separated regions of the point cloud, (iii) maps derived from sub-volumes contributing to the overlap region of the point cloud using the orientations assigned by iterative alignment when mixed conformations are present and (iv) maps derived from sub-volumes contributing to the overlap region of the point cloud using orientations assigned by iterative alignment in the absence of mixed data. It is readily apparent that where clear separation was achieved (regions 1 and 2) the resulting average map reliably represents the structure of the respective starting data sets. The assignment of spikes to the region (3) where there is no clear separation is solely due to misalignment, as reflected in the maps resulting from separately averaging the sub-volumes of each original data set while keeping the orientation assigned to them by the iterative alignment process of the mixture. Averaging the same sub-volumes after performing six iterations of alignment and classification solely on theses sub-volumes when they are not in a mixture yield the correct structure.
To study the effect of noise on separating conformations that are sufficiently distinct from each other, we also assessed the current limitations in signal levels present in each spike to separate the closed and open conformations shown in Figure 2. We reasoned that bundling of small numbers of spikes by averaging them to create “super-spikes” should increase the signal-to-noise-ratios levels progressively and that at some level of bundling, the SNRs should be adequate to clearly separate the two conformations. We therefore carried out spike bundling experiments using data sets where we mixed the closed and open conformations, or the closed and sCD4/7D3-liganded open conformations. Figure 6 shows that already with bundling of two spikes, there is a noticeable improvement in the extent of separation, and this gets progressively better with an increase in the number of bundled spikes. The increased SNRs resulting from bundling of more than 5 spikes is enough to completely separate the two conformations. These analyses provide important and practical guidelines for improvements in data quality and image contrast in cryo-electron tomography. The relationship between the average mixing ratios, and the SNRs are summarized in Table 1.
Table I.
Summary of attempts to separate conformationally distinct Env moieties mixed in-silico. All the values were obtained according to the description in the methods section. <mr> is the averaged mixing ratio determined for classification by k-means to 10 classes. Bold characters designate data sets that can be separated by visual inspection of the scatter-clouds.
| Data sets in mixture | Bundle Size | SNR | <mr> |
|---|---|---|---|
| SIVmac239/SIV CP-MAC | 1 | 0.11 | 0.63 |
| 2 | 0.14 | 0.29 | |
| 5 | 0.22 | 0.06 | |
| 10 | 0.30 | 0.02 | |
| 20 | 0.39 | 0.02 | |
| 30 | 0.46 | 0.01 | |
| SIVmac239/SIV CP-MAC+sCD4+7D3 | 1 | 0.12 | 0.55 |
| 2 | 0.15 | 0.25 | |
| 5 | 0.23 | 0.02 | |
| 10 | 0.31 | 0.01 | |
| 20 | 0.39 | 0.01 | |
| 30 | 0.45 | 0.01 | |
| JR-FL SOSIP/JR-FL SOSIP+sCD4 | 1 | 0.32 | 0.30 |
The bundling experiments presented above rely on the certainty that the spikes that are bundled together come from the same species. To take advantage of these results and to apply it to cases where this bundling might be derived de novo, we repeated the experiment by bundling nearest neighbors in the scatter-cloud of the SIVmac239/SIV CP-MAC mixture after six iterations of classification and alignment. We expected that in most cases entities that were most closely related would be spikes of the same kind (Figure 7). The results show that the success of achieving separation indeed improves with this de novo derived bundling. Interestingly, the pairs of spikes that involve bundling of the same kind (~74% of the pairs) show exactly the type of separation achieved with targeted spike bundling, while mixed pairs fall at the intersection of the two separate clouds.
FIGURE 7.
Improved separation using clustering of pairs of spikes with similar structures in mixtures of SIV mac239 and SIV CP-MAC. Individual sub-tomograms were paired and averaged in 3D based on the criterion of having the shortest Euclidean distance in the reduced dimensionality representation of the mixture following initial alignment. Lines and markers related to spike pairs originating from the SIVmac239 alone and the SIV CP-MAC alone are colored red and blue respectively. The overlap between the scatter-clouds of the pure SIVmac239 pairs and the pure SIV CP-MAC pairs is ~43%.
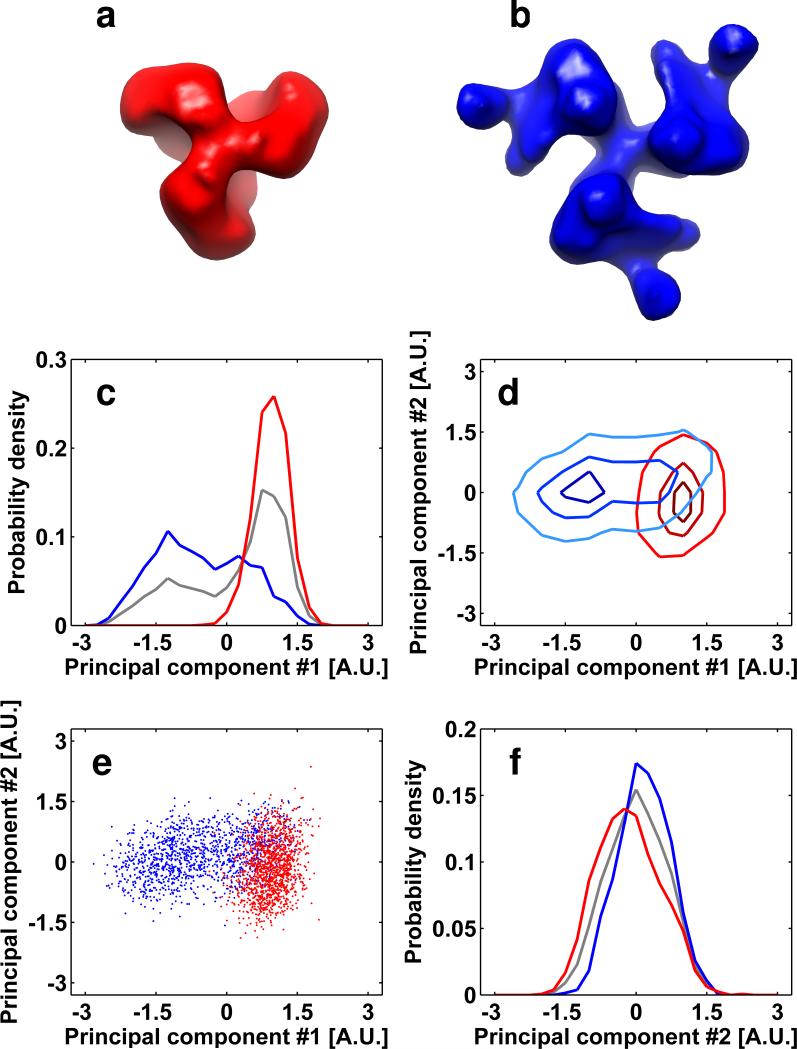
One of the predictions of our analysis is that the success of separating conformations that differ by smaller amounts can be enhanced by increasing the SNRs of the sub-volumes. We tested this using sub-volumes of soluble spikes which are less noisy because there is no interfering signal from the rest of the virus. We have recently demonstrated that these soluble versions of trimeric spikes show the same open and closed conformations as observed for native spikes displayed on viral membranes (Harris et al., 2011). Comparison of scatter-clouds for separation of mixtures corresponding to the closed, unliganded state of trimeric Env with the open sCD4-bound state show that despite the smaller differences in mass (Figures 8a, 8b) as compared to the examples in Figure 5, the extent of separation is higher (Figure 8c-8f), presumably because of the increased SNRs of individual spikes imaged in the absence of additional background components.
FIGURE 8.
Separation between soluble spikes in different conformations and ligand binding. Top views of the soluble spike in a closed unliganded state and in an opened sCD4 liganded sates are illustrated in panels a (red) and b (blue) respectively. (c-f) Visualization of the reduced dimensionality representation of the JR-FL SOSIP/JR-FL SOSIP+sCD4 mixture after iterative alignment and classification. Lines and markers related to unliganded and sCD4-liganded SOSIP trimers are colored red and blue, respectively. The gray lines in panels (c) and (f) are the normalized histograms of all of the data represented in the mixture. The overlap between the scatter-clouds of the sub-volumes representing unliganded and liganded complexes is only ~26%.
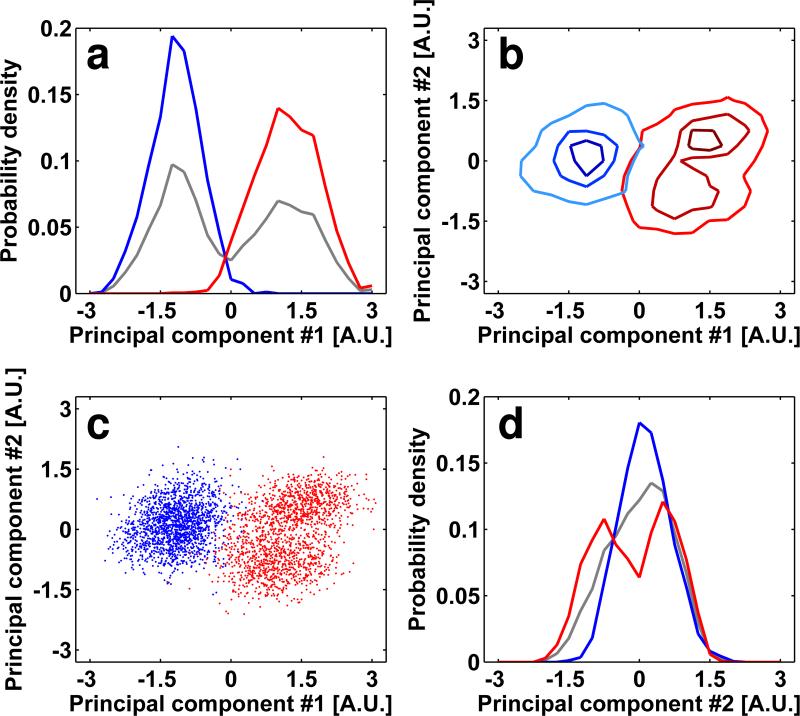
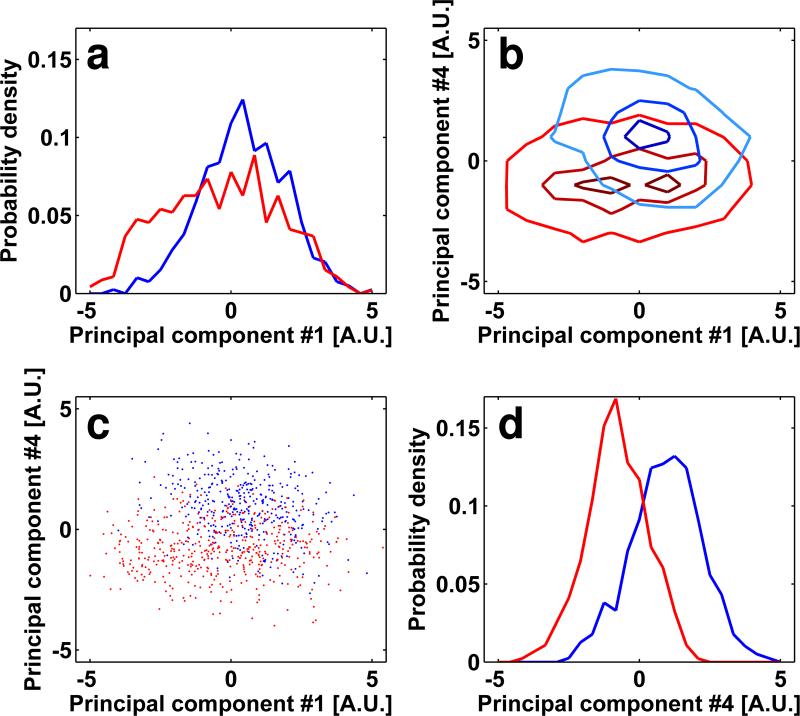
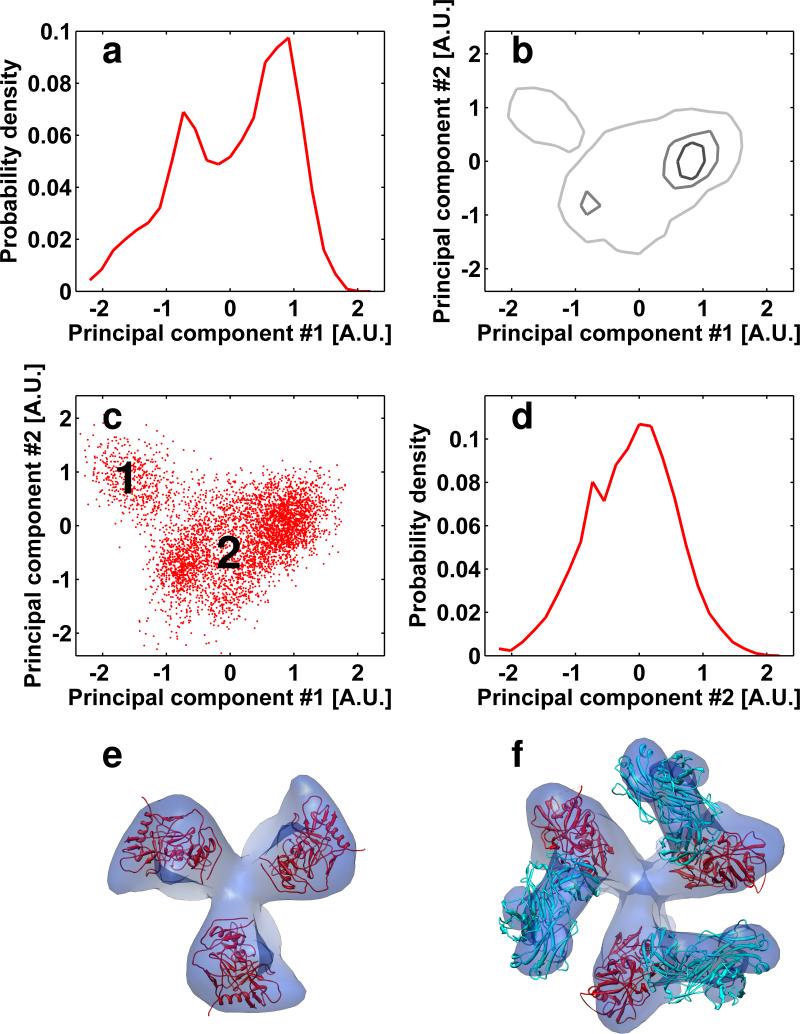
In an effort to establish how the overall accuracy of alignment is influenced by the presence of a fraction of sub-volumes with poorer SNRs, we repeated the alignment experiments presented in figures 3 and 5, but including only the third of the sub-volumes with the highest similarity to the averaged map of their corresponding species. The plots of the separation presented in figures 9a and 9b show that excluding the two-thirds of the data with the lowest correlation coefficients led to a dramatic improvement in the extent of separation of their respective scatter-clouds. Importantly, not only does the presence of the noisier fraction make the separation poorer, it also interferes with the accuracy of alignment of the rest of the spikes, as assessed by comparing the extent of separation of the best third of the spikes in the absence (figures 9a, 9b) or presence (figures 9c, 9d) of the worst two-thirds of the data set. These results show that cycles of iterative classification that progressively discard the weaker components of the data can be beneficial for better separation of conformational heterogeneity in complex mixtures. Finally, as an ultimate validation of the analysis presented above, we attempted separation of unliganded HIV-1 Env spikes and those bound to Fab fragments of the 17b monoclonal antibody under experimental conditions where there was no a priori knowledge of the identities of the respective subpopulations, or their relative proportions. The success of distinguishing conformations in this case relies solely on the ability to distinguish the respective scatter-clouds. As shown in Figure 10, the scatter-clouds do show a recognizable separation, and averaging the sub-volumes present in the two main lobes of the scatter-cloud leads to the previously established structures (Harris et al., 2011) for the unliganded and 17b-liganded conformations that are both present simultaneously in the mixture.
FIGURE 9.
Effect of eliminating sub-volumes with lower SNRs on conformational separation. (a-d) Two-dimensional histograms of the projection of the scatter-clouds of the reduced dimensionality representation showing smallest overlap. The histograms in panels (a,c) are for the SIVmac239/SIV CP-MAC mixture and in panels (b,d) for SIVmac239/SIV CP-MAC+sCD4+7D3 mixture. In panels (a-b), only the third of the data set with highest quality was incorporated in the iterative classification and alignment. The overlaps between the histograms in panels a and b are ~25% and 2% respectively. In panels (c-d), the iterative classification and alignment was performed using all the data but only the third of the data set with highest quality was depicted in the histogram. The overlaps between the histograms in panels c and d are ~50% and 43% respectively. Contour lines related to the SIVmac239 sample are colored red. Contour lines related to the SIV CP-MAC and SIV CP-MAC+sCD4+7D3 samples are colored blue. The overlap between the histograms of the SIVmac239 and SIV CP-MAC sub-volumes is ~8%.
FIGURE 10.
Successful separation of mixed conformations in unliganded and 17b Fab-bound soluble HIV-1 Env spikes. (a-d) Plots of the probability density (a, d) and point cloud distributions (b, c) as defined in Figure 2. The histograms of soluble spikes incubated with the 17b Fab fragments were projected to the 1st and 2nd principal components and visualized as described in the methods section. The maps resulting from averaging the sub-volumes in regions 1 and 2 identified in panel (c) are shown in panels (e) and (f) respectively. (e, f) The map resulting from averaging of sub-volumes in region 1 results in a density map and fitted molecular structure that is essentially the same as that derived for the complex between soluble HIV-1 Env and 17b Fab, and the map resulting from averaging of sub-volumes in region 2 results in a density map and fitted molecular structure that is essentially the same as that derived for unliganded soluble HIV-1 Env spikes (Harris et al., 2011). Molecular structures were obtained by fitting three copies of coordinates for the complex derived from the 1GC1 PDB entry into the density map; coordinates for 17b and gp120 are shown in cyan and red, respectively.
DISCUSSION
The task of classifying conformationally heterogeneous data sets of sub-volumes of HIV/SIV spikes segmented from whole virion tomograms presents challenges both at the level of practical feasibility and at the algorithmic level. Given the high noise content and low contrast of individual spike densities from cryo-electron tomograms, is separation based on protein conformation tractable? If so, what are the expected qualities of an algorithm that can perform such a task? It is hard to expect general answers for these questions as both the structural differences and the data collection conditions are sample specific. In addition, different properties of the data may affect the success of different algorithms. In order to map the landscape of parameters governing this complex problem we investigated the importance of various factors affecting the separation in relation to conformations of SIV and HIV spikes found under various experimental conditions.
The distribution of points representing individual spikes in the reduced dimensionality space constitutes a simple and intuitive tool to analyze the structural heterogeneity of the sample. Properly aligned spikes adopting a single conformation are represented as a unique cluster of points in the reduced dimensionality representation space. As the noise and the alignment errors increase, so does the dispersion of points in the cluster. When more than one conformation is present in the data set, several such clusters may be formed. When the structural differences between the conformations are large enough, and the noise is sufficiently small, the clusters will not overlap. By analyzing and visualizing the reduced dimensionality representation accompanying the data processing, we can apply sub-tomogram averaging methodology effectively to analyze the structural heterogeneity in mixtures. In general, when data sets collected from the surface of intact viruses adopting different conformations were combined before iterative classification and alignment, there was only weak separation between sub-volumes corresponding to different conformations. As expected, the extent of overlap between the clusters was substantially lower in cases with widely different conformations. Interestingly, combination of the data sets after aligning them separately always leads to non-overlapping clusters, indicating that the inaccuracy of the alignment is the main obstacle for attaining a reliable separation. Two other results lead to the same conclusion and also shed light on the origin of the errors in alignment. First, averaging sub-volumes in the overlap region that arise from only one of the data sets in the mixture generates a map with mixed features. However, the resemblance disappears when the same sub-volumes are aligned and averaged separately. This ‘model bias’ type of effect occurs when the noisy sub-volumes of one conformation are pushed towards a local minimum where their average structure resembles the other conformation, giving rise to an ‘internal bias’ in alignment. Second, mixed data sets where only sub-volumes with the highest SNRs (top third of the data) were used clearly showed lower overlap after iterative alignment and classification. Yet, these “better” sub-volumes were randomly distributed in the scatter-clouds when all of the data was used. From this result, we conclude that when more than one conformation is present in the mixture, sub-volumes with low SNR interfere with the alignment of the entire dataset accentuating the ‘internal bias’ effect. As a result, the presence of sub-volumes with low SNR introduces errors in the alignment of the sub-volumes with high SNR.
Since the success of the alignment is expected to depend on the SNR of the data, we also tested how the reduction of noise affects the classification. As expected, a significant improvement of the separation was observed when the SNR of the sub-volumes was increased by averaging small groups of spikes either within each of the sub-populations (Figure 6), or by deriving de novo relationships taking advantage of the geometric distribution of spikes within the scatter-clouds (Figure 7). The important conclusion from our work is that using cryo-electron tomography, it is realistic and feasible to separate functionally important conformational states of protein complexes in mixtures even when there is no a priori knowledge of the proportion of the different subpopulations that are present.
Realization of reliable methods for sorting out structural heterogeneity represents a powerful tool for investigating the relationship between structural and biophysical properties under physiological conditions using cryo-electron microscopy. For systems composed of heterogeneous membrane-bound protein assemblies such as spikes on enveloped viruses or soluble protein complexes in the cytosol which are hard to purify or reconstitute in vitro, this methodology is a particularly applicable structural tool of choice. Due to the large genetic diversity inherent to viruses such as HIV, the envelope glycoprotein spike encompasses an additional dimension of heterogeneity to an already conformationally dynamic structure characteristic to viral fusogens. The methodologies described here will therefore be particularly relevant for study the structure diversity of HIV spikes bound to conformation-specific antibodies. The continued development of more robust alignment algorithms which do not rely on averaging subsets of sub-volumes for convergence, and are therefore not prone to internal bias, will therefore be an important step towards reliable dissection of the structural heterogeneity analyzed by cryo-electron tomography.
ACKNOWLEDGEMENT
This work was supported by funds from the Center for Cancer Research at the National Cancer Institute, NIH, Bethesda, MD.
Footnotes
Publisher's Disclaimer: This is a PDF file of an unedited manuscript that has been accepted for publication. As a service to our customers we are providing this early version of the manuscript. The manuscript will undergo copyediting, typesetting, and review of the resulting proof before it is published in its final citable form. Please note that during the production process errors may be discovered which could affect the content, and all legal disclaimers that apply to the journal pertain.
REFERENCES
- Bartesaghi A, Subramaniam S. Membrane protein structure determination using cryo-electron tomography and 3D image averaging. Current Opinion in Structural Biology. 2009;19:402–407. doi: 10.1016/j.sbi.2009.06.005. [DOI] [PMC free article] [PubMed] [Google Scholar]
- Bartesaghi A, Sprechmann P, Liu J, Randall G, Sapiro G, Subramaniam S. Classification and 3D averaging with missing wedge correction in biological electron tomography. Journal of Structural Biology. 2008;162:436–450. doi: 10.1016/j.jsb.2008.02.008. [DOI] [PMC free article] [PubMed] [Google Scholar]
- Ben-Harush K, Maimon T, Patla I, Villa E, Medalia O. Visualizing cellular processes at the molecular level by cryo-electron tomography. Journal of Cell Science. 2010;123:7–12. doi: 10.1242/jcs.060111. [DOI] [PubMed] [Google Scholar]
- Borgnia MJ, Subramaniam S, Milne JLS. Three-dimensional imaging of the highly bent architecture of Bdellovibrio bacteriovorus by using cryo-electron tomography. Journal of Bacteriology. 2008;190:2588–2596. doi: 10.1128/JB.01538-07. [DOI] [PMC free article] [PubMed] [Google Scholar]
- Brandt F, Carlson LA, Hartl FU, Baumeister W, Grunewald K. The Three-Dimensional Organization of Polyribosomes in Intact Human Cells. Molecular Cell. 2010;39:560–569. doi: 10.1016/j.molcel.2010.08.003. [DOI] [PubMed] [Google Scholar]
- Carlson LA, de Marco A, Oberwinkler H, Habermann A, Briggs JAG, Krausslich HG, Grunewald K. Cryo Electron Tomography of Native HIV-1 Budding Sites. Plos Pathogens. 2010;6 doi: 10.1371/journal.ppat.1001173. [DOI] [PMC free article] [PubMed] [Google Scholar]
- Cyrklaff M, Linaroudis A, Boicu M, Chlanda P, Baumeister W, Griffiths G, Krijnse-Locker J. Whole Cell Cryo-Electron Tomography Reveals Distinct Disassembly Intermediates of Vaccinia Virus. Plos One. 2007;2 doi: 10.1371/journal.pone.0000420. [DOI] [PMC free article] [PubMed] [Google Scholar]
- Dudkina NV, Oostergetel GT, Lewejohann D, Braun HP, Boekema EJ. Row-like organization of ATP synthase in intact mitochondria determined by cryo-electron tomography. Biochimica Et Biophysica Acta-Bioenergetics. 2010;1797:272–277. doi: 10.1016/j.bbabio.2009.11.004. [DOI] [PubMed] [Google Scholar]
- Fischer N, Konevega AL, Wintermeyer W, Rodnina MV, Stark H. Ribosome dynamics and tRNA movement by time-resolved electron cryomicroscopy. Nature. 2010;466:329–333. doi: 10.1038/nature09206. [DOI] [PubMed] [Google Scholar]
- Förster F, Pruggnaller S, Seybert A, Frangakis AS. Classification of cryo-electron sub-tomograms using constrained correlation. Journal of Structural Biology. 2008;161:276–286. doi: 10.1016/j.jsb.2007.07.006. [DOI] [PubMed] [Google Scholar]
- Frank J, Zhu J, Penczek P, Li YH, Srivastava S, Verschoor A, Radermacher M, Grassucci R, Lata RK, Agrawal RK. A Model of Protein-Synthesis Based on Cryoelectron Microscopy of the E-Coli Ribosome. Nature. 1995;376:441–444. doi: 10.1038/376441a0. [DOI] [PubMed] [Google Scholar]
- Grunewald K, Desai P, Winkler DC, Heymann JB, Belnap DM, Baumeister W, Steven AC. Three-dimensional structure of herpes simplex virus from cryo-electron tomography. Science. 2003;302:1396–1398. doi: 10.1126/science.1090284. [DOI] [PubMed] [Google Scholar]
- Harris A, Borgnia MJ, Shi D, Bartesaghi A, He H, Pejchal R, Kang K, Depetris R, Marozsan AJ, Sanders RW, Klasse PJ, Milne JLS, Wilson IA, Olson WC, Moore JP, Subramaniam S. Trimeric HIV-1 gp140 immunogens and native HIV-1 envelope glycoproteins display the same closed and open quaternary molecular architectures. Proceedings of the National Academy of Sciences of the United States of America. 2011 doi: 10.1073/pnas.1101414108. In Press. [DOI] [PMC free article] [PubMed] [Google Scholar]
- Henderson R. Realizing the potential of electron cryo-microscopy. Quarterly Reviews of Biophysics. 2004;37:3–13. doi: 10.1017/s0033583504003920. [DOI] [PubMed] [Google Scholar]
- Heumann JM, Hoenger A, Mastronarde DN. Clustering and variance maps for cryo-electron tomography using wedge-masked differences. Journal of Structural Biology. doi: 10.1016/j.jsb.2011.05.011. In Press, Corrected Proof, Available online 17 May 2011. [DOI] [PMC free article] [PubMed] [Google Scholar]
- Kirby M. Geometric data analysis : an empirical approach to dimensionality reduction and the study of patterns. Wiley; New York: 2001. [Google Scholar]
- Kuhlbrandt W, Wang DN, Fujiyoshi Y. Atomic Model of Plant Light-Harvesting Complex by Electron Crystallography. Nature. 1994;367:614–621. doi: 10.1038/367614a0. [DOI] [PubMed] [Google Scholar]
- Kurner J, Frangakis AS, Baumeister W. Cryo-electron tomography reveals the cytoskeletal structure of Spiroplasma melliferum. Science. 2005;307:436–438. doi: 10.1126/science.1104031. [DOI] [PubMed] [Google Scholar]
- Liu J, Bartesaghi A, Borgnia MJ, Sapiro G, Subramaniam S. Molecular architecture of native HIV-1 gp120 trimers. Nature. 2008;455:109–U76. doi: 10.1038/nature07159. [DOI] [PMC free article] [PubMed] [Google Scholar]
- Liu XA, Zhang QF, Murata K, Baker ML, Sullivan MB, Fu C, Dougherty MT, Schmid MF, Osburne MS, Chisholm SW, Chiu W. Structural changes in a marine podovirus associated with release of its genome into Prochlorococcus. Nature Structural & Molecular Biology. 2010;17:830–U76. doi: 10.1038/nsmb.1823. [DOI] [PMC free article] [PubMed] [Google Scholar]
- Loney C, Mottet-Osman G, Roux L, Bhella D. Paramyxovirus Ultrastructure and Genome Packaging: Cryo-Electron Tomography of Sendai Virus. Journal of Virology. 2009;83:8191–8197. doi: 10.1128/JVI.00693-09. [DOI] [PMC free article] [PubMed] [Google Scholar]
- MacQueen J. Proceedings of the Berkeley Symposium on Mathematical Statistics and Probability. University of California Press.; Berkeley: 1967. Some methods for classification and analysis of multivariate observations; pp. 281–297. [Google Scholar]
- Murphy GE, Leadbetter JR, Jensen GJ. In situ structure of the complete Treponema primitia flagellar motor. Nature. 2006;442:1062–1064. doi: 10.1038/nature05015. [DOI] [PubMed] [Google Scholar]
- Patla I, Volberg T, Elad N, Hirschfeld-Warneken V, Grashoff C, Fassler R, Spatz JP, Geiger B, Medalia O. Dissecting the molecular architecture of integrin adhesion sites by cryo-electron tomography. Nature Cell Biology. 2010;12:909–915. doi: 10.1038/ncb2095. [DOI] [PubMed] [Google Scholar]
- Ringler P, Borgnia MJ, Stahlberg H, Maloney PC, Agre P, Engel A. Structure of the water channel AqpZ from Escherichia coli revealed by electron crystallography. Journal of Molecular Biology. 1999;291:1181–1190. doi: 10.1006/jmbi.1999.3031. [DOI] [PubMed] [Google Scholar]
- Stolken M, Beck F, Haller T, Hegerl R, Gutsche I, Carazo JM, Baumeister W, Scheres SHW, Nickell S. Maximum likelihood based classification of electron tomographic data. Journal of Structural Biology. 2011;173:77–85. doi: 10.1016/j.jsb.2010.08.005. [DOI] [PubMed] [Google Scholar]
- Walz J, Typke D, Nitsch M, Koster AJ, Hegerl R, Baumeister W. Electron tomography of single ice-embedded macromolecules: Three-dimensional alignment and classification. Journal of Structural Biology. 1997;120:387–395. doi: 10.1006/jsbi.1997.3934. [DOI] [PubMed] [Google Scholar]
- White TA, Bartesaghi A, Borgnia MJ, Meyerson JR, de la Cruz MJV, Bess JW, Nandwani R, Hoxie JA, Lifson JD, Milne JLS, Subramaniam S. Molecular Architectures of Trimeric SIV and HIV-1 Envelope Glycoproteins on Intact Viruses: Strain-Dependent Variation in Quaternary Structure. Plos Pathogens. 2010;6 doi: 10.1371/journal.ppat.1001249. [DOI] [PMC free article] [PubMed] [Google Scholar]
- Winkler H, Taylor KA. Multivariate statistical analysis of three-dimensional cross-bridge motifs in insect flight muscle. Ultramicroscopy. 1999;77:141–152. [Google Scholar]
- Yonekura K, Maki-Yonekura S, Namba K. Complete atomic model of the bacterial flagellar filament by electron cryomicroscopy. Nature. 2003;424:643–650. doi: 10.1038/nature01830. [DOI] [PubMed] [Google Scholar]
- Yu Z, Frangakis AS. Classification of electron sub-tomograms with neural networks and its application to template-matching. J Struct Biol. 2011;174:494–504. doi: 10.1016/j.jsb.2011.02.009. [DOI] [PubMed] [Google Scholar]
- Zhang X, Settembre E, Xu C, Dormitzer PR, Bellamy R, Harrison SC, Grigorieff N. Near-atomic resolution using electron cryomicroscopy and single-particle reconstruction. Proceedings of the National Academy of Sciences of the United States of America. 2008;105:1867–1872. doi: 10.1073/pnas.0711623105. [DOI] [PMC free article] [PubMed] [Google Scholar]


