Abstract
We report a very selective and sensitive spectroscopic detection of Z-DNA embedded in B-DNA in condensed as well as non-condensed DNA using anionic Ni(II) meso-tetrakis(4-sulphonatophenyl)porphyrin, NiTPPS. A combination of micromolar concentrations of Ni(II) and spermine4+ allowed us to prepare left-handed Z-DNA in short oligonucleotides without DNA condensation. A strong induced circular dichroism (ICD) signal was observed in the visible absorption region when NiTPPS was added to BZ DNA (Z-DNA fragment located at the end of a B-DNA tract with one B/Z DNA junction) and BZB DNA (Z-DNA sequence embedded in B-DNA having two B/Z DNA junctions). Almost no ICD signal was detected when NiTPPS was added to B-DNA. NiTPPS showed different binding modes with condensed and non-condensed Z-DNAs and allowed the distinction between condensed Z-DNA (positive bisignate CD couplet) and non-condensed Z-DNA (negative bisignate CD couplet).
Keywords: anionic nickel(II) porphyrin, left-handed Z-DNA, BZB sequences, induced circular dichroism, Z-DNA detection
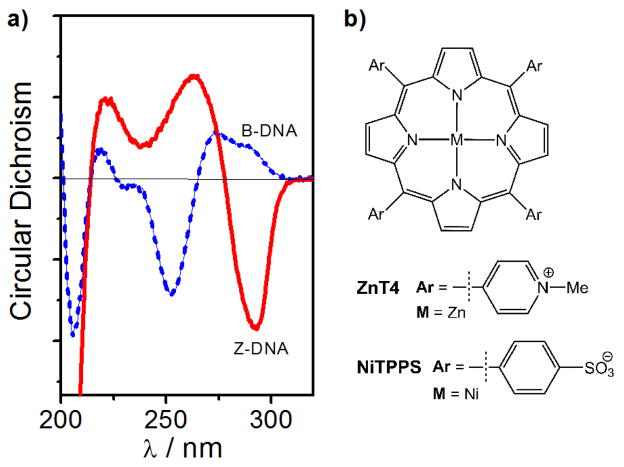
Since the left handed form of DNA (Z-DNA) was first detected in 1972 [1], much work has been done to gain a scientific understanding of its biological role [2,3,4,5,6]. In vitro studies of Z-DNA have provided information regarding its structure and properties [7,8,9]. It is known that the transition of B- to Z-DNA in alternating pyrimidine-purine sequences can be induced by molar or millimolar or micromolar concentrations of cationic species (e.g. Ni2+, Co[NH3]63+, spermine4+) [10,11]. Using circular dichroism (CD), it is possible to observe this transition experimentally. As shown in Fig. 1a, B-DNA exhibits a positive CD band at 280 nm and a negative CD band at 250 nm (blue curve) while Z-DNA has a negative CD band at 290 nm and a positive CD band at 260 nm [12,13,14,15].
Fig. 1.
a) CD spectra of B-form (blue dashed curve) and Z-form (red curve) of poly(dG-dC)2. b) Structure of cationic zinc(II) porphyrin (ZnT4, Zn(II)-meso-tetrakis(4-N-methylpyridyl)porphyrin) and anionic nickel(II) porphyrin (NiTPPS, Ni(II)-meso-tetrakis(4-sulphonatophenyl)porphyrin).
In real biological samples, however, the detection of Z-DNA is still an unsolved challenge because of the high B/Z DNA ratio and the spectroscopic interferences by proteins and other biological materials that also absorb in the UV region. In order to tackle this problem, we identified chiroptical probes that discriminate between B- and Z-DNA and do not absorb in the same region as DNA. The visible region above 300 nm is free from interferences and is ideally suited for induced circular dichroism (ICD) DNA recognition.
Metalloporphyrins have shown to be excellent chiroptical probes for detecting Z-DNA in alternating cytosine-guanine oligonucleotides (#b.p. <50) and polynucleotides (#b.p. ~1000) [16,17,18]. Recently we have reported that a cationic Zn(II)porphyrin (ZnT4, Fig. 1b) and an anionic Ni(II)porphyrin (NiTPPS, Fig. 1b) were able to spectroscopically detect the left-handed Z-DNA under highly competitive conditions [19,20]. ZnT4 detected the Z-form embedded in B-DNA sequences with different B/Z ratios and nucleobase sequences via new ICD signals [19]. However, the sensing suffered from low specificity and intensity of the ICD signal. On the other hand, the anionic NiTPPS was used to sense the Ni(II)condensed Z-DNA in the presence of B-DNA (in this case two mixed oligonucleotides) via a strong ICD signal [20]. In order to improve the selectivity and sensitivity of detection of the Z-DNA fragment within oligonucleotide sequence, we have employed the anionic NiTPPS as a chiroptical probe. We have explored the detection of Z-DNA located at the end of a B-DNA tract with one B/Z DNA junction (BZ) as well as Z-DNA embedded in B-DNA having two B/Z DNA junctions (BZB(I)) in both condensed and non-condensed DNA samples (Fig. 2). Both DNAs have two 8-bromoguanines (depicted as X) incorporated in their sequences to promote the formation of Z-DNA fragment [21]. Natural DNA sequences B and B(I) with guanines instead of brominated guanines were used for comparison.
Fig. 2.
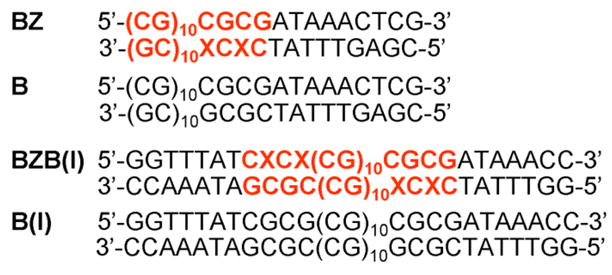
BZ, B, BZB(I), and B(I) sequences employed in current study (X depicts 8-bromoguanine, Z-DNA fragment is written in bold red).
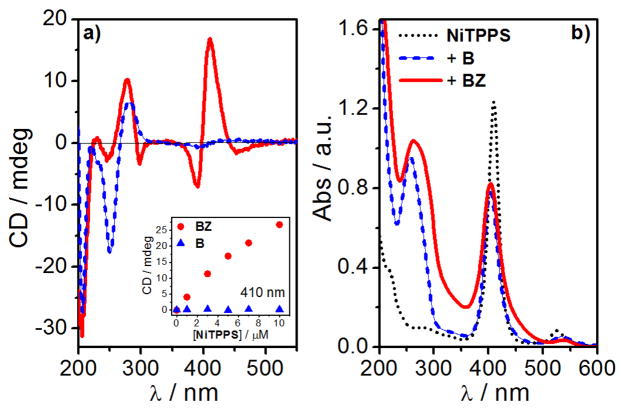
We started our study with a 33-mer BZ DNA. Addition of NiCl2 (50 mM) to the BZ sequence (50 μM) in Na-cacodylate buffer (1mM, pH = 7.0) promoted the expected B- to Z-DNA transition of the alternating cytosine-guanine part accompanied with Z-DNA condensation (Supplementary Material, Fig. S1 and S2). Addition of NiTPPS (5 μM) gave rise to a strong bisignate CD signal with a positive CD band at 405 nm and negative CD band at 395 nm (Fig. 3). The absorption spectrum revealed hypochromicity (~34%) and a blue shift (Δλ = 5.0 nm) of the Soret band in the presence of BZ. Addition of NiTPPS to the non-brominated control sequence B under identical conditions did not give rise to ICD signals (Fig. 3a and S3).
Fig. 3.
(a) CD and (b) UV-vis absorption spectra of NiTPPS (5 μM) alone (black dotted curve) and in presence of BZ (100 μM + 50 mM NiCl2, red curve) and B (100 μM + 50 mM MgCl2, blue dashed curve) in Na- cacodylate buffer (1 mM, pH = 7.0). Inset: CD signal at 410 nm as a function of [NiTPPS] in presence of BZ (red circles) and B (blue triangles) sequences.
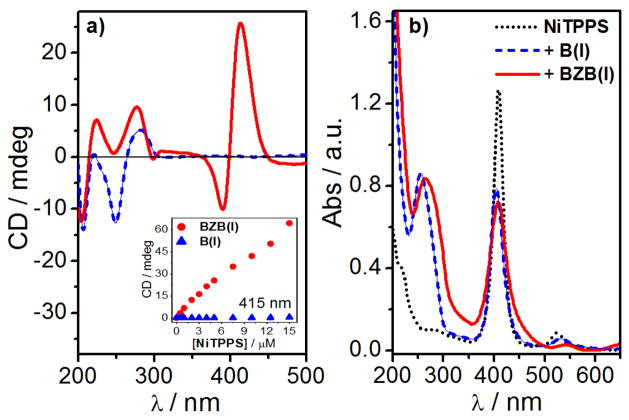
Next, we explored the 42-mer BZB(I) sequence. The Z-form of the central portion of the BZB(I) was induced by NiCl2 (50 mM) and confirmed by CD spectroscopy. The condensation of the BZB(I) was observed by a decrease of transmittance. The addition of NiTPPS (5 μM) to a solution of BZB(I) (100 μM + 50 mM NiCl2) resulted in an intense bisignate CD signal in the Soret band region with a negative band at 390 nm and a positive band at 420 nm (Fig. 4a). The NiTPPS binding was accompanied by a hypochromic (H= ~ 50%) and hypsochromic (Δλ= 5.0 nm) effect of the Soret band in UV-vis absorption spectrum (Fig. 5a). No ICD signal was observed upon addition of NiTPPS to the non-brominated control sequence B(I) from 0 to 10 μM of NiTPPS, and a small bisignate signal is detected at 15 μM (Fig. 4a and S6).
Fig. 4.
(a) CD and (b) UV-vis absorption spectra of NiTPPS (5 μM) alone (black dotted curve) and in presence of BZB(I) (100 μM + 50 mM NiCl2, red curve) and B(I) (100 μM + 50 mM MgCl2, blue dashed curve). Inset shows the CD signal at 415 nm as a function of [NiTPPS] in presence of BZB(I) (red circles) and B(I) (blue triangles) sequences.
Fig. 5.
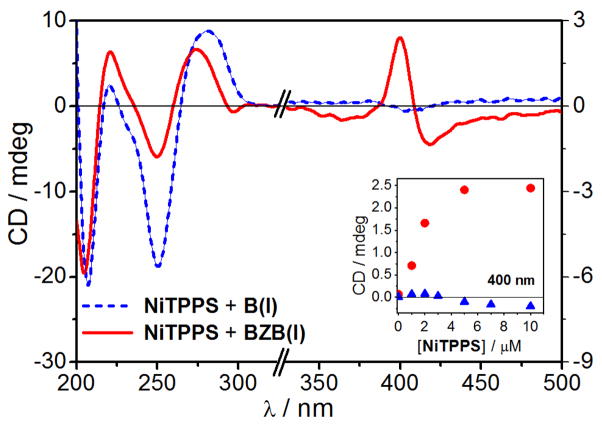
CD spectra of NiTPPS (5 μM) in presence of BZB(I) (100 μM + 100 μM NiCl2 + 6 μM spermine, red curve) and in presence of B(I) (100 μM + 100 μM MgCl2 + 6 μM spermine, blue dashed curve). Inset: CD signal at 400 nm as a function of [NiTPPS] in presence of BZB(I) (red circles) and B(I) (blue triangles).
In order to explore the full potential of NiTPPS, we decided to test the spectroscopic sensing of Z-DNA fragments in the non-condensed DNA. We identified suitable experimental conditions that would allow the formation of Z-DNA fragments in short oligonucleotides at low ionic strength without DNA condensation. Spermine4+ failed to induce a Z-form in BZ and BZB [18]. However, the successive addition of micromolar concentrations of Ni(II) and spermine4+ allowed the B- to Z-DNA transition of the central GC tract without DNA aggregation. Spermine4+ is a ubiquitous cellular component and was added to shield the repulsion between phosphate backbone and anionic NiTPPS. The addition of NiTPPS yielded a negative exciton coupled CD signal (negative Cotton effect at 420 nm and positive Cotton effect at 400 nm) in the Soret band region (Fig. 5, red curve). A weak negative ICD signal was observed when NiTPPS was added to the control B(I) sequence (Fig. 5 and S7b). The absorption spectra did not show any significant changes of NiTPPS Soret band in presence of the BZB(I) sequence (see Fig. S8). The saturation of the negative bisignate ICD signal indicated that the ICD originated from the through space exciton coupling between the porphyrins’ electronic dipoles when bound to DNA where limited number of suitable binding sites were available.
In conclusion, we report a very selective and sensitive spectroscopic detection of a Z-DNA fragment embedded in B-DNA in condensed as well as non-condensed DNA sequences using anionic Ni(II) porphyrin, NiTPPS. Anionic NiTPPS provided a more sensitive spectroscopic recognition of Z-DNA than previously reported cationic ZnT4. A combination of micromolar concentrations of Ni(II) and spermine4+ allowed us to prepare and detect the Z-DNA fragment in short non-condensed oligonucleotides with high sensitivity and selectivity. An intense ICD signal (~400 nm) was observed upon addition of NiTPPS to BZ and BZB DNA sequences. The ICD signal and its shape are dependent on the stage of Z-DNA condensation and allowed the distinction between condensed Z-DNA (positive bisignate CD couplet) and non-condensed Z-DNA (negative bisignate CD couplet).
Supplementary Material
Acknowledgments
MB thanks the University of Wyoming Start-Up Fund. AEH thanks the NIH, Grant P20 RR016469 from the INBRE Programs of the National Center for Research Resources; the NSF-EPSCoR-EPS-1004094 and the NSF CHE-0747949.
Appendix A. Supplementary data
Supplementary data associated with this article can be found online.
Footnotes
Publisher's Disclaimer: This is a PDF file of an unedited manuscript that has been accepted for publication. As a service to our customers we are providing this early version of the manuscript. The manuscript will undergo copyediting, typesetting, and review of the resulting proof before it is published in its final citable form. Please note that during the production process errors may be discovered which could affect the content, and all legal disclaimers that apply to the journal pertain.
References
- 1.Pohl FM, Jovin TM. J Mol Biol. 1972;67:375–396. doi: 10.1016/0022-2836(72)90457-3. [DOI] [PubMed] [Google Scholar]
- 2.Ditlevson JV, Tornaletti S, Belotserkovskii BP, Teijeiro V, Wang G, Vasquez KM, Hanawalt PC. Nucleic Acid Res. 2008;36:3163–3170. doi: 10.1093/nar/gkn136. [DOI] [PMC free article] [PubMed] [Google Scholar]
- 3.Droge P. Bioessays. 1994;16:91–99. doi: 10.1002/bies.950160205. [DOI] [PubMed] [Google Scholar]
- 4.Kim YG, Lowenhaupt K, Oh DB, Kim KK, Rich A. Proc Natl Acad Sci USA. 2004;101:1514–1518. doi: 10.1073/pnas.0308260100. [DOI] [PMC free article] [PubMed] [Google Scholar]
- 5.Kwon JA, Rich A. Proc Natl Acad Sci USA. 2005;102:12759–12764. doi: 10.1073/pnas.0506011102. [DOI] [PMC free article] [PubMed] [Google Scholar]
- 6.Herbert A, Lowenhaupt K, Spitzner J, Rich A. Proc Natl Acad Sci USA. 1995;92:7550–7554. doi: 10.1073/pnas.92.16.7550. [DOI] [PMC free article] [PubMed] [Google Scholar]
- 7.Dickerson E, Drew HR, Conner BN, Wing RM, Fratini AV, Kopka ML. Science. 1982;216:475–485. doi: 10.1126/science.7071593. [DOI] [PubMed] [Google Scholar]
- 8.Belmont P, Constant JF, Demeunyck M. Chem Soc Rev. 2001;30:70–75. [Google Scholar]
- 9.Saenger W. Principles of Nucleic Acid. Springer-Velag; New York: 1988. pp. 283–297. [Google Scholar]
- 10.Parkinson A, Hawken M, Hall M, Sanders KJ, Rodger A. Phys Chem Chem Phys. 2000;2:5469–5478. [Google Scholar]
- 11.Krzyaniak A, Salaski P, Jurczak J, Barciszewski J. FEBS Lett. 1991;279:1–4. doi: 10.1016/0014-5793(91)80235-u. [DOI] [PubMed] [Google Scholar]
- 12.Van Holde KE, Johnson WC, Ho PS. Principles of Physical Biochemistry. 3. Pearson/Prentice Hall; Upper Saddle River, NJ: 1998. [Google Scholar]
- 13.Ivanov VI, Minyat EE. Nucleic Acids Res. 1981;9:4783–4798. doi: 10.1093/nar/9.18.4783. [DOI] [PMC free article] [PubMed] [Google Scholar]
- 14.Hall KB, Maestre MF. Biopolymers. 1984;23:2127–2139. doi: 10.1002/bip.360231103. [DOI] [PubMed] [Google Scholar]
- 15.Harder ME, Johnson WC. Nucleic Acids Res. 1990;18:2141–2148. doi: 10.1093/nar/18.8.2141. [DOI] [PMC free article] [PubMed] [Google Scholar]
- 16.Balaz M, De Napoli M, Holmes AE, Mammana A, Nakanishi K, Berova N, Purrello R. Angew Chem Int Ed. 2005;44:4006–4009. doi: 10.1002/anie.200501149. [DOI] [PubMed] [Google Scholar]
- 17.D’Urso A, Mammana A, Balaz M, Holmes AE, Berova N, Lauceri R, Purrello R. J Am Chem Soc. 2009;131:2046–2047. doi: 10.1021/ja808099u. [DOI] [PubMed] [Google Scholar]
- 18.D’Urso A, Choi JK, Shabbir-Hussain M, Ngwa FN, Lambousis MI, Purrello R, Balaz M. Biochem Biophys Res Commun. 2010;397:329–332. doi: 10.1016/j.bbrc.2010.05.119. [DOI] [PMC free article] [PubMed] [Google Scholar]
- 19.D’Urso A, Holmes AE, Berova N, Balaz M, Purrello R. Chem Asian J. 2011;6:3104–3109. doi: 10.1002/asia.201100161. [DOI] [PubMed] [Google Scholar]
- 20.Choi JK, Sargsyan G, Shabbir-Hussain M, Holmes AE, Balaz M. J Phys Chem B. 2011;115:10182–10188. doi: 10.1021/jp2047213. [DOI] [PMC free article] [PubMed] [Google Scholar]
- 21.Moller A, Nordheim A, Kozlowski SA, Patel DJ, Rich A. Biochemistry. 1984;23:54–62. doi: 10.1021/bi00296a009. [DOI] [PubMed] [Google Scholar]
Associated Data
This section collects any data citations, data availability statements, or supplementary materials included in this article.


