Abstract
Recurrent episodes of tuberculosis (TB) can be due to relapse of latent infection or exogenous reinfection, and discrimination is crucial for control planning. Molecular genotyping of Mycobacterium tuberculosis isolates offers concrete opportunities to measure the relative contribution of reinfection in recurrent disease. Here, a mathematical model of TB transmission is fitted to data from 14 molecular epidemiology studies, enabling the estimation of relevant epidemiological parameters. Meta-analysis reveals that rates of reinfection after successful treatment are higher than rates of new TB, raising an important question about the underlying mechanism. We formulate two alternative mechanisms within our model framework: (i) infection increases susceptibility to reinfection or (ii) infection affects individuals differentially, thereby recruiting high-risk individuals to the group at risk for reinfection. The second mechanism is better supported by the fittings to the data, suggesting that reinfection rates are inflated through a population phenomenon that occurs in the presence of heterogeneity in individual risk of infection. As a result, rates of reinfection are higher when measured at the population level even though they might be lower at the individual level. Finally, differential host recruitment is modulated by transmission intensity, being less pronounced when incidence is high.
Keywords: tuberculosis epidemiology, transmission dynamics, partial immunity, reinfection
1. Introduction
Despite significant improvements in tuberculosis (TB) treatment over recent years, adequately treated patients are still at high risk of developing recurrent pulmonary disease (defined as an episode of TB following the cure of a previous episode). Recent estimates for the recurrence rate of TB across different regions point to an average of 2290 cases per 100 000 person-years at 12 months after treatment completion. In high-incidence regions, the average TB recurrence rate can reach 7850 per 100 000 person-years [1].
The contribution of exogenous reinfection with Mycobacterium tuberculosis (Mtb) versus that of endogenous reactivation (relapse) of latent Mtb to the overall rate of recurrence of pulmonary disease is subject to controversies because these two mechanisms cannot be easily disentangled. Deciphering the weight of each of these mechanisms is of great importance for policy-making. Advances in DNA fingerprinting techniques allowed the genotyping of the Mtb, causing different disease episodes [2]. These methods can reveal whether a new episode of disease is caused by infection with the same strain that caused a previous episode or a different one, enabling a classification into relapse or reinfection, respectively.
Longitudinal data from molecular epidemiological studies on TB reinfection have shown a positive correlation between the proportion of reinfection in recurrent cases and local incidence [3]. A long-term study, in an area of South Africa, with particularly high incidence, attributed the majority (77%) of recurrent TB cases to reinfection [4]. Moreover, the rate of TB reinfection was found to be four times higher than that of new TB, raising an important question about the underlying mechanism. Two possibilities have been proposed to explain these results: (i) infection increases susceptibility to reinfection or (ii) infection occurs at a higher rate in a high-risk subpopulation [5].
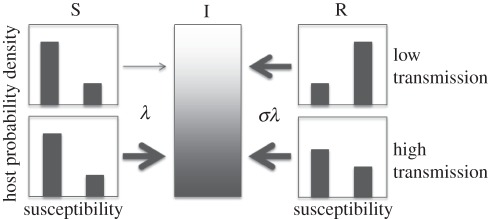
We address this question by constructing a general framework for TB transmission that encapsulates both mechanisms, and assess its capability to fit available data relating TB incidence and reinfection proportion among recurrent cases, in 14 regions throughout the world. The dataset was gathered by systematic literature review. The model postulates that some individuals are a priori more likely to be infected owing to enhanced susceptibility or exposure [6–8]. Infection is more likely to affect individuals at higher risk, who will naturally be over-represented in the treated subpopulation to a degree that is modulated by transmission intensity (illustrated in figure 1). This process alone acts to inflate the rate of reinfection at the population level, even if infection confers partial protection at the individual level. The relative susceptibility of individuals who have been previously infected over those who are naive is represented by a parameter σ, the value of which will be estimated by the fitting procedure.
Figure 1.
Diagram illustrating host selection. In a population with a heterogeneous susceptibility profile, infection tends to affect individuals at higher risk. This skews the distribution of recovered individuals towards higher susceptibility, which explains the increased reinfection rates in this subpopulation. Host selection is modulated by transmission intensity and its effect is weaker under higher transmission.
2. Methods
(a). Literature review
Through a systematic literature review, we aggregated data on recurrent TB and its relationship with TB incidence. Published epidemiological studies were located via PubMed through searches on the following terms: tuberculosis, recurrent, relapse, reinfection or re-infection. Studies were included in the analysis if fulfilling the following criteria:
— study reports the number of recurrent TB cases, defined positive culture after bacteriologically confirmed cure or complete treatment following a first episode;
— study reports more than 10 recurrent TB cases;
— study discriminates between reinfection and relapse by comparing Mtb DNA fingerprinting profiles of the initial and recurrent episodes; and
— population-based study published up to March 2011.
We extracted the data for the local incidence from the study papers whenever possible. When no incidence was reported in the study itself, we used the estimates for the year 2000 in the respective country, provided by the World Health Organization [9]. The proportion of reinfection was defined as the ratio between the number of patients with reinfection and all recurrent TB cases. One study performed in Cape Town also provided the ratio between the rate of reinfection TB in successfully treated patients and the rate of new cases of TB [4].
(b). Mathematical formulation
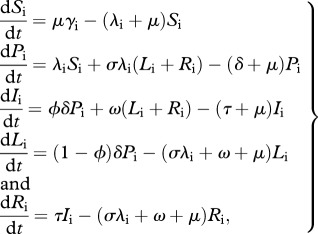
A mathematical model [10,11] is extended by enabling the risk of infection to be heterogeneously distributed among the population. The transmission model is replicated in two subpopulations, indexed by i = 1,2, such that immunologically naive individuals in subpopulation 1 (low risk) are subject to a per capita rate of infection (λ1 = α1λ), whereas in subpopulation 2 (high risk) infection occurs at a higher rate (λ2 = α2λ), where α1 < α2, and γ1, γ2 are the proportions of the population in each risk group. Within each group, individuals are classified—according to their infection history—into susceptible (Si), primary infection (Pi), latent (Li), active pulmonary tuberculosis (Ii) and recovered (Ri). Latent and recovered individuals can be reinfected at a rate that is proportional to the rate of first infection, with multiplicative factor σ. The model is written as a system of differential equations
 |
2.1 |
where μ (=1/70 yr−1) is the birth and death rate, ϕ (=0.05) is the proportion of primary infections progressing to active pulmonary disease, and τ (=2 yr−1) is the rate at which infectious individuals are detected and treated. An auxiliary parameter δ (=12 yr−1) is included to represent the rate of progression from primary infection, although this can be interpreted only in conjugation with other parameters. For example, the rate of progression from primary infection to disease is ϕδ (=0.6 yr−1). The value for μ is consistent with human populations with life expectancy of 70 years, whereas ϕ and τ are consistent with the medical literature [12]. The rate of relapse (ω) is fixed at the higher end of published estimates (ω = 0.01 yr−1) [13–17], with justification and sensitivity analysis provided in the electronic supplementary material. Parameters referring to the reinfection factor (σ) and risk heterogeneity are estimated in order to adjust the equilibrium model solutions to the available data. By noting that γ1 and γ2 are proportions, and thus γ1 + γ2 = 1, and by normalizing the average risk factor such that γ1α1 + γ2α2 = 1, heterogeneity is fully parametrized by the low-risk parameters, γ1 (≡γ) and α1 (≡α). The parameters are listed in table 1.
Table 1.
Model parameters.
| symbol | definition | value |
|---|---|---|
| μ | birth and death rate | 1/70 yr−1 |
| ϕ | proportion progressing from primary infection to disease | 0.05 |
| δ | rate of progression from primary infection | 12 yr−1 |
| τ | rate at which infectious individuals are detected and treated | 2 yr−1 |
| ω | rate of endogenous reactivation | 0.01 yr−1 |
| σ | reinfection factor | estimated |
| γ | proportion low-risk group | estimated |
| α | low-risk factor | estimated |
(c). Measures of incidence
TB incidence (cases per 100 000 person-years) is calculated from the equilibrium proportion of infectious individuals as
 |
2.2 |
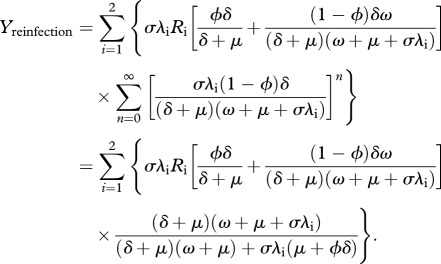
Following the criteria used in the data collection, we classify a recurrent TB case as an individual who enters the infectious class after having gone through the recovered class. This combines two pathways: relapse while in the recovered class, Yrelapse; and exogenous reinfection with progression to active disease, Yreinfection (direct or following a latent period). We derive these quantities formally from equation (2.1). The instantaneous rate of relapse after successful treatment is the sum of Ri → Ii transitions
 |
2.3 |
while the instantaneous rate of reinfection after successful treatment is the sum of  and
and  transitions for any number (n) of iterations of the cycle
  , derived as
 |
2.4 |
Hence, the proportion of reinfection over all recurrent TB after successful treatment is
| 2.5 |
The rate of new TB is given by
 |
2.6 |
Finally, for comparison with the Cape Town study [4], we define κ as the ratio of the rate of reinfection TB among successfully treated patients over the rate of new TB cases among those who have never had a TB episode, formally calculated as
| 2.7 |
(d). Meta-analysis
We perform a meta-analysis of the relationship between the proportion of reinfection in recurrent TB (p) and the incidence of TB (Y) by fitting the model described in equation (2.1) to the dataset collected by the systematic literature review. By taking the incidence rate as an independent variable of a nonlinear regression, we estimate the set of model parameters that best describe the observed trends in the proportion of TB reinfection. First, we have considered a model where the host population is homogeneous with respect to risk of infection, and proceeded to assess whether heterogeneity would significantly improve the ability of the model to fit to the data. A Gaussian–Newton algorithm was implemented to fit the model output to the data according to the least-squares criterion. We used an F-test and a log-likelihood test to assess whether the heterogeneous model provides a significantly better fit to the data.
3. Results
We conducted a systematic literature review and found 14 molecular epidemiological studies reporting the proportion of reinfection in recurrent TB across communities presenting a wide range of endemic levels [3,4,18–29]. Table 2 summarizes the data collected.
Table 2.
Data collected from the systematic literature review.
| region | TB incidence per 100 000 | reinfection proportion (p) | reference |
|---|---|---|---|
| US and Canada | 6a | 0.04 (3/75) | Jasmer et al. [18] |
| Australia | 8a | 0.27 (4/15) | Dobler et al. [19] |
| Denmark | 13a | 0.26 (19/73) | Bang et al. [20] |
| Lombardy | 18 | 0.16 (5/32) | Bandera et al. [21] |
| Houston | 19 | 0.24 (6/25) | El Sahly et al. [22] |
| Spain | 34a | 0.20 (8/40) | Martín et al. [23] |
| Taiwan | 62 | 0.51 (25/49) | Wang et al. [3] |
| China | 107a | 0.62 (32/52) | Shen et al. [24] |
| Madras | 184a | 0.31 (9/29) | Sahadevan et al. [25] |
| India | 184a | 0.50 (24/48) | Narayanan et al. [26] |
| Bangladesh | 242a | 0.14 (5/35) | Shamputa et al. [27] |
| Rwanda | 405a | 0.31 (4/13) | Umubyeyi et al. [28] |
| Malawi | 447a | 0.33 (13/39) | Crampin et al. [29] |
| Cape Town | 761 | 0.77 (24/31) | Verver et al. [4] |
aWHO estimates for TB incidence in 2000.
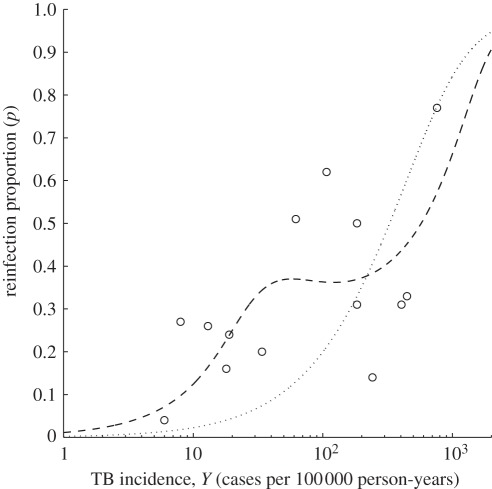
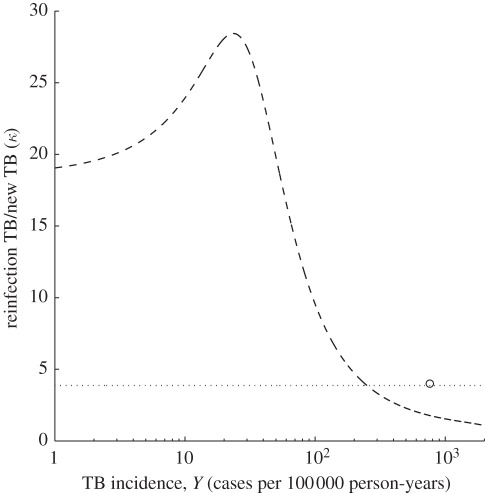
Figure 2 shows the output of the homogeneous and heterogeneous versions of equation (2.1) that best fit the dataset, whereas the estimated parameters are listed in table 3. The figure shows the proportion of reinfection TB in recurrent cases (p) versus TB incidence (Y) at equilibrium. The model shows a markedly nonlinear relationship between the proportion of reinfection and local incidence, which was not captured by previous studies [3]. The ratio (κ) of the rate of reinfection TB over the rate of new TB predicted by the model is plotted in figure 3, where it can be confronted with the measure obtained for Cape Town [4]. Although the data published by the other 13 studies do not enable the calculation of this quantity, the homogeneous model predicts equally high values, whereas under the heterogeneous model, we expect higher ratios in all regions that report lower incidence than Cape Town.
Figure 2.
Proportion (p) of reinfection among recurrent tuberculosis (TB) cases as a function of TB incidence. Open circles correspond to the data described in table 2. Curves correspond to the best-fitting model under the two assumptions: homogeneous host population (dotted) and heterogeneous host population (dashed).
Table 3.
Estimated parameter values.
| parameter | heterogeneous model | homogeneous model |
|---|---|---|
| γ | 0.98 [0.95, 1.00]a | n.a. |
| α | 0.15 [0.00, 0.56]a | n.a. |
| σ | 0.51 [0.00, 2.37]a | 3.87 [1.61, 7.79]a |
| residual sum of squares | 0.30 | 0.74 |
| standard error estimate | 0.16 | 0.24 |
| F-test | 8.12 (0.007)b | n.a. |
| log-likelihood test | 12.70 (0.002)b | n.a. |
aMode [95% CI]. bScore (p-value).
Figure 3.
Model predictions for the ratio (κ) of the rate of reinfection tuberculosis (TB) after successful treatment by the rate of new TB as a function of TB incidence. Open circle corresponds to the Cape Town study [4]. Curves are generated by the best-fitting models identified in figure 2: homogeneous host population (dotted) and heterogeneous host population (dashed).
Noting that the homogeneous model is nested within the heterogeneous, we have calculated the F-test statistic to show that heterogeneity enables a significantly better fit to the data (table 3). The best scenario provided by this analysis estimates the heterogeneity parameters as γ = 0.98 and α = 0.15, suggesting that the risk of infection is about 40 times higher than average in the 2 per cent subpopulation at highest risk. Although these are necessarily crude approximations that enabled the model to simultaneously fit a vast spectrum of epidemiological scenarios, they can serve as a basis for further resolution in a region-specific manner. The estimated reinfection factor (σ = 0.51) indicates that previous infection has a protective effect, contrary to a model proposed previously [30].
4. Discussion
We propose a minimal model for TB transmission to describe the relative contributions of reinfection and relapse to recurrent TB across a range of transmission intensities. A nonlinear relation between the proportion of reinfection and the local incidence is derived by fitting this mechanistic model to the dataset resulting from a systematic literature review. By accounting for heterogeneity in the risk of infection, we obtain significantly better model fittings to epidemiological data. This trend is in agreement with current understanding of TB transmission, especially in regions of low to moderate transmission, where TB is confined to particular risk groups with sporadic small outbreaks in the general population [31,32], and has been previously noted in theoretical studies [33]. Infection acts upon this variation and predominantly recruits those individuals at higher risk to the recovered category, thus inflating the rate of reinfection (as illustrated in figure 1). As a result, population measures of reinfection rates in relation to first infection (κ) are higher than the reinfection factor at the individual level, σ.
The model predicts that, under heterogeneity, regions of low to moderate transmission support relatively higher κ than regions of high transmission. This is again owing to the way differential recruitment acts upon individuals at higher risk. For highly endemic regions, transmission intensity tends to homogenize the distributions of both susceptible and recovered individuals, making differential recruitment less pronounced [34]. Cape Town is the only study reporting the information required to estimate this ratio. Similar studies providing this data for other regions would be very valuable to confirm the validity and increase the accuracy of the results reported here.
The parameter estimation procedure (provided in the electronic supplementary material) supports higher relapse rates than those previously stated for European countries [14,15], whereas recent studies in African [13] and Asian [16,17] regions suggest values that are compatible with those considered here. This may be due to higher prevalence of co-infection with HIV in those settings or simply reflect regional differences in nutrition, smoking patterns, environmental conditions, population structure or the natural history of TB [16,17,35,36]. Despite these acknowledged differences, we have opted for constancy across regions in model parameters, with the exception of the force of infection, because our objective is to make inferences about the global epidemiology of TB. These inferences were enabled by further assuming regional equilibrium conditions and selecting the set of model parameter values that best reproduce the trends of reinfection rates in relation to TB incidence.
Acknowledgements
We thank Antonio Coutinho, Jim Koopman and Graham Medley for valuable discussions. This research was supported by Fundação para a Ciência e a Tecnologia (FCT) and European Commission (grant nos. MEXT-CT-2004-14338 and EC-ICT-231807). C.R. was supported by FCT, PEst OE/MAT/UI0209/2011. C.J.S. was partially funded by CNPq and FAPERJ.
References
- 1.Panjabi R., Comstock G. W., Golub J. E. 2007. Recurrent tuberculosis and its risk factors: adequately treated patients are still at high risk. Int. J. Tuberc. Lung Dis. 11, 828–837 [PubMed] [Google Scholar]
- 2.McNabb S. J., Braden C. R., Navin T. R. 2002. DNA fingerprinting of Mycobacterium tuberculosis: lessons learned and implications for the future. Emerg. Infect. Dis. 8, 1314–1319 10.3201/eid0811.020402 (doi:10.3201/eid0811.020402) [DOI] [PMC free article] [PubMed] [Google Scholar]
- 3.Wang J.-Y., Lee L.-N., Lai H.-C., Hsu H.-L., Liaw Y.-S., Hsueh P.-R., Yang P.-C. 2007. Prediction of the tuberculosis reinfection proportion from the local incidence. J. Infect. Dis. 196, 281–288 10.1086/518898 (doi:10.1086/518898) [DOI] [PubMed] [Google Scholar]
- 4.Verver S., Warren R. M., Beyers N., Richardson M., van der Spuy G. D., Borgdorff M. W., Enarson D. A., Behr M. A., van Helden P. D. 2005. Rate of reinfection tuberculosis after successful treatment is higher than rate of new tuberculosis. Am. J. Respir. Crit. Care Med. 171, 1430–1435 10.1164/rccm.200409-1200OC (doi:10.1164/rccm.200409-1200OC) [DOI] [PubMed] [Google Scholar]
- 5.Yew W. W., Leung C. C. 2005. Are some people not safer after successful treatment of tuberculosis? Am. J. Respir. Crit. Care Med. 171, 1324–1325 10.1164/rccm.2502005 (doi:10.1164/rccm.2502005) [DOI] [PubMed] [Google Scholar]
- 6.Austin J. F., Dick J. M., Zwarenstein M. 2004. Gender disparity amongst TB suspects and new TB patients according to data recorded at South African Institute of Medical Research laboratory for the Western Cape Region of South Africa. Int. J. Tuberc. Lung Dis. 8, 435–439 [PubMed] [Google Scholar]
- 7.Sonnenberg P., Murray J., Glynn J. R., Shearer S., Kambashi B., Godfrey-Faussett P. 2001. HIV-1 and recurrence, relapse, and reinfection of tuberculosis after cure: a cohort study in South African mineworkers. Lancet 358, 1687–1693 10.1016/S0140-6736(01)06712-5 (doi:10.1016/S0140-6736(01)06712-5) [DOI] [PubMed] [Google Scholar]
- 8.Hoal E. G., et al. 2004. SLC11A1 (NRAMP1) but not SLC11A2 (NRAMP2) polymorphisms are associated with susceptibility to tuberculosis in a high-incidence community in South Africa. Int. J. Tuberc. Lung Dis. 8, 1464–1471 [PubMed] [Google Scholar]
- 9.World Health Organization 2002. Global tuberculosis control: epidemiology, strategy, financing. WHO/CDS/TB/2002.295. Geneva, Switzerland: World Health Organization [Google Scholar]
- 10.Gomes M. G. M., Franco A. O., Gomes M. C., Medley G. F. 2004. The reinfection threshold promotes variability in tuberculosis epidemiology and vaccine efficacy. Proc. R. Soc. Lond. B 271, 617–623 10.1098/rspb.2003.2606 (doi:10.1098/rspb.2003.2606) [DOI] [PMC free article] [PubMed] [Google Scholar]
- 11.Gomes M. G. M., Rodrigues P., Hilker F. M., Mantilla-Beniers N. B., Muehlen M., Paulo A. C., Medley G. F. 2007. Implications of partial immunity on the prospects for tuberculosis control by post-exposure interventions. J. Theor. Biol. 248, 608–617 10.1016/j.jtbi.2007.06.005 (doi:10.1016/j.jtbi.2007.06.005) [DOI] [PubMed] [Google Scholar]
- 12.Small P. M., Fujiwara P. I. 2001. Management of tuberculosis in the United States. N. Engl. J. Med. 345, 189–200 10.1056/NEJM200107193450307 (doi:10.1056/NEJM200107193450307) [DOI] [PubMed] [Google Scholar]
- 13.Mills H. L., Cohen T., Colijn C. 2011. Modelling the performance of isoniazid preventive therapy for reducing tuberculosis in HIV endemic settings: the effect of network structure. J. R. Soc. Interface 8, 1510–1520 10.1098/rsif.2011.0160 (doi:10.1098/rsif.2011.0160) [DOI] [PMC free article] [PubMed] [Google Scholar]
- 14.Vynnycky E., Fine P. E. M. 1997. The natural history of tuberculosis: the implications of age-dependent risks of disease and the role of reinfection. Epidemiol. Infect. 119, 183–201 10.1017/S0950268897007917 (doi:10.1017/S0950268897007917) [DOI] [PMC free article] [PubMed] [Google Scholar]
- 15.Tocque K., Bellis M. A., Tam C. M., Chan S. L., Syed Q., Remmington T., Davies P. D. O. 1998. Long-term trends in tuberculosis comparison of age-cohort data between Hong Kong and England and Wales. Am. J. Respir. Crit. Care Med. 158, 484–488 [DOI] [PubMed] [Google Scholar]
- 16.Vynnycky E., Borgdorff N. W., Leung C. C., Tam C. M., Fine P. E. M. 2008. Limited impact of tuberculosis control in Hong Kong: attributable to high risks of reactivation disease. Epidemiol. Infect. 136, 943–952 10.1017/S0950268807008552 (doi:10.1017/S0950268807008552) [DOI] [PMC free article] [PubMed] [Google Scholar]
- 17.Peng W., Lau E. H. Y., Cowling B. J., Leung C. C., Tam C. M., Leung G. M. 2011. The transmission dynamics of tuberculosis in a recently developed Chinese City. PLoS ONE 5, e10468. 10.1371/journal.pone.0010468 (doi:10.1371/journal.pone.0010468) [DOI] [PMC free article] [PubMed] [Google Scholar]
- 18.Jasmer R. M., Bozeman L., Schwartzman K., Cave M. D., Saukkonen J. J., Metchock B., Khan A., Burman W. J. 2004. Recurrent tuberculosis in the United States and Canada: relapse or reinfection? Am. J. Respir. Crit. Care Med. 170, 1360–1366 10.1164/rccm.200408-1081OC (doi:10.1164/rccm.200408-1081OC) [DOI] [PubMed] [Google Scholar]
- 19.Dobler C. C., Crawford A. B. H., Jeffs P. J., Gilbert G. L., Marks G. B. 2009. Recurrence of tuberculosis in a low-incidence setting. Eur. Respir. J. 33, 160–167 10.1183/09031936.00104108 (doi:10.1183/09031936.00104108) [DOI] [PubMed] [Google Scholar]
- 20.Bang D., Andersen A. B., Thomsen V. O., Lillebaek T. 2010. Recurrent tuberculosis in Denmark: relapse versus re-infection. Int. J. Tuberc. Lung Dis. 14, 447–453 [PubMed] [Google Scholar]
- 21.Bandera A., et al. 2001. Molecular epidemiology study of exogenous reinfection in an area with a low incidence of tuberculosis. J. Clin. Microbiol. 39, 2213–2218 10.1128/JCM.39.6.2213-2218.2001 (doi:10.1128/JCM.39.6.2213-2218.2001) [DOI] [PMC free article] [PubMed] [Google Scholar]
- 22.El Sahly H. M., Wright J. A., Soini H., Bui T. T., Williams-Bouyer N., Escalante P., Musser J. M., Graviss E. A. 2004. Recurrent tuberculosis in Houston, Texas: a population-based study. Int. J. Tuberc. Lung Dis. 9, 333–340 [PubMed] [Google Scholar]
- 23.Martín A., Herranz M., Navarro Y., Lasarte S., Serrano M. J. R., Bouza E., de Viedma D. G. 2011. Evaluation of the inaccurate assignment of mixed infections by MTB as exogenous reinfection and analysis of the potential role of bacterial factors in reinfection. J. Clin. Microbiol. 49, 1331–1338 10.1128/JCM.02519-10 (doi:10.1128/JCM.02519-10) [DOI] [PMC free article] [PubMed] [Google Scholar]
- 24.Shen G., Xue Z., Shen X., Sun B., Gui X., Shen M., Mei J., Gao Q. 2006. Recurrent tuberculosis and exogenous reinfection, Shanghai, China. Emerg. Infect. Dis. 12, 1776–1778 10.3201/eid1211.051207 (doi:10.3201/eid1211.051207) [DOI] [PMC free article] [PubMed] [Google Scholar]
- 25.Sahadevan R., Narayanan S., Paramasivan C. N., Prabhakar R., Narayanan P. R. 1995. Restriction fragment length polymorphism typing of clinical isolates of Mycobacterium tuberculosis from patients with pulmonary tuberculosis in Madras, India, by use of direct-repeat probe. J. Clin. Microbiol. 33, 3037–3039 [DOI] [PMC free article] [PubMed] [Google Scholar]
- 26.Narayanan S., et al. 2010. Impact of HIV infection on the recurrence of tuberculosis in South India. J. Infect. Dis. 201, 691–703 10.1086/650528 (doi:10.1086/650528) [DOI] [PubMed] [Google Scholar]
- 27.Shamputa I. C., Van Deun A., Salim M. A., Hossain M. A., Fissette K., de Rijk P., Rigouts L., Portaels F. 2007. Endogenous reactivation and true treatment failure as causes of recurrent tuberculosis in a high incidence setting with a low HIV infection. Trop. Med. Int. Health 12, 700–708 10.1111/j.1365-3156.2007.01840.x (doi:10.1111/j.1365-3156.2007.01840.x) [DOI] [PubMed] [Google Scholar]
- 28.Umubyeyi A. N., Shamputa I. C., Rigouts L., Dediste A., Karita E., Struelens M. J., Portaels F. 2007. Molecular investigation of recurrent tuberculosis in patients from Rwanda. Int. J. Tuberc. Lung Dis. 11, 860–867 [PubMed] [Google Scholar]
- 29.Crampin A. C., Mwaungulu J. N., Mwaungulu F. D., Mwafulirwa D. T., Munthali M., Floyd S., Fine P. E. M., Glynn J. R. 2010. Recurrent TB: relapse or reinfection? The effect of HIV in a general population cohort in Malawi. AIDS 24, 417–426 10.1097/QAD.0b013e32832f51cf (doi:10.1097/QAD.0b013e32832f51cf) [DOI] [PMC free article] [PubMed] [Google Scholar]
- 30.Uys P., van Helden P. D., Hargrove J. W. 2009. Tuberculosis reinfection rate as a proportion of total infection rate correlates with the logarithm of the incidence rate: a mathematical model. J. R. Soc. Interface 6, 11–15 10.1098/rsif.2008.0184 (doi:10.1098/rsif.2008.0184) [DOI] [PMC free article] [PubMed] [Google Scholar]
- 31.Nardell E., McInnis B., Thomeas B., Weidhaas S. 1986. Exogenous reinfection with tuberculosis in a shelter for the homeless. N. Engl. J. Med. 315, 1570–1575 10.1056/NEJM198612183152502 (doi:10.1056/NEJM198612183152502) [DOI] [PubMed] [Google Scholar]
- 32.Story A., Murad S., Verheyen M., Roberts W., Hayward A. C. 2007. Tuberculosis in London: the importance of homelessness, problem drug use and prison. Thorax 62, 667–671 10.1136/thx.2006.065409 (doi:10.1136/thx.2006.065409) [DOI] [PMC free article] [PubMed] [Google Scholar]
- 33.Cohen T., Colijn C., Finklea B., Murray M. 2007. Exogenous re-infection and the dynamics of tuberculosis epidemics: local effects in a network model of transmission. J. R. Soc. Interface 4, 523–531 10.1098/rsif.2006.0193 (doi:10.1098/rsif.2006.0193) [DOI] [PMC free article] [PubMed] [Google Scholar]
- 34.Rodrigues P., Margheri A., Rebelo C., Gomes M. G. M. 2009. Heterogeneity in susceptibility to infection can explain high reinfection rate. J. Theor. Biol. 259, 280–290 10.1016/j.jtbi.2009.03.013 (doi:10.1016/j.jtbi.2009.03.013) [DOI] [PubMed] [Google Scholar]
- 35.Brooks-Pollock E., Cohen T., Murray M. 2010. The impact of realistic age structure in simple models of tuberculosis transmission. PLoS ONE 5, e8479. 10.1371/journal.pone.0008479 (doi:10.1371/journal.pone.0008479) [DOI] [PMC free article] [PubMed] [Google Scholar]
- 36.Trauer J. M., Krause V. L. 2011. Assessment and management of latent tuberculosis infection in a refugee population in the Northern Territory. Med. J. Aust. 194, 579–582 [DOI] [PubMed] [Google Scholar]


