Abstract
Scanning white light interferometry and micro-force measurements were applied to analyse stimulus transformation in strain sensors in the spider exoskeleton. Two compound or ‘lyriform’ organs consisting of arrays of closely neighbouring, roughly parallel sensory slits of different lengths were examined. Forces applied to the exoskeleton entail strains in the cuticle, which compress and thereby stimulate the individual slits of the lyriform organs. (i) For the proprioreceptive lyriform organ HS-8 close to the distal joint of the tibia, the compression of the slits at the sensory threshold was as small as 1.4 nm and hardly more than 30 nm, depending on the slit in the array. The corresponding stimulus forces were as small as 0.01 mN. The linearity of the loading curve seems reasonable considering the sensor's relatively narrow biological intensity range of operation. The slits' mechanical sensitivity (slit compression/force) ranged from 106 down to 13 nm mN−1, and gradually decreased with decreasing slit length. (ii) Remarkably, in the vibration-sensitive lyriform organ HS-10 on the metatarsus, the loading curve was exponential. The organ is thus adapted to the detection of a wide range of vibration amplitudes, as they are found under natural conditions. The mechanical sensitivities of the two slits examined in this organ in detail differed roughly threefold (522 and 195 nm mN−1) in the biologically most relevant range, again reflecting stimulus range fractionation among the slits composing the array.
Keywords: arthropods, slit sensilla, white light interferometry, stimulus transformation, mechanoreception, biomechanics
1. Introduction
Among the arthropods, spiders have the most elaborate system of strain detectors embedded in their exoskeleton. Their lyriform organs form arrays of up to 30 fine slits in the cuticle closely arranged in parallel in widely differing patterns and locations [1]. The majority of the lyriform organs of the spider Cupiennius salei are located in the vicinity of the leg joints. Here, they sense deflections of adjacent leg limbs responding to movement-related forces in the cuticle. The structures of the individual slits of an organ transmitting and transforming the stimulus are the slit in the cuticle, approximately 2 µm wide and up to 200 µm long, the cuticular membrane covering the slit, and the so-called coupling cylinder of the covering membrane where a dendrite of a sensory cell ends [2,3]. Compression of the individual slits perpendicular to their long axis is the adequate and most effective stimulus [3] and the mechanical event the present paper focuses on.
According to recent finite-element (FE) analyses of spider lyriform organs [4,5], even minor variations of the geometry, number and arrangement of the slits substantially affect their deformation and thus stimulation. These studies were carried out to eventually provide models for synthetic slit-shaped strain sensors used for technical applications. In the present study, we applied white light interferometry and micro-force measurements to quantitatively characterize the relation between stimulus load and slit compression with high spatial resolution in living animals.
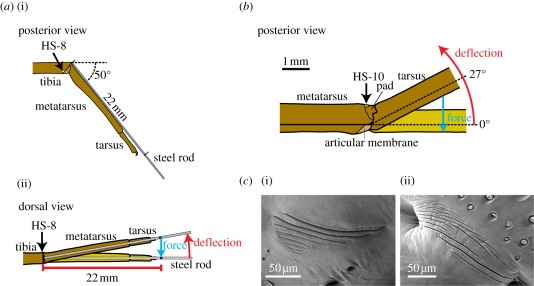
To compare different natural stimulation modes generating cuticular strains, two lyriform organs were selected (figure 1), which had been studied before for other purposes. Lyriform organ HS-8 distally on the tibia is a proprioreceptor effectively stimulated by backward deflections of the metatarsus against the tibia. This organ is involved in kinaesthetic orientation and elicits muscle reflexes when stimulated [6–9]. Direct measurements of strains in the cuticle of freely moving spiders using miniaturized technical strain gauges showed that the organ is compressed and stimulated during the stance phase of a step and hence acts as a cuticular load sensor [10,11]. By contrast, the exteroreceptive lyriform metatarsal organ HS-10 is effectively stimulated when the tarsus moves upwards and presses against the metatarsus where the organ is located. Organ HS-10 is a highly sensitive vibration sensor which the spider uses to detect vibrations generated by prey, mates or predators [12–15]. As recently shown by atomic force microscopy and surface force spectroscopy, the viscoelastic properties of a cuticular pad in front of the organ largely explain its physiological high-pass filtering properties [16].
Figure 1.
(a) Arrangement of the tibia–metatarsus joint for the adequate stimulation of the lyriform organ HS-8. (i) The metatarsus was kept at an angle of 50° to the fixed tibia. (ii) For stimulation under the white light interferometer, the metatarsus was deflected backwards (red arrow) and the forces resisting this deflection (blue arrow) measured at a distance of 22 mm from the pivot point. (b) Arrangement of the metatarsus–tarsus joint for adequate stimulation of the lyriform organ HS-10. The tarsus was deflected upwards (red arrow) and contacted the metatarsal pad at the mechanical threshold angle of 27°. At larger angles, the slits of organ HS-10 were compressed. The force resisting this deflection (blue arrow) was measured directly at the tarsus using the force transducer. (c) (i) Scanning electron micrograph (SEM) of the lyriform organ HS-8; (ii) SEM (courtesy of R. Müllan) of the metatarsal lyriform organ HS-10.
2. Material and methods
2.1. Animals
Adult females of the large Central American wandering spider Cupiennius salei Keyserling (Ctenidae) taken from our breeding stock in Vienna were used for all the experiments. This spider was selected for the present study because it has already been used for many studies in arthropod mechanoreception, including biomechanical, structural and physiological properties of lyriform organs [11,17]. For white light interferometry the hairs covering the lyriform organs were removed by gently wiping the surface with a small pad of cotton after brief anaesthetization of the spider with CO2 and immobilizing it by attaching it onto an aluminium plate with adhesive tape. First or second leg pairs were used for all experiments. Throughout the text, N represents the number of animals used and n denotes the number of experiments.
2.2. Force application
The arrangement of the leg joints and their controlled movements used to measure the forces of adequate stimulation was that already used in previous electrophysiological studies of the same organs [12,18,19] (figure 1).
2.2.1. Lyriform organ HS-8
For the study of lyriform organ HS-8, the tibia was embedded in a mixture of beeswax and colophony except for its distal part (starting 3 mm from the joint with the metatarsus). Organ HS-8 was facing up and the spider could still actively move the joint. An insect pin fixed onto the metatarsus dorsally was coupled to a force transducer (FORT 10, World Precision Instruments) using a small wire loop. A distance of 22 mm from the dorsal edge of the tibia–metatarsus joint was marked on the pin as the point of initial force application (figure 1a). The force transducer was mounted horizontally on a motorized micromanipulator and calibrated with pieces of tin-solder of known mass. The metatarsus was kept at an angle of 50° from the stretched position in the dorsoventral plane relative to the tibia, in agreement with previous electrophysiological studies of the organ [18,19] (figure 1a). The forces were applied using the force transducer by controlled stepwise deflections of the metatarsus towards its posterior aspect and perpendicular to the long axis of the insect pin. The forces resisting deflection were recorded continuously and stored on the hard disk of a computer at a sampling rate of 500 Hz (Biopac MP100 analogue/digital converter; UM 100A interface module; TCI 102 adapter; software ACQ v. 3.7). The vertical deflection of the metatarsus from the initial position was read from the scale of the micromanipulator and the corresponding angle calculated with the tangent function.
2.2.2. Metatarsal organ HS-10
In the case of the metatarsal lyriform organ HS-10, the stimulating force was introduced by deflecting the tarsus upwards directly with the strap of the force transducer. The metatarsus was embedded in beeswax/colophony up to 3 mm away from the organ HS-10. The lyriform organ was pointing upwards (figure 1b).
At the start of a measurement series, the tarsus was carefully aligned with the metatarsus and in parallel to the strap of the force transducer. The distance of the point of force application (outer edge of the force transducer) from the pivot point of the joint was measured using macro-photographs taken from the lateral side of the leg. Then the tarsus was deflected upwards in a stepwise manner. The vertical displacement of the tarsus was read from the scale of the micromanipulator and the angle of deflection calculated using the tangent function. The tarsus was found to make contact with the metatarsus at an upward deflection angle (relative to the horizontal plane) by 27°. This angle, which is in good agreement with previous findings [12,15], was defined as the mechanical threshold deflection angle (figure 1b).
2.3. White light interferometry
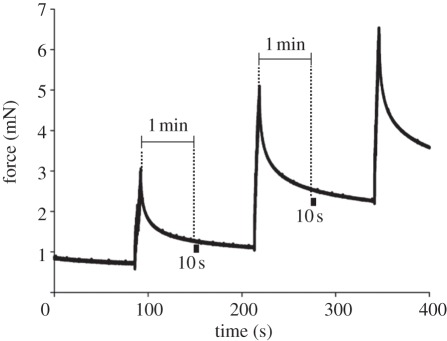
The cuticular surface of the organs and their immediate surroundings were scanned after each stepwise force increase using a scanning white light interferometer (zygo NewView 5010; software MetroPro v. 7.9.0). The entire set-up was placed on a vibration isolation table (TMC micro g). The scans were started 1 min after the deflection of the leg segments, when the interference fringes had stabilized and the measured forces had reached a nearly constant level (figure 2). The scans lasted from 10 s up to 6 min depending on both the selected field of view and the z-range of scanning.
Figure 2.
Measurement of the forces applied to the metatarsus stimulating the tibial lyriform organ HS-8. The white light interference scans were taken 1 min after loading and the corresponding force values read out at the times marked by black bars. The three load steps shown here deflected the metatarsus by 300 µm (0.78°), 600 µm (1.56°) and 900 µm (2.34°) from the initial zero position.
2.4. Data analysis
2.4.1. Force and deflection
The forces corresponding to the interferograms were measured at the start of the interference scans as the mean of the values recorded during the following 10 s (5000 points; s.d. less than 1%; software ACQ; figure 2). The values of vertical deflection read from the micromanipulator were corrected taking the displacement of the force transducer (2.4 µm mN−1) into account.
2.4.2. Three-dimensional interferometry maps
The three-dimensional deformation of the cuticle was measured using image metrology software (SPIP v. 4.1.1). Two-dimensional profiles of the cuticle surface were extracted manually using the same landmarks as points of reference consistently.
2.5. Limitations of the technique
Owing to the time needed for the interference scans, it was not possible to visualize changes in the exoskeleton close to the initial force peak following a loading step (figure 2). Therefore, the results of this study deal with the forces and cuticular deformations at quasi-static loading conditions. Because all measurements were performed on living animals, small-scale deformation of the cuticle owing to haemolymph pressure and muscle activity could not be excluded. However, only data from experiments with no such interferences and no visible signs of movement were analysed.
For the delicate measurements of the width and depth of the individual slits of the lyriform organs, the following sources of measurement error existed. At the maximum optical magnification (×100) of the white light interferometer light reflected from the specimen's surface exceeding an angle of 35° to the horizontal plane was not sent back into the objective lens and therefore not available for the sensor of the instrument. Such data points occurred especially at the rounded edges of the slits, and were automatically set to be invalid by the software of the interferometer and marked as black dots in the interferogram. To reach maximum accuracy, the valid data points closest to the slit edges were used to measure the slit width. An additional factor of uncertainty was the manual superposition of the corresponding lines of the two-dimensional profiles. Manual placement was necessary owing to the horizontal and angular shifts of the slits when the organs were loaded and was carried out with the greatest possible care. Errors up to roughly 4 pixels (0.4 µm) in the horizontal plane in a single measurement could not be excluded and only measurement series exhibiting a significant trend were further analysed.
3. Results
3.1. Forces
3.1.1. Lyriform organ HS-8
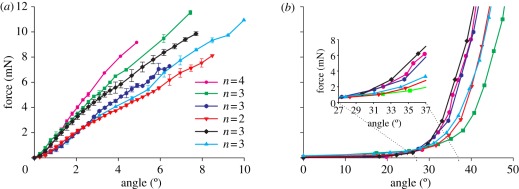
The forces resisting lateral deflections of the metatarsus and stimulating the lyriform organ HS-8 on the tibia increased linearly with the displacement of the metatarsus towards its posterior aspect (figure 3a). The forces rose steadily from the zero degree deflection when the joint socket of the metatarsus just contacted the posterior joint ball at the dorsal aspect of the tibia. The forces followed the deflections in a highly linear way with values between 0.93 and 1.90 mN deg−1 (mean ± s.d., N = 6, n = 18: 1.35 ± 0.36 mN deg−1). The corresponding correlation coefficients R2 of the linear regression line varied between 0.986 and 0.999 (0.994 ± 0.005, mean ± s.d., N = 6, n = 18). The dependence of the metatarsal deflection angle from the force resisting deflection amounted to 0.77 ± 0.19° mN−1 (N = 6, n = 18), taken from linear regression lines (R2 = 0.995 ± 0.003; N = 6) derived from the mean values shown in figure 3a.
Figure 3.
Loading of the exoskeleton of Cupiennius salei to stimulate two different lyriform organs: (a) HS-8 on the tibia and (b) HS-10 on the metatarsus. (a) When stimulating the proprioreceptive organ HS-8 by backward deflection of the metatarsus, the forces increased linearly (N = 6, n = 18). (b) When stimulating the vibration-sensitive metatarsal organ HS-10 by the upward deflection of the tarsus, the forces increased exponentially. Inset: x-axis starts with mechanical threshold at 27° tarsal deflection; note the exponential increase of force from this angle onward (N = 6, n = 6).
3.1.2. Lyriform organ HS-10
In contrast to the linearity found for organ HS-8, the forces needed for dorsal (upward) deflections of the tarsus and leading to the compression and stimulation of the slits of the vibration-sensitive lyriform organ HS-10 rose exponentially (figure 3b). Below 27°, they first increased slowly with increasing tarsal deflection and then quickly beyond the angle marking the contact between the proximal dorsal rim of the tarsus and the joint pad in front of the organ (figure 1b). The force–deflection data could be well described using the function  , where y0 represents the force holding the metatarsus horizontally (0°) which varied only slightly (0.003–0.021 mN; 0.014 ± 0.011 mN, mean ± s.d., N = 6). The corresponding correlation coefficients R2 were between 0.990 and 0.999 (0.995 ± 0.004, mean ± s.d., N = 6). The values of the constant growth factor r determined from these fittings varied between 0.142 and 0.187. Therefore, the relative increase rates of the force varied between 14.2 and 18.7% deg−1 (16.2 ± 1.9% deg−1, mean ± s.d., N = 6).
3.2. Deformation
3.2.1. Lyriform organ HS-8
3.2.1.1. Organ arrangement
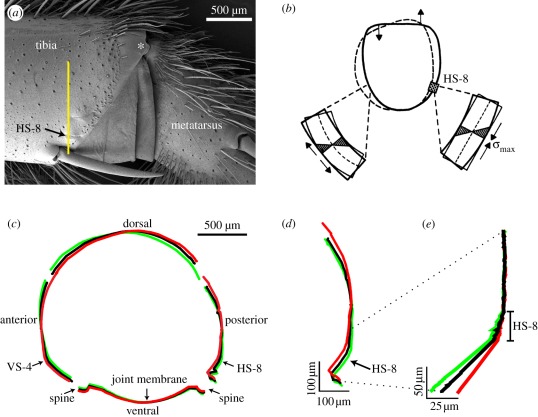
As seen in the surface profiles perpendicular to the long axis of the tibia and roughly also to the slits of lyriform organ HS-8, the organ is surrounded by relatively flat cuticle dorsally and curved cuticle ventrally (figure 4). Close to the middle of the posterior tibia surface there is a point where no deformation of the cuticle was found when deflecting the metatarsus against the tibia (figure 4c,d). Organ HS-8 is located ventral to this point in a mechanically sensitive region of the profile, where pressure stresses in the cuticle run roughly perpendicular to the long axis of the slits of organ HS-8 [20].
Figure 4.
(a) SEM of the posterior aspect of the tibia–metatarsus joint. The yellow line indicates the line corresponding to the surface profiles shown in (d,e). The asterisk marks the pivot point of the joint where the joint ball of the tibia contacts the joint socket on the metatarsus. (b) Simplified schematic of the deformation and stresses in the tibia cuticle in cross section at the site of lyriform organ HS-8 following a backward deflection of the metatarsus. Enlarged sections show bending beams with maximum stress and deformation at the surface. Arrows indicate compression and dilatation. (c) Change of the cross section of the tibia (cuticle surface) at the line in (a) due to differing deflections of the metatarsus. Black, unloaded state; red, backward deflection of the metatarsus by an angle of 10.2°, which effectively stimulates organ HS-8; green, forward deflection of the metatarsus by an angle of 10.2°, which stimulates organ VS-4 on the anterior side of the tibia. (d) Profiles of the posterior tibia surface as indicated in (a) in the resting position (black), and at anteriad (green) and posteriad (red) deflections of the metatarsus by 10.2°. (e) Flattening and bulging of the cuticle at the lyriform organ HS-8 perpendicular to the long axes of the slits. The profiles are superimposed and aligned at the upper right (posterior aspect of the tibia situated dorsal to the organ).
When the metatarsus was deflected towards its posterior aspect during stimulation, the cuticle surrounding organ HS-8 flattened and as a consequence the slits were compressed (figure 4e). In contrast, the slits of organ HS-8 were dilated when the metatarsus was deflected towards its anterior side and the cuticle curvature enhanced. Figure 4c illustrates the interferometrically determined profile of the tibial cuticular cylinder in the resting position and following backward and forward deflections of the metatarsus.
As was readily seen in the white light interferograms, the whole organ moved inward (towards the centre of the tibia) owing to the deformation of the tibia's cross section following the loading of the metatarsus (figures 4c,d and 5a). This vertical displacement followed the magnitude of the applied force and the displacement of the metatarsus linearly with 1.72 ± 0.55 µm deg−1 (R2 = 0.995 ± 0.003; N = 6), and 1.26 ± 0.54 µm mN−1 (R2 = 0.996 ± 0.003; N = 6), respectively. The vertical displacement of the anterior aspect of the tibia (where the lyriform organ VS-4 is located) by 2.40 µm deg−1 (N = 1) was only slightly larger.
Figure 5.
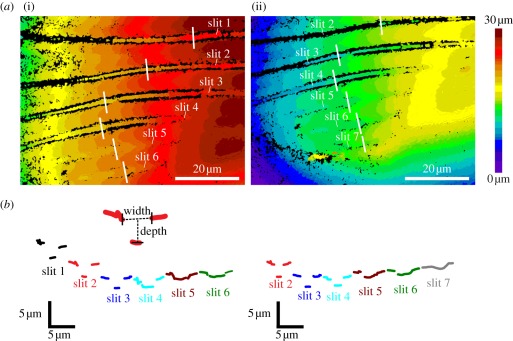
White light interferograms and profiles of the slits of lyriform organ HS-8. (a) (i) Six slits of the unloaded organ. White lines drawn at a right angle to the long axes of the slits and next to the coupling cylinder with the dendrite tip mark the positions of the profiles shown in (b). (ii) Downward-shifted cuticle surface and compressed slits with the metatarsus loaded by 9.96 mN (deflection angle 7.77°). The height (z-axis) is represented by the colour coding. (b) Surface profiles of the slits used for the measurements of slit width and depth corresponding to the interferograms in (a). The inset shows an example (slit 2) of the data points used for the measurement of both slit width and depth.
3.2.1.2. Slit compression
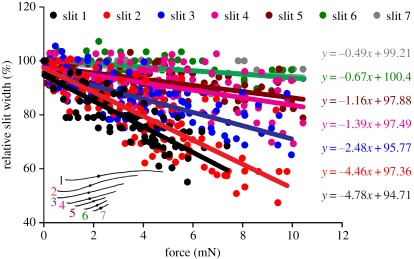
In the absence of a stimulus, the slit widths measured from surface views as indicated in figure 5 amounted to 2.23 ± 0.32 µm for slit 1, 2.29 ± 0.32 µm for slit 2, 2.66 ± 0.38 µm for slit 3, 3.08 ± 0.30 µm for slit 4, 3.27 ± 0.33 µm for slit 5, 3.17 ± 0.26 µm for slit 6 and 2.74 ± 0.59 µm for slit 7 (N = 5). When loading the tibia by the backward deflection of the metatarsus, the compression of the slits of organ HS-8 followed the applied force linearly and the mechanical sensitivity decreased gradually between the longest slit 1 and the shortest slit 7. Close to the dendrite coupling cylinder, slit 1 was compressed by 4.78% mN−1, slit 2 by 4.46% mN−1, slit 3 by 2.48% mN−1, slit 4 by 1.39% mN−1, slit 5 by 1.16% mN−1, slit 6 by 0.67% mN−1 and slit 7 by 0.49% mN−1 (figure 6).
Figure 6.
Width of individual slits determined interferometrically in the lyriform organ HS-8 at the site of the dendrite coupling cylinder (as indicated in the inset) relative to the unloaded state (N = 6, n = 6). The mechanical sensitivity goes down sequentially from 4.78% mN−1 in slit 1 to 0.49% mN−1 in slit 7 as indicated by the linear regression lines.
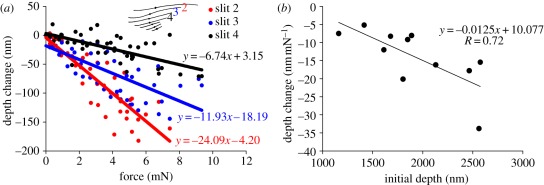
With increased compression, the depth of the trough-shaped outer covering membrane of the slits increased, also seen in slits 2, 3 and 4 selected for these measurements. When loading the organ, the deepest point of the covering membrane of slit 2 (initial depth 2.42 ± 0.06 µm; N = 4) moved downwards by 24 nm mN−1 relative to the slit edges at the dendrite attachment point, followed by slit 3 (initial depth 1.85 ± 0.04 µm; N = 4) with 12 nm mN−1 and slit 4 (initial depth 1.42 ± 0.26 µm; N = 4) with 7 nm mN−1 (figure 7a).
Figure 7.
(a) Gradual increase of the depth of three selected slits of the lyriform organ HS-8 (N = 4, n = 4). Negative values represent an increase of slit depth. (b) Correlation between depth change following stimulation and initial depth of 11 slits (N = 4).
For simple geometrical reasons, Barth [3] predicted that the bending of the covering membrane of the unloaded slits correlates with the membrane's deformability at slit compression. The more the slit membrane is bent inwards in the initial unloaded state, the more the membrane is further bent downwards during compression of the slit. The white light interferometric measurements confirm this prediction, although the value of the increased deformability was as small as 12.5 pm mN−1 per nanometre of initial depth (figure 7b).
3.2.2. Lyriform organ HS-10
3.2.2.1. Organ arrangement
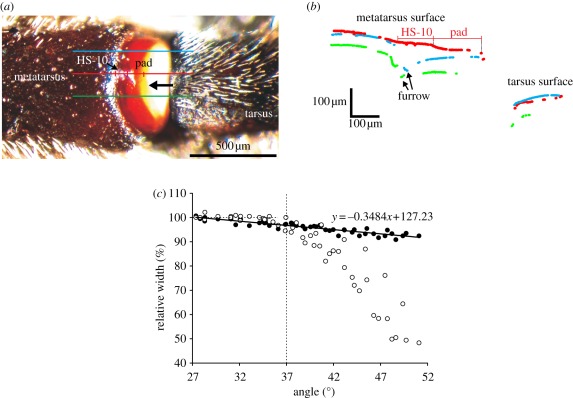
The slits of the metatarsal lyriform organ HS-10 bridge a furrow separating the soft cuticular pad [16] (figure 1b) from the well-sclerotized cuticle at the distal end of the metatarsus (figure 8a). When the tarsus is loaded and deflected upwards, it pushes against the cuticular pad, which transmits the forces to the slits of the lyriform organ and compresses them perpendicular to their long axis [1]. In profiles of the cuticular surface, it could clearly be seen that the furrow in the metatarsal cuticle is roughly 100 µm deep, whereas the cuticular bridge formed by lyriform organ HS-10 continues seamlessly from the ‘normal’ surface level of the metatarsal cuticular cylinder to the cuticular pad (figure 8b). The width of the entire organ HS-10 perpendicular to the long axes of the slits changed linearly with the tarsal deflection angle (figure 8c). Between 27° (mechanical threshold) and approximately 35° of tarsal upward deflection, no significant compression of the pad could be measured under quasi-static loading conditions (figure 8c).
Figure 8.
(a) Dorsal view of the metatarsus–tarsus leg joint with the metatarsal lyriform organ HS-10. At stimulation, the tarsus pushes against the pad on the metatarsus (black arrow) compressing the slits of organ HS-10 perpendicular to their long axes. The colour lines indicate the surface profiles shown in (b). (b) White light interferometric surface profiles taken along the leg's long axis as indicated in (a). The lines of the profiles are broken because of invalid data points. The straight thin red line indicates the length of organ HS-10 and of the cuticular pad in the profiles used for the measurements shown in (c). The blue and the green lines show the surface profiles taken anteriorly and posteriorly of the lyriform organ (see (a)), and clearly represent the furrow between the soft pad and the well-sclerotized cuticle of the metatarsus. (c) Width of organ HS-10 (filled circles) and of the pad (open circles) under increasing load drawn as percentage of the width (100% at 27° tarsal deflection). From an angle of 37° onward, the pad is clearly compressed more than the lyriform organ.
3.2.2.2. Slit compression
The 21 slits of the metatarsal organ HS-10 differ in length and are organized in characteristic groups as described earlier [11,15] (figure 1c). The width of the slits in the unloaded organ varies from approximately 2 to 4 µm when measured as indicated for organ HS-8 in figure 5b.
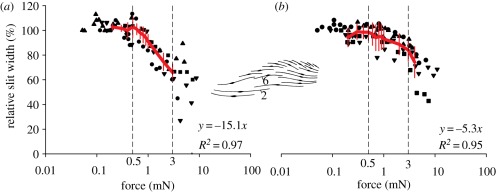
The slits of organ HS-10 were compressed when the tarsus was deflected upwards by more than approximately 27°. The initially widest and longest slits were compressed first, whereas the smaller slits followed successively, which implies a fractionation of the organ's overall range of mechanical sensitivity by the different slits (figure 9). For the measurement of slit width at the site of dendrite coupling to the covering membrane, the long and prominent slits 2 and 6 were selected (inset figure 10). They were easily accessible for measurement and dendrite attachment site could be identified in interferograms taken from the dorsal aspect.
Figure 9.
(a) White light interferograms of the central region of the metatarsal vibration receptor HS-10 of a first left leg under increasing load (from left to right). The uppermost interferogram was taken close to the mechanical threshold corresponding to a deflection of the tarsus by 27°. Note the increasing compression of the slits. The z-axis is represented by the colour code. The white lines are drawn next to the dendrite attachment site. They indicate the positions for the measurement of the widths of slits 2 and 6. Slit 2 spans the entire curvature of the cuticular bridge structure and its dendrite attachment site is located towards the anterior aspect of the leg. Initial width 3.46 ± 0.55 µm (N = 5); length measured on SEM images in a plane 152 µm (figure 1c). Slit 6 is located more proximally and its dendrite attachment site is close to the middle of the cuticular bridge. Unloaded width 3.68 ± 0.91 µm (N = 5), slit length approximately 116 µm (figure 1c). (b) Compression of the slits in (a), compared with a reference measurement with no contact of the force transducer and the tarsus, at increasing tarsal deflection angle (N = 1, n = 1).
Figure 10.
Width of slits (a) 2 and (b) 6 of the metatarsal organ (see inset) under loading relative to the resting position (100%). The red lines connect the mean values (±s.d.) obtained from five measurements (n = 25) in five preparations (N = 5) within the biologically relevant range of forces indicated by the two dashed vertical lines. The slopes of the curves (i.e. relative slit compression per force in mN) and the regression coefficients R2 are given for the same range.
The biologically most relevant sensitivity range of organ HS-10 is between the mechanical threshold (at a tarsal–metatarsal angle of approx. 27°) and 10° beyond (approx. 37°) [15]. It corresponded to forces pushing the tarsus upwards between 0.5 and 3 mN. Within this range, a difference in the differential sensitivity of slits 2 and 6 can be inferred from the slopes of the curves shown in figure 10. The compression of slit 2 relative to the resting position followed the stimulus force linearly and amounted to 15.1% mN−1. Since force was related exponentially to the tarsal deflection angle, the same applies to slit compression. In the same range of forces, the compression of slit 6 showed a linear behaviour as well and measured 5.3% mN−1. Consequently, slit 2 was threefold more mechanically sensitive than slit 6. With stimulus forces in the biologically relevant range, slit compressions were as big as 1.31 µm (slit 2) and 0.49 µm (slit 6).
4. Discussion
4.1. Limitations of white light interferometry applied to functional morphology
As mentioned in §2.5, there are several sources of possible errors in measurements of sub-micrometre precision on living animals. In the present study, only data from experiments clearly under full control were further evaluated. The dispersion of the data shown in figures 6, 7, 9 and 10 is due to (i) the curvature of the slit edges, which causes interferences not detectable by the white light interferometer and (ii) the limited optical resolution of the instrument in the x- and y-directions (0.11 µm).
The widths of the slits of lyriform organs HS-8 and HS-10 measured with the white light interferometer (figure 5b) compare well with those seen on scanning electron micrographs (SEMs; figure 1c) and transmission electron microscopic images [21], provided the curvature of the slit edges beyond an angle of 35° to the surface (not detectable by the white light interferometer) is taken into account.
4.2. Viscoelasticity of the leg joints
4.2.1. Tibia–metatarsus joint (organ HS-8)
According to the quick relaxation of the material after the initial loading step (figure 2), the tibia–metatarsus joint of Cupiennius is a highly viscoelastic system as already shown by Blickhan [22]. In our experiments, loading of the exoskeleton was quasi-static with the metatarsus kept in a certain deflected position for the time required for the white light interference scans. As the force curve indicates, the elastic restoring force of the joint dominates at and shortly after the loading step (peaks of the curve), while the viscosity increases with the duration of the static deflection of the metatarsus. An important source of the joint's viscoelasticity is the joint socket of the tibia. It consists of a material clearly softer than the stiff sclerotized exocuticle (C. F. Schaber 2010, unpublished data). When loaded, the stiff joint head on the metatarsus pushes into the soft joint socket on the tibia. Very likely, the joint socket material initially resists the deflection of the metatarsus and subsequently the force exerted on the metatarsus is absorbed by the tibial joint socket and the tibial and metatarsal cuticle. There is a similarity to the viscoelastic joint pad at the distal end of the metatarsus [16]. A similar mechanical high-pass filter effect seems quite possible in the tibia and relevant for organ HS-8. The force curves recorded when stimulating organ HS-10 by pushing the tarsus upwards against the joint pad of the metatarsus are indeed very similar to those received when deflecting the metatarsus in order to stimulate organ HS-8 (figure 2).
Interestingly, the force decrease after stepwise loading of the metatarsus follows a power law function similar to the decrease of the rate of action potentials recorded from single slits of organ HS-8 after a step deflection of the metatarsus [18,19,23]. This at least to a large extent explains itself as a consequence of the material properties of the tibia–metatarsus joint.
The linearity of the force increase observed with increasing deflection angle of the metatarsus (figure 3a) makes sense in case of a proprioreceptor like organ HS-8, where the range of stimulus intensities is relatively small when compared with that of many exteroreceptors.
4.2.2. Metatarsus–tarsus joint (organ HS-10)
The exponential dependence of force on the deflection of the tarsus during stimulation of organ HS-10 (figure 3b) implies sensitivity and adaptation to a wide range of stimulus amplitudes. This makes sense for an exteroreceptive vibration detector like organ HS-10, where the amplitudes of the stimuli transmitted from the substrate to the sensor, such as vibratory courtship signals, vary within large limits (∼8–1000 mm s−2) [24].
Interestingly, in the biologically important range (up to a tarsal deflection angle of roughly 37°) [15], the organ and its slits are compressed more than the joint pad in front of them, stressing the organ's high compliance (figure 8c). At tarsal deflection angles above 37°, the pad absorbs most of the force. At stimulus angles larger than 47° (20° above the mechanical threshold angle), it is compressed by up to 50 per cent of its initial length, protecting the metatarsal organ from being overloaded.
4.3. Comparison with electrophysiological data
4.3.1. Lyriform organ HS-8
According to previous electrophysiological studies, the slits of lyriform organ HS-8 exhibit a range fractionation of stimulus amplitude [18,19,23]. The longest slit 1 was shown to be the most sensitive, responding to displacements of the metatarsus by less than 0.01° only, whereas the physiological sensitivity of the other slits decreased with decreasing slit length.
Using a mean value of 1.35 mN deg−1 derived from the present study (figure 3a), the forces needed to reach the previously determined physiological threshold angles are 0.01 mN, 0.15 mN, 0.57 mN, 0.88 mN and 1.24 mN for slits 2, 3, 4, 5 and 6, respectively. The relative compression of the slits at threshold inferred from the regression lines of the white light interferometric measurements (figure 6) amounts to not more than roughly 1 per cent of the width of the unloaded slit in the less-sensitive slits and to less than about 0.1 per cent in the most sensitive slits (0.06%, 0.37%, 0.79%, 1.02% and 0.83% for slits 2, 3, 4, 5 and 6, respectively). At the site of the coupling cylinder with the dendritic end of the sensory cell, it is as small as 1.4 nm (1.4 nm, 9.8 nm, 24.3 nm, 33.3 nm and 26.4 nm for slits 2, 3, 4, 5 and 6, respectively).
Whereas according to our biomechanical analysis, absolute slit compression at the site of the dendrite attachment at threshold varies 24-fold between slits 2 and 6, the difference in physiologically determined thresholds was 92-fold [18]. Our interferometric data imply that the source of the differing sensitivity cannot be found at the mechanical deformation of the slit alone.
It should also be mentioned here that each slit is innervated by two sensory cells, one ending at the outer and the other at the inner slit membrane. Slit compression and deformation of the outer slit membrane as measured in the present study directly relate to the stimulation of the first of the two sensory cells [11]. However, the processes of stimulus transmission to the dendrite of the cell ending at the slit's inner membrane are still not understood despite efforts to reveal them [15,25,26].
4.3.2. Lyriform organ HS-10
Whereas the slits of organ HS-10 are not more than approximately 7 µm deep, the trench separating the stiff cuticular cylinder of the metatarsus from the soft joint pad is 100 µm deep. Clearly, the lyriform organ is located at a place where compliance is high.
According to electrophysiological studies, the individual slits of organ HS-10 behave like high-pass filters for vibration frequencies above approximately 30 Hz [12,15]. The main source for this selectivity is the joint pad's viscoelasticity [16,17]. At contact between tarsus and metatarsus (mechanical threshold), a sinusoidal deflection of the tarsus by approximately 1–10° suffices at frequencies from 5 to 100 Hz to elicit action potentials [15]. This range corresponds to a force change on the tarsus in the range from only 195 µN to about 4.5 mN (calculated using the mean values of the fitted exponential functions). At higher frequencies, the physiological threshold angle decreases by three to four orders of magnitude down to 0.005° and to a tarsal movement by 4.5 nm at 1000 Hz [12,15] corresponding to a load change of 0.9 µN only.
It has to be noted that these values are useful for a rough estimation of the range of forces stimulating organ HS-10 only, for they were derived from quasi-statical force measurements (figure 2). At dynamical stimulation, particularly at high frequencies, larger forces are expected, mainly due to the increased Young's modulus of the metatarsal pad [16].
4.4. Comparison with finite-elements modelling
FE models of various patterns of slit arrangements showed that slit length, the positioning of the slits within the array and the direction of load strongly affect the compression of the individual slits and consequently their response to various stimulus parameters [4,5,27]. The present white light interferometric data are in reasonably good agreement with the values from the FE model. At a metatarsal deflection angle of 0.75°, at which the slit width in the FE model was evaluated, the compression measured by white light interferometry was 107 nm for slit 1 (FE 206 nm), 102 nm for slit 2 (FE 145 nm), 66 nm for slit 3 (FE 67 nm), 43 nm for slit 4 (FE 48 nm), 38 nm for slit 5 (FE 20 nm), 21 nm for slit 6 (FE 9 nm) and 13 nm for slit 7 (no FE data). The deviations of the model from the interferometric data potentially arise from treating organ HS-8 as being planar in the FE model and from small deviations from the original morphology.
Substantially, both methods show the same trend of gradual compression of the slits and underline the mechanical range fractionation within the organ. Whereas the longest slit is the most sensitive one, the sensitivity of slits 2–7 decreases according to their decreasing length, as it was also found in the earlier electrophysiological studies [18]. Both the FE analysis and the present interferometric study clearly demonstrate on a quantitative level that the spider lyriform organs are among the most sensitive mechanoreceptors known. Much of this sensitivity rests on the locally increased compliance of the exoskeleton (whose mechanical properties are close to those of bone) at the site of the slits.
Acknowledgements
We thank Eduard Arzt for his kind hospitality at the Max Planck Institute of Metals Research in Stuttgart, Germany, Jan Schuppert for help with the scanning electron microscope and Jorge Molina for many valuable discussions. The present work was supported by a travel grant of the University of Vienna to C.F.S. and project P16348 of the Austrian Science Foundation (FWF) to F.G.B.
References
- 1.Barth F. G., Libera W. 1970. Ein Atlas der Spaltsinnesorgane von Cupiennius salei Keys. Chelicerata (Araneae). Z. Morph. Tiere 68, 343–368 10.1007/BF00376006 (doi:10.1007/BF00376006) [DOI] [Google Scholar]
- 2.Barth F. G. 1971. Der sensorische Apparat der Spaltsinnesorgane (Cupiennius salei Keys., Araneae). Z. Zellforsch. 112, 212–246 10.1007/BF00331842 (doi:10.1007/BF00331842) [DOI] [PubMed] [Google Scholar]
- 3.Barth F. G. 1972. Die Physiologie der Spaltsinnesorgane II. Funktionelle Morphologie eines Mechanorezeptors. J. Comp. Physiol. 81, 159–186 10.1007/BF00696631 (doi:10.1007/BF00696631) [DOI] [Google Scholar]
- 4.Hößl B., Böhm H. J., Rammerstorfer F. G., Barth F. G. 2007. Finite element modeling of arachnid slit sensilla. I. The mechanical significance of different slit arrays. J. Comp. Physiol. A 193, 445–459 10.1007/s00359-006-0201-y (doi:10.1007/s00359-006-0201-y) [DOI] [PubMed] [Google Scholar]
- 5.Hößl B., Böhm H. J., Schaber C. F., Rammerstorfer F. G., Barth F. G. 2009. Finite element modeling of arachnid slit sensilla. II. Actual lyriform organs and the face deformations of the individual slits. J. Comp. Physiol. A 195, 881–894 10.1007/s00359-009-0467-y (doi:10.1007/s00359-009-0467-y) [DOI] [PubMed] [Google Scholar]
- 6.Barth F. G., Seyfarth A. 1971. Slit sense organs and kinesthetic orientation. Z. vergl. Physiol. 74, 326–328 10.1007/BF00297732 (doi:10.1007/BF00297732) [DOI] [Google Scholar]
- 7.Seyfarth E.-A., Barth F. G. 1972. Compound slit sense organs on the spider leg: mechanoreceptors involved in kinesthetic orientation. J. Comp. Physiol. 78, 176–191 10.1007/BF00693611 (doi:10.1007/BF00693611) [DOI] [Google Scholar]
- 8.Seyfarth A. 1978. Lyriform slit sense organs and muscle reflexes in the spider leg. J. Comp. Physiol. A 125, 45–57 10.1007/BF00656830 (doi:10.1007/BF00656830) [DOI] [Google Scholar]
- 9.Seyfarth E.-A., Pflüger H. J. 1984. Proprioceptor distribution and control of a muscle reflex in the tibia of spider legs. J. Neurobiol. 15, 365–374 10.1002/neu.480150506 (doi:10.1002/neu.480150506) [DOI] [PubMed] [Google Scholar]
- 10.Blickhan R., Barth F. G. 1985. Strains in the exoskeleton of spiders. J. Comp. Physiol. A 157, 115–147 10.1007/BF00611101 (doi:10.1007/BF00611101) [DOI] [PMC free article] [PubMed] [Google Scholar]
- 11.Barth F. G. 2002. A spider's world: senses and behavior. Berlin/Heidelberg, Germany; New York, NY: Springer [Google Scholar]
- 12.Barth F. G., Geethabali 1982. Spider vibration receptors: threshold curves of individual slits in the metatarsal lyriform organ. J. Comp. Physiol. A 148, 175–185 10.1007/BF00619124 (doi:10.1007/BF00619124) [DOI] [Google Scholar]
- 13.Hergenröder R., Barth F. G. 1983. The release of attack and escape behavior by vibratory stimuli in a wandering spider (Cupiennius salei Keys.). J. Comp. Physiol. A 152, 347–358 10.1007/BF00606240 (doi:10.1007/BF00606240) [DOI] [Google Scholar]
- 14.Gingl E., Burger A.-M., Barth F. G. 2006. Intracellular recording from a spider vibration receptor. J. Comp. Physiol. A 192, 551–558 10.1007/s00359-005-0092-3 (doi:10.1007/s00359-005-0092-3) [DOI] [PubMed] [Google Scholar]
- 15.Molina J., Schaber C. F., Barth F. G. 2009. In search of differences between the two types of sensory cells innervating spider slit sensilla (Cupiennius salei Keys.). J. Comp. Physiol. A 195, 1031–1041 10.1007/s00359-009-0477-9 (doi:10.1007/s00359-009-0477-9) [DOI] [PubMed] [Google Scholar]
- 16.McConney M. E., Schaber C. F., Julian M. D., Barth F. G., Tsukruk V. V. 2007. Viscoelastic nanoscale properties of cuticle contribute to the high-pass properties of spider vibration receptor (Cupiennius salei Keys.). J. R. Soc. Interface 4, 1135–1143 10.1098/rsif.2007.1000 (doi:10.1098/rsif.2007.1000) [DOI] [PMC free article] [PubMed] [Google Scholar]
- 17.Fratzl P., Barth F. G. 2009. Biomaterial systems for mechanosensing and actuation. Nature 462, 442–448 10.1038/nature08603 (doi:10.1038/nature08603) [DOI] [PubMed] [Google Scholar]
- 18.Barth F. G., Bohnenberger J. 1978. Lyriform slit sense organ: thresholds and stimulus amplitude ranges in a multi-unit mechanoreceptor. J. Comp. Physiol. A 125, 37–43 10.1007/BF00656829 (doi:10.1007/BF00656829) [DOI] [Google Scholar]
- 19.Bohnenberger J. 1981. Matched transfer characteristics of single units in a compound slit sense organ. J. Comp. Physiol. A 142, 391–402 10.1007/BF00605451 (doi:10.1007/BF00605451) [DOI] [Google Scholar]
- 20.Barth F. G., Pickelmann P. 1975. Lyriform slit sense organs: modelling an arthropod mechanoreceptor. J. Comp. Physiol. A 103, 39–54 10.1007/BF01380043 (doi:10.1007/BF01380043) [DOI] [Google Scholar]
- 21.Müllan R. 2005. Feinbau und Rekonstruktion der Cuticulastrukturen lyraförmiger Sinnesorgane der Spinne Cupiennius salei. Diploma thesis, University of Vienna, Vienna, Austria [Google Scholar]
- 22.Blickhan R. 1986. Stiffness of an arthropod leg joint. J. Biomech. 19, 375–384 10.1016/0021-9290(86)90014-X (doi:10.1016/0021-9290(86)90014-X) [DOI] [PubMed] [Google Scholar]
- 23.Bohnenberger J. 1978. The transfer characteristics of a lyriform slit sense organ. Symp. Zool. Soc. Lond. 42, 449–455 [Google Scholar]
- 24.Barth F. G. 1997. Vibratory communication in spiders: adaptation and compromise at many levels. In Orientation and communication in arthropods (ed. Lehrer M.), pp. 247–272 Basel, Switzerland: Birkhäuser [Google Scholar]
- 25.Höger U., Seyfarth E.-A. 2001. Structural correlates of mechanosensory transduction and adaptation in identified neurons of spider slit sensilla. J. Comp. Physiol. A 187, 727–736 10.1007/s00359-001-0244-z (doi:10.1007/s00359-001-0244-z) [DOI] [PubMed] [Google Scholar]
- 26.Seyfarth E.-A., French A. S. 1994. Intracellular characterization of identified sensory cells in a new spider mechanoreceptor preparation. J. Neurophysiol. 71, 1422–1427 [DOI] [PubMed] [Google Scholar]
- 27.Barth F. G., Ficker E., Federle H.-U. 1984. Model studies on the mechanical significance of grouping in compound spider slit sensilla. Zoomorphol. 104, 204–215 10.1007/BF00312032 (doi:10.1007/BF00312032) [DOI] [Google Scholar]


