Abstract
Self-assembled monolayers (SAMs) bearing pendant carbohydrate functionality are frequently employed to tailor glycan-specific bioactivity onto gold substrates. The resulting glycoSAMs are valuable for interrogating glycan-mediated biological interactions via surface analytical techniques, microarrays, and label-free biosensors. GlycoSAM composition can be readily modified during assembly using mixed solutions containing thiolated species, including carbohydrates, oligo(ethylene glycol) (OEG) and other inert moieties. This intrinsic tunability of the self-assembled system is frequently used to optimize bioavailability and anti-biofouling properties of the resulting SAM. However, until now, our nanoscale understanding of the behavior of these mixed glycoSAMs has lacked detail. In this study, we examined the time-dependent clustering of mixed sugar+OEG glycoSAMs on ultraflat gold substrates. Composition and surface morphologic changes in the monolayers were analyzed by X-ray photoelectron spectroscopy (XPS) and atomic force microscopy (AFM), respectively. We provide evidence that the observed clustering is consistent with a phase separation process in which surface-bound glycans self-associate to form dense glycoclusters within the monolayer. These observations have significant implications for the construction of mixed glycoSAMs for use in biosensing and glycomics applications.
Keywords: Atomic force microscopy, carbohydrates, glycoSAM, phase separation, XPS
Introduction
Glycans are ubiquitous in biological systems, found throughout cells as poly- and oligosaccharides, glycoproteins, glycolipids, glycosaminoglycans and other glycoconjugates.1 More than half of all eukaryotic proteins bear a carbohydrate as the result of post-translational modification.2 These glycans play vital roles in a myriad of biological processes, including cell trafficking,3 cell-cell signaling,4 the immune response,5 and host-pathogen interactions.6 For example, glycans in the cell membrane facilitate pathogenic invasion and release of influenza virus7 and HIV,8 as well as tumor progression.9 The biomedical significance of glycomics, the comprehensive study of the roles played by glycans in biology, has inspired a variety of carbohydrate-based tools, including microarrays and biosensors. These carbohydrate-modified sensing platforms are currently being used to interrogate interactions between glycans and their binding partners,10 to identify host-associated carbohydrate receptors bound by pathogens,7,11 to screen carbohydrate-based vaccines,12 and to develop synthetic inhibitors of carbohydrate-mediated host-pathogen interactions.13 However, the performance of carbohydrate-modified arrays and biosensors is highly dependent on the surface chemistries of the platform, specifically as they relate to glycan surface density and molecular stability and presentation. These parameters ultimately determine the bioavailability and bioactivity of glycan-modified surfaces, placing a significant burden on proper fabrication and characterization of these glycosylated surfaces.14 Oligo(ethylene glycol) (OEG) moieties are commonly used to improve the bioavailability and bioactivity of surface-bound biomolecules and to reduce the nonspecific adsorption of proteins.15 For instance, we recently demonstrated that mixed sugar+OEG glycoSAMs show increased binding towards carbohydrate-binding proteins when compared to pure glycoSAMs.16 The mixed glycoSAM strategy also provides a facile method for modulating surface glycan density via dilution in the monolayer with an inert species. Tunable glycan surface density has substantial implications towards biosensor and array design, as numerous studies have implicated a significant role for glycan density in carbohydrate binding interactions17 and carbohydrate array performance.18
However, the tendency of mixed SAMs to phase separate at the nanoscale represents a potential challenge towards molecular engineering of controlled glycan densities in mixed glycoSAM-based sensors and arrays. In binary alkanethiol SAMs, separation occurs during self-assembly and is driven thermodynamically by alkane chain van der Waals interactions that vary in strength based on chain length.19 In mixed SAMs of amide-containing alkanethiols and n-alkanethiols of similar overall length, spontaneous phase separation has also been observed and is driven presumably by hydrogen bonding between amide groups.20 Even very weakly interacting self-assembled molecules – with similar size, terminal functional groups, and intermolecular interactions – can phase separate into nanoscale domains within the mixed SAM system under ambient conditions.21
It is likely that glycoSAMs will behave similarly to other mixed SAMs in this respect. Carbohydrates are known to participate in intermolecular interactions and self-association via carbohydrate-carbohydrate binding.22 For instance, glycoconjugate clusters were observed in lipid rafts, their formation driven by interactions between carbohydrate headgroups.23 Additionally, submicron-sized domains of GM1 (monosialotetrahexosylganglioside) have been observed in phospholipid monolayers.24 This self-associative property of carbohydrates has significant implications in carbohydrate-modified biosensor and array design, as clustering within the mixed SAMs could affect glycan bioactivity. While the influence of density and molecular presentation on glycoSAM bioactivity is widely accepted,25 phase separation in these glycosylated mixed SAMs has not been studied in detail.
In this study, we examined the phase separation behavior of a mixed glycoSAM system assembled from synthetic OEG-thiolated glycans (tri- and tetra-mannosides) and OEG thiol on ultraflat gold substrates. X-ray photoelectron spectroscopy (XPS) and atomic force microscopy (AFM) were employed to monitor changes in the elemental composition and nanoscale features of our glycoSAMs over time. Although chemically stable over prolonged storage, our glycoSAMs displayed nanoscale phase separation and clustering into two domains, with morphology dependent on the relative sugar concentration during assembly. These results demonstrate that phase separation processes play a significant role in dictating molecular presentation and density in glycoSAMs and must be taken into account in glycan sensor and array design.
Materials and Methods
Reagents and Materials
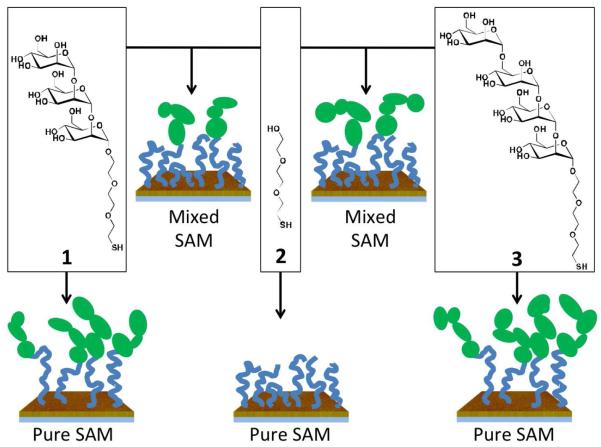
All chemical reagents were purchased from Sigma-Aldrich (St. Louis, MO) and Acros Organics (West Chester, PA) and used as received without further purification. A synthetic trisaccharide (a linear polymer of three mannose residues) bearing a terminal oligo(ethylene glycol) thiol (sugar, 1), a synthetic tetrasaccharide (a linear polymer of four mannose residues) bearing a terminal oligo(ethylene glycol) thiol (sugar, 3), and hydroxyl-terminated oligo(ethylene glycol) thiol (OEG, 2) were synthesized as previously described.26 Thiols were dissolved in ultrapure water and stored at −20 °C. Silicon wafers (Silicon Valley Microelectronics, San Jose, CA) were soaked in ultrapure water overnight, sequentially sonicated in acetone, methylene chloride, acetone, and methanol, and dried under a stream of argon. Mica was Grade V-1 Muscovite (Structure Probe, Inc, West Chester, PA).
Preparation of Au Substrates
Two different types of gold substrates were used for this study. Polycrystalline gold substrates were prepared from cleaned Si wafers using an e-beam evaporator (CHA, SEC-600 E-beam Evaporator) at the Washington Technology Center. Ti (5 nm) and Au (10 nm) were consecutively deposited at a rate of 1.0 Å/s and 5.0 Å/s, respectively. Additionally, “ultraflat” single-crystalline gold substrates were prepared from freshly cleaved mica using a thermal evaporator (BOC Edwards AUTO306 Vacuum Coater). Before deposition, the mica was preheated to 325 °C for 2 h to enhance the formation of large Au(111) terraces. The deposition rate was 1.5-2.0 Å/s for the first 30 nm, followed by 0.2 Å/s until the thickness reached approximately 110 nm. This method produced atomically flat Au(111) terraces 300 to 400 nm across.
SAM Formation on Au Substrates
Pure SAMs of sugar (1), OEG (2), and sugar (3), as well as mixed SAMs of sugar(1)+OEG and sugar(3)+OEG, were prepared by immersing fresh Au substrates in aqueous thiol solution for 23-25 h in the dark and at room temperature (Scheme 1). The total thiol concentration in the incubation solution was 0.1 mM. After incubation, samples were washed with pure ethanol and dried under a stream of nitrogen. All samples were stored under argon, in the dark, at room temperature. Samples analyzed immediately following the self-assembly period are denoted ‘Day 0’, samples analyzed 24 h following self-assembly are denoted ‘Day 1’, and so on.
Scheme 1.
Assembly of pure and mixed SAMs of sugar (1 & 3) and OEG (2) thiols on gold.
Atomic Force Microscopy (AFM)
AFM images were taken using a SPM Dimension 3100 (Veeco) in an air-tapping mode at room temperature. The images were acquired using a soft-tapping silicon tip (FESP, 2.8 N/m, radius 8 nm (≤ 12 nm), Veeco), with 512 × 512 data acquisition at 1.0-1.5 Hz scan rate. The z-limit was set at 1 μm. The instrument noise floor was 60-75 pm (root mean square roughness of 1 nm×1 nm scan at 2.94 Hz). At least three different locations on each sample were scanned. Within a single gold grain on mica, a 300 nm×300 nm ultraflat terrace region was imaged and used for data analysis.
X-ray Photoelectron Spectroscopy (XPS)
XPS measurements were performed on a Surface Sciences Instrument S-probe spectrometer equipped with a monochromated aluminum Kα X-ray source and a hemispherical electron energy analyzer. Compositional survey and detailed scans (N 1s, O 1s, and S 2p) were acquired using a pass energy of 150 eV. High-resolution spectra (C 1s and S 2p) were acquired using a pass energy of 50 eV. For the high-resolution spectra, peak binding energies were referenced to the C 1s (C-O) peak at 286.3 eV. The S 2p spectra acquired for these SAMs have a doublet structure due to the presence of the S 2p3/2 and S 2p1/2 peaks. S 2p doublets have 1.2 eV splitting and a 2:1 peak ratio. The two sulfur doublets are assigned to bound thiol (162.0 and 163.2 eV) and unbound thiol species (163.5 and 164.7 eV).27 Given this information, curve fitting of the XPS data indicates the relative levels of bound and unbound thiol. Three spots over two replicates of each sample were analyzed. The compositional data represent the averaged values from these spots. Data analysis was performed on the ESCA 2000 data reduction software.
Image Processing and Analysis
AFM images were zero-order flattened and first-order X or XY plane fitted using Nanoscope software (Veeco). To obtain the apparent percent areal coverage of each component of our binary system (i.e., “short” and “tall” domains) AFM images were imported into ImageJ (NIH, Bethesda, MD) and binarized using the Auto Local Threshold plugin (v1.2, Gabriel Landini) implementing a Bernsen thresholding algorithm,28 as used elsewhere.29 The local threshold radius was selected such that it was larger than the largest features of the images. ImageJ’s “Measure” operation with the “Area Fraction” parameter selected was used to calculate the fractional coverage of each domain in the binarized images. The percent coverage values were insensitive to changes to the thresholding algorithm.
Line profile cross sections of AFM images were obtained by drawing straight-line selections and using the “section” function in the Nanoscope software (Veeco). To estimate the height difference between the short and tall domains the tapping depths in 300 nm×300 nm regions (512×512 depth values) were plotted as a histogram. Careful analysis of the AFM images indicated that the height histogram for mixed samples could be described by the sum of three Gaussian curves with high goodness of fit (see Figure S1). Accordingly, the height histograms were imported into MATLAB and fit to three Gaussian curves (of form ) using global nonlinear optimization with a wide range of initial guesses. Height histograms with best-fit curves are given in supporting Figures S2 and S3. The distance between the peaks of the short domain and tall domain Gaussian curves was extracted from the best fit and used as an estimate for the “true” average short to tall domain height difference (hereafter, inter-domain height differential,). This method permitted reproducible and automated estimation of the inter-domain height differential across numerous samples. After plotting versus time for ‘low’ and ‘high’ sugar samples, trendlines were added to emphasize the dynamic differences between the sample sets. Trendlines were constrained to pass through the origin using the constrained nonlinear optimization fmincon in MATLAB and a curve of form Δ(t) = a − b · e−t/c.
Results and Discussion
Initial observations of nanoscale clustering in mixed glycoSAMs
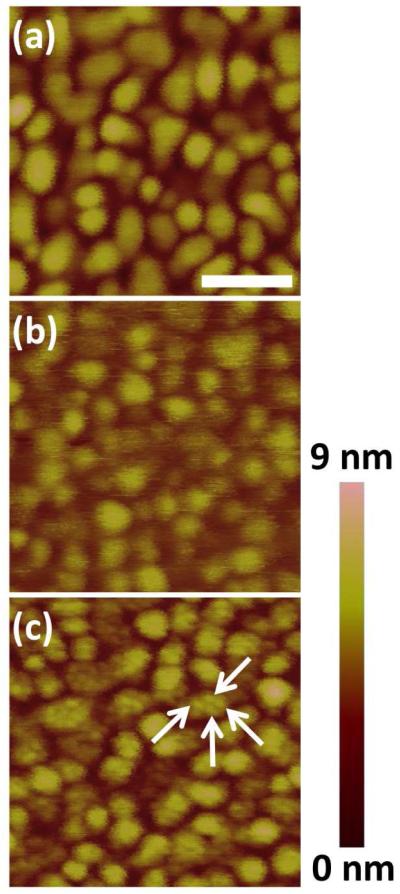
Electron-beam evaporated polycrystalline gold substrates are widely used for molecular self-assembly, and are ubiquitous in surface plasmon resonance biosensing. Our preliminary studies focused on glycoSAMs prepared on said polycrystalline gold substrates16 and are strongly suggestive of nanoscale clustering within sugar+OEG assemblies. Figure 1 shows the AFM images of bare gold, pure sugar (1) SAM, and mixed (1:1 molar ratio sugar (1) to OEG (2)) glycoSAM surfaces. Gold grains of ~30 nm diameter are apparent in all samples. While grains in both the bare gold (Figure 1a), the pure sugar SAM surface (Figure 1b), and pure OEG SAM surfaces (not shown) appear smooth, the mixed glycoSAM surfaces showed clusters between 0.5-1.0 nm in height on top of individual Au grains (arrows, Figure 1c). The height difference between the clusters and background roughly equaled the theoretical height difference between sugar and OEG. We reasoned that the clusters on the mixed glycoSAMs might be sugar-thiols that had segregated from surrounding OEG molecules into nanoscale clusters. Previous work demonstrating phase separation within nanoscale gold clusters resembling our polycrystalline substrate lends plausibility to this segregation hypothesis.30
Figure 1.
AFM of electron-beam evaporated gold. (a) Bare gold, (b) assembled monolayer of pure sugar (1), and (c) mixed SAM composed of 1:1 molar ratio of sugar (1) to OEG (2). Features consistent with nanoscale clusters are apparent within the gold grains in the mixed SAM system (arrows), but not in the bare gold or pure SAM. Scale bar is 100 nm and applies to all images.
Since the polycrystalline samples were stored in the dark for several days before topographic analysis, we questioned whether time was a factor in cluster formation. To our knowledge, storage time has not been examined as a factor in thiol phase separation. Additionally, a well-recognized factor in the phase separation of thiols is the molar ratio of adsorbates during incubation,31 and our preliminary results prompted us to explore what role this variable may play in our system. Finally, substrate characteristics like crystallinity and roughness are known to influence thiol assembly32 and surface mobility.33 Polycrystalline gold, however, has variable surface roughness and crystallinity, and is difficult to image at high-resolution using AFM (as evidenced by the faintness of the clusters in Figure 1c). Thus, to control surface roughness and obtain high-resolution images, mica substrates coated with single-crystalline “ultraflat” gold were used in this study of the clustering phenomenon of glycoSAMs.
XPS analysis: SAM quality and elemental stability
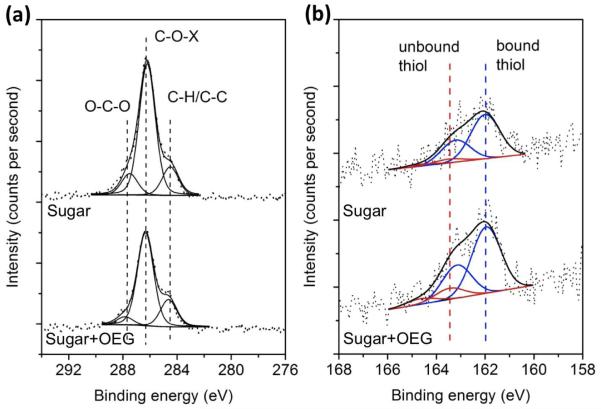
Pure OEG, pure sugar (3), and mixed sugar(3)+OEG SAMs on ultraflat Au substrates were analyzed by XPS immediately following 24 hours of self-assembly. XPS detected the expected species from the thiol monolayer (C, O, S), as well as the substrate (Au). The chemical environments of carbon and sulfur species on pure sugar and mixed sugar+OEG surfaces were obtained from XPS high-resolution spectra (Figure 2). Consistent with the previous peak assignments by our group,16 the carbon species were assigned to hydrocarbon (C-C/C-H), ether/alcohol carbon (C-O-X), and sugar acetal carbon (O-C-O) with characteristic binding energies of 284.6, 286.3, and 287.6 eV, respectively. Sulfur species at 162.0 eV for Au-bound thiol and at 163.5 eV for unbound thiol, as well as the expected doublet splitting, were observed. Only a minimal amount of unbound thiol was present, indicating the SAMs were of high quality. Oxidized sulfur species indicated by higher binding energies (>166 eV) were not detected. These results indicate that our pure and mixed glycoSAMs contain minimal adventitious hydrocarbon and have the expected thiol species bound to the surface in a monolayer.
Figure 2.
XPS high-resolution spectra for (a) C 1s and (b) S 2p for pure sugar (3) (Sugar, top) and 2:1 sugar(3):OEG(2) (Sugar+OEG, bottom) SAMs on ultraflat gold. The carbon species are assigned to hydrocarbon (C-H/C-C, 284.6 eV), ether/alcohol (C-O-X, 286.3 eV), and acetal (O-C-O, 287.6 eV). The doublets observed in (b) are assigned to bound thiol species (162.0 eV and 163.2 eV, blue) and unbound thiol species (163.5 eV and 164.7 eV, red). Oxidized sulfur species (>166 eV) were not detected.
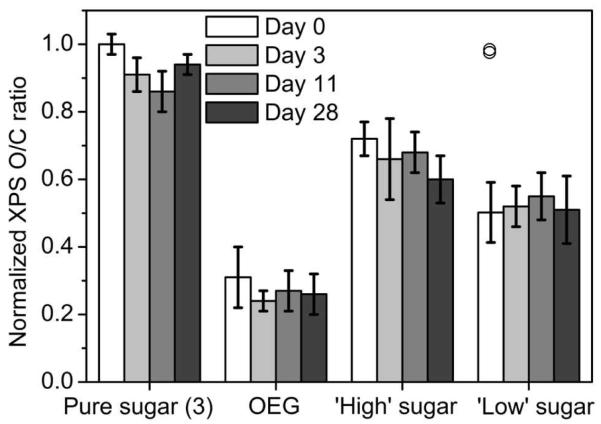
To determine the stability of our system, the surface elemental composition of a set of samples (pure sugar (3), pure OEG, 2:1 molar ratio sugar:OEG, and 1:2 molar ratio sugar:OEG) were examined by XPS. As shown in Figure 3, XPS O/C ratios remained relatively unchanged for both pure and mixed glycoSAM surfaces over 28 days of storage, indicating the surfaces are stable under the storage conditions used (i.e., under argon, in the dark, at room temperature). Two readings on a single ‘Low’ sugar Day 0 sample were uncharacteristically high and similar to one another (0.03 percent difference), consistent with adventitious contamination during sample handling. We have included the contaminated readings in Figure 3 for transparency (circles), but have separated them from the “uncontaminated” data. In addition to the stable XPS O/C ratios, sulfur levels (S 2p) also remained stable over the study period (data not shown). This supports the conclusion that both pure and mixed surfaces were elementally stable during the study period.
Figure 3.
XPS wide scan time-course analysis of oxygen to carbon (O/C) ratio indicates that the overall composition of our SAMs remains stable over 28 days. ‘High’ sugar SAM is composed of a 2:1 molar ratio of sugar (3) to OEG (2); ‘Low’ sugar SAM is composed of a 1:2 molar ratio of sugar (3) to OEG (2). The two data points for ‘Low’ sugar Day 0 that are shown as overlapping circles (‘□’) are consistent with contamination during sample handling and have been separated from the “uncontaminated” data.
It is also worth nothing that “complete” assembly in an OEG SAM system – that is, a surface at equilibrium with the incubation solution – may be “submonolayer” in the traditional sense. It is known, for example, that OEG-based thiols form loosely packed SAMs compared to the canonical alkanethiol SAM.34 We reason that with this increased disorder the film thickness would be lower than corresponding alkanethiols.
AFM analysis: Time-course study of glycoSAM surfaces
Maintaining stable and uniform SAMs is critical, particularly for studies involving long-term storage. However, it is well established that thiol-based SAM surfaces are susceptible to both elemental35 and morphological changes over time.36 We stored our samples under an inert argon environment to limit oxidation and contamination by adventitious hydrocarbon; additionally, samples were kept in the dark to prevent degradation due to UV exposure. As previously described, our XPS results establish the high quality and stability of both our pure and mixed SAMs (Figures 2 and 3). AFM tapping mode imaging provided a means of examining the morphological quality and stability of our surfaces at discrete time points over a prolonged storage period.
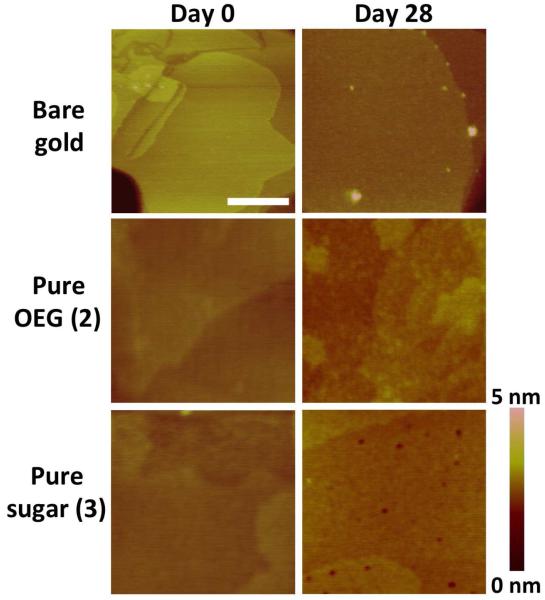
The clusters observed on the aged mixed glycoSAM surfaces on polycrystalline Au substrates led us to examine the nature of the hypothesized phase separation and its time-dependency. First, we sought to confirm the morphological stability and uniformity of bare gold and pure SAMs. Using AFM, we compared the morphology of bare ultraflat gold, pure OEG, and pure sugar (3) samples before and after a 28-day storage period (Figure 4). The overall morphology of the pure samples showed minimal change over four weeks, such as a roughening of the pure OEG samples and the formation of depressions in the pure sugar samples, consistent with aging due to slight oxidation during handling.35d
Figure 4.
AFM of ultraflat gold substrates bare, with pure OEG (2) SAM, and with pure sugar (3) SAM before and after 28 days of storage (argon, dark). These results demonstrate that the pure SAMs are morphologically stable under the storage conditions used. Scale bar = 100 nm.
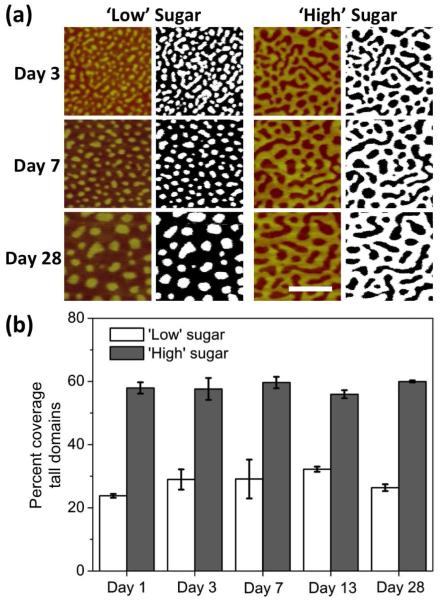
We proceeded to examine a mixed glycoSAM surface. Ultraflat gold was incubated in two mixed thiol solutions to form glycoSAMs: ‘low’ sugar (2:3 molar ratio of sugar:OEG) and ‘high’ sugar (4:1 molar ratio of sugar:OEG). Samples imaged by AFM immediately after self-assembly were relatively homogenous, with faint nodules visible in the ‘low’ sugar samples (Figure 5, Day 0). When the samples were imaged 24 hours later (Day 1), two distinct patterns emerged: a clustered island-like pattern (‘low’ sugar glycoSAM) and an interconnected continuous pattern (‘high’ sugar glycoSAM). Over time, these features coalesced to reveal two easily distinguishable domains: a “short” domain (i.e., dark areas in the AFM images) and a “tall” domain (i.e., bright areas in the AFM images). In both ‘low’ and ‘high’ sugar glycoSAMs, the tall domain features grew larger in cross-sectional diameter and remained discrete over the 28-day study period. We observed the time-dependent clustering phenomenon repeatedly across many sets of glycoSAM samples of various molar ratios of sugar to OEG (see Figure S4). Images of samples stored for greater than five months were qualitatively similar to those taken of Day 28 samples.
Figure 5.
Time-course topographic AFM analysis of mixed SAMs on ultraflat gold. ‘Low’ sugar SAMs were prepared using a 2:3 molar ratio of sugar (3) to OEG (2), while ‘high’ sugar SAMs were prepared using a 4:1 sugar:OEG molar ratio. The surface topography exhibits time-dependent clustering behavior. Scale bar = 100 nm.
We assessed the domain areal percent coverage by thresholding and binarizing AFM images. Despite the domain coarsening over the study period, the domain coverage remained stable for both the ‘low’ sugar and ‘high’ sugar mixed glycoSAM surfaces (Figure 6). The tall domain coverage was around 25 to 30 percent for the ‘low’ sugar glycoSAMs and 55 to 60 percent for the ‘high’ sugar glycoSAMs.
Figure 6.
Domain coverage analysis. AFM images of mixed SAMs having 2:3 (‘Low’ sugar) and 4:1 (‘High’ sugar) molar ratios of sugar (3) to OEG (2) were binarized. (a) Representative Day 3, 7, and 28 images before and after binarizing. The tall domain coverage is the area fraction of the white regions in the binary images. Local threshold radii: Day 3 = 8.8 nm; Day 7 = 11.7 nm; Day 28 = 20.5 nm. Scale bar = 100 nm. (b) Tall domain percent coverage over time. The error bars correspond to 95% confidence intervals based on the coverage values for multiple samples for each day.
Our XPS analysis determined that 1:2 and 2:1 sugar:OEG (33% and 66% sugar) SAMs were qualitatively similar, with stable oxygen, carbon, and sulfur signals over the entire study period. Although the molar ratio of the ‘low’ and ‘high’ sugar samples presented in Figures 5 and 6 (40% and 80% sugar) differ slightly from those used in the XPS analysis, it is reasonable to believe that their elemental composition is also stable. Conversely, the 1:2 sugar:OEG XPS data is directly comparable to the 1:2 sugar:OEG AFM data presented in Figure S4, showing that glycoclusters form without any change in surface elemental composition. The stable areal coverage of the domains and stable elemental composition of the surfaces as measured by XPS indicate that changes in overall surface composition do not explain the observed clustering phenomenon.
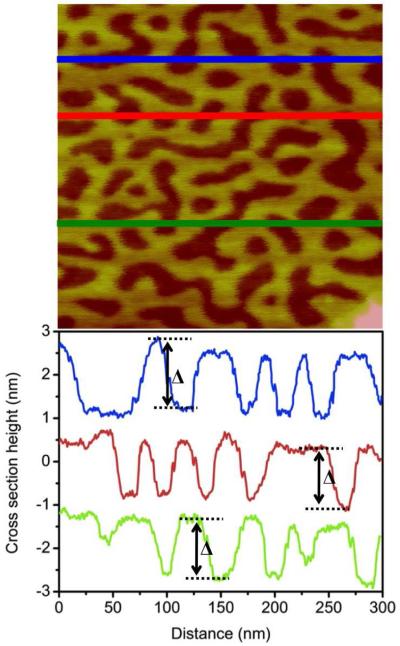
Line profiles of AFM images of phase separated samples provide an intuitive perspective into the height of the tall domain features relative to the surrounding short domain (Figure 7). The cross section of a ‘high’ sugar glycoSAM on Day 28 illustrates that the short domain to tall domain height difference (inter-domain height differential,) is about 1.0 to 1.4 nm. This height difference roughly equates to the theoretical height difference between sugar (3) and OEG (2). Factors like tip convolution and variable surface softness in response to tapping make it difficult to measure confidently the “true” height of the tall features relative to the short features. Nevertheless, this evidence – in combination with the proportionality between the molar ratio of sugar during incubation and tall domain coverage – leads us to believe that the clustered tall domain features are primarily sugar thiol and the short domain features are primarily OEG thiol.
Figure 7.
Representative AFM topographic image and corresponding line profile of a mixed SAM on ultraflat gold, 4:1 molar ratio sugar (3) to OEG (2), Day 28. The cross section analysis illustrates a nanoscale height difference between the short domain (OEG) and the tall domain (sugar). The inter-domain height differential () is consistent, ranging from 1.0 to 1.4 nm.
Assuming that the tall and short domains correspond to pure sugar and pure OEG, respectively, the domain coverage represents the apparent ratio of immobilized sugar to OEG. Under this assumption, one might expect 40% sugar (2:3 sugar to OEG) and 80% sugar (4:1 sugar to OEG) incubation solutions to result in 40% and 80% tall domain coverage, respectively. However, it is well established that the surface composition of mixed SAMs may differ significantly from the incubation solution composition depending on assembly kinetics.37 The coverage relationship was indeed below identity in our system, with OEG thiol appearing to adsorb somewhat preferentially. Nevertheless, the proportionality between sugar molar ratio during incubation and tall domain percent coverage was replicated in 33% and 75% sugar incubation solutions (data not shown). This supports our belief that the tall domains are primarily sugar thiol and the short domains are primarily OEG thiol.
The slightly preferential adsorption of OEG thiol is expected based on the principles of collision frequency and steric hindrance. During incubation, the frequency of thiol collision with the gold surface dictates the rate of adsorption, and is inversely related to the mass of the adsorbate.38 Thus, OEG thiols will contact the surface more frequently than the larger sugar thiols, leading to higher-than-expected OEG coverage. Additionally, competitive adsorption favors less sterically hindered molecules,39 further favouring adsorption of OEG thiol over the much bulkier tetrasaccharide-bearing sugar thiol.
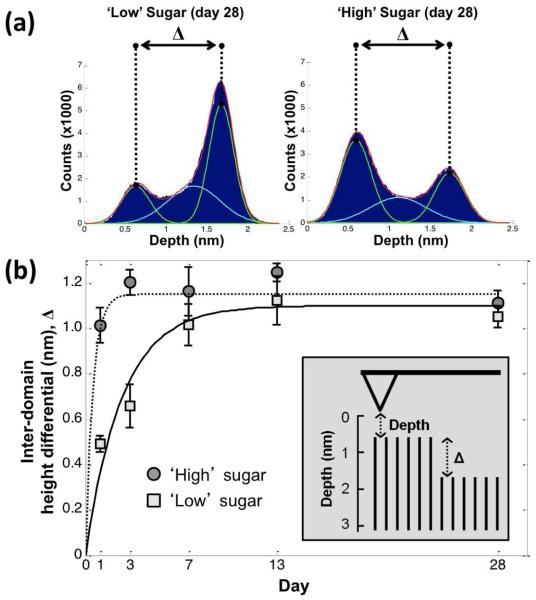
We sought to characterize more rigorously the inter-domain height differential over time. The depth values in flat, 300 nm×300 nm areas (512×512 depth values, each representing many tapping event) on mixed glycoSAMs were plotted as histograms and analyzed. In a perfect binary system, the histogram would be bimodal with little spread about the modes; in reality, tip convolution, surface defects, and mixing at the interface of domains results in a bimodal distribution with overlapping regions.40 Closer examination shows that our system is best described empirically as having three distinct domains: a short domain, a tall domain, and an inter-domain region at the transition between the short and tall domains (Figure S2). Each of these regions produce their own Gaussian-type distribution of tapping event heights, which can be fit globally to estimate the mode of each domain, as has been done by others.41 The fitting procedure allowed us to extract, reproducibly, estimates for the “true” inter-domain height differential (, Figure 8a). Figure 8b shows that increases over the course of study until reaching a plateau. Interestingly, the ‘high’ sugar glycoSAM stabilizes quickly (~Day 3) while the ‘low’ sugar glycoSAM stabilizes more slowly (~Day 7 to 13). This indicates that clustering kinetics are related to the mole fraction of immobilized sugar, and suggests that the sugar moieties are driving the phenomenon. This is consistent with the coarsening seen in the AFM images in Figure 5 in which the ‘high’ sugar glycoSAM seemed to reach a stable morphology around Day 3, while the ‘low’ sugar glycoSAM reached a stable morphology around Day 13. At Day 28, is not statistically different for the ‘low’ and ‘high’ sugar glycoSAMs (p = 0.22, two-sample t-test; Δ ≈ 1.0 to 1.2 nm). Again, this is consistent with AFM imaging data showing that samples stored for greater than five months (Figure S4) are not noticeably different from Day 28 samples, suggesting that both ‘high’ and ‘low’ sugar glycoSAMs reach an equilibrium state by Day 28.
Figure 8.
Inter-domain height differential () is (a) extracted from histogram data and (b) plotted versus time for 2:3 (‘Low’) and 4:1 (‘High’) sugar (3) to OEG (2) mixed SAMs. Error bars correspond to 95% confidence intervals for the estimate of for a set of samples on a given day. Trendlines added for visual purposes. Inset: cartoon of AFM cantilever probing monolayer of short and tall domains, with ‘depth’ and ‘Δ’ indicated.
Δ is an indication of the molecular purity of each domain. At one extreme, a perfectly homogeneous mixed SAM would have a of zero. At the other extreme, a completely phase separated system would have the largest possible corresponding to the difference in height between the thiols within the mixed SAM. An intermediate indicates phase separation with some degree of mixing within each domain (i.e., the domains are not composed purely of a single species). A computational study by Tielens et al. in a mixed SAM system containing a mixture of acid- and alcohol-terminated thiols (analogous to sugar and OEG in our system) found at least seven different equilibrium SAM conditions as a function of initial solution molar ratios.31 Although we interrogated a limited number of molar ratios, it is striking that both 40% and 80% sugar solutions phase separated and ultimately produced a similar. In other words, despite widely varying solution compositions, the glycoSAMs ultimately formed short and tall domains of similar composition. Thus, while varying solution composition does influence the overall coverage of each component, it does not appear to control surface composition and density at the nanoscale level relevant to interrogating biomolecules.
Proposed nanoscale clustering mechanism
Based on XPS and AFM analysis, we attribute the time-dependent cluster formation in mixed glycoSAMs to intermolecular attractive forces between immobilized thiolated-sugar moieties. Immediately following submersion in the thiol incubation solution, sugar and OEG thiols begin adsorbing on the gold surface. The adsorption process may not be perfectly stoichiometric, depending on a variety of factors (e.g., sterics39 and sticking probability38), but roughly follows the proportionality of the incubation thiol solution. Although initially the thiols may be randomly distributed on the ultraflat gold, at the conclusion of self-assembly from solution there is some evidence of early stage clustering (Figure 5, ‘Low’ sugar, Day 0), indicating dynamic exchange processes during SAM formation likely play a role in phase separation. However, the majority of the observed phase-separation occurs following incubation over the course of several days, despite storage under dark, inert conditions. During storage, adsorbed sugar and OEG thiols laterally diffuse,42 facilitating intermolecular interactions (i.e., sugar-sugar, sugar-OEG, and OEG-OEG).
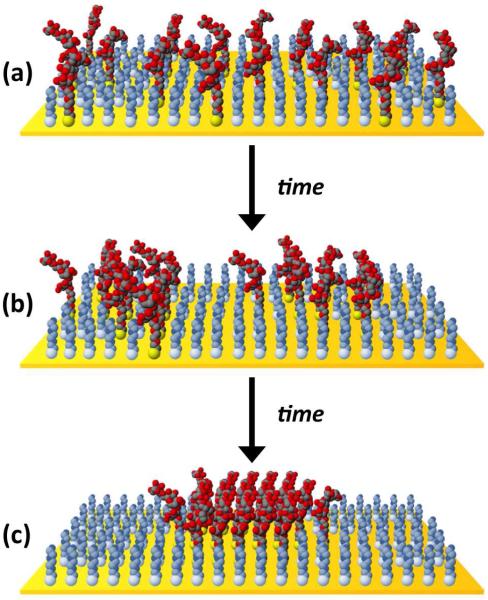
An energetics argument first put forth by Weiss’ group36c, 43 and reiterated in work by others44 simplifies binary SAM phase separation into two opposing terms: enthalpy of interaction and entropy of mixing. Spontaneous phase separation will occur only when the enthalpic contribution of self-associating adsorbates exceeds the entropy of mixing, which favors disorder. Mixed SAMs composed of thiolates capable of forming only one or two hydrogen bonds have been observed to undergo phase separation.31, 44b, 45 In our case, numerous potential intermolecular hydrogen bonds between adjacent sugar headgroups offers even greater enthalpic stabilization. We thus attribute the phase separation in our system to intermolecular hydrogen bonding between sugar headgroups (i.e., sugar-sugar). Subsequently, the phase-separated domains coalesce and coarsen, as has been directly observed by others.36c,43c Although we did not image the samples frequently enough to directly observe coalescence or measure the phase mobility, we are planning future work that will rigorously quantify these important aspects of the clustering phenomenon. Eventually, the system appears to reach a thermodynamic equilibrium, as evidenced by the stabilization of the surface morphology and inter-domain height differential after four weeks. The proposed phase separation process is illustrated schematically in Figure 9.
Figure 9.
Proposed time-dependent clustering in mixed SAMs of sugar (red/black) and OEG (light blue/gray) thiols (sugar:OEG ratio in the illustration is roughly 1:3). (a) Immediately following chemisorption, sugar and OEG molecules are randomly distributed across the gold surface. (b) Over time, lateral diffusion of the bound thiols leads to sugar-sugar hydrogen bonding interactions that result in the formation of small, packed domains of sugar-thiols. (c) Small nanoclusters continually coalesce into larger clusters, becoming increasingly pure and well packed until reaching an equilibrium state.
Conclusions
We found that mixed SAMs of sugar and OEG thiols form nanoscale, segregated domains over time that are not present in pure sugar or OEG SAMs. The surface morphology differed depending on the molar ratio of sugar to OEG during self-assembly, with island-like or continuous clustering occurring in ‘low’ and ‘high’ sugar composition incubation solutions, respectively. Domain formation and coarsening occurred steadily over the course of four weeks, as indicated by AFM images showing increasingly coalesced domains. Using XPS, we determined that the oxygen to carbon ratio of our surfaces remained unchanged over time, indicating stable surface composition. Likewise, the overall coverage of domains was stable and correlated with the molar ratio of sugar to OEG during assembly, supporting the conclusion that the tall and short domains are primarily sugar and OEG thiols, respectively. Additionally, the differential height between the two domains increased steadily until reaching a plateau around ~1.1 nm, roughly the theoretical height difference between pure sugar and pure OEG thiol SAMs. This suggests that, in addition to coalescing, the domains become increasingly pure and ordered over time. Given the decrease in entropy due to domain formation, we reason that an offsetting enthalpic force drives the spontaneous phenomenon, most likely intermolecular hydrogen bonding between sugar headgroups. Clustering of sugar ligands on biosensing surfaces has been shown to have important multivalent binding effects.46 The time-dependent clustering phenomena observed in our glycoSAM system poses additional complications for interpreting binding studies, especially among multivalent, density-dependent interactions. These results suggest that ligand-clustering effects should be considered when interrogating glycoSAM bioactivity.
Supplementary Material
ACKNOWLEDGMENT
(Word Style “TD_Acknowledgments”). This work was supported by the University of Washington Royalty Research Fund, the Department of Bioengineering, the Washington Research Foundation, NESAC/BIO (NIH Grant P41 EB002027), UWEB National Science Foundation REU Program (EEC-0647918), the Washington Technology Center, and the Mary Gates Endowment. We would like to thank Dr. Shaoyi Jiang, Christopher So, and Dr. Yi He for assistance in preparing mica gold substrates; Dr. Qiuming Yu and Dr. Paul Wallace for valuable AFM training; Gerry Hammer for running XPS experiments; Dr. Susie Pun’s lab for spectrophotometer access; and the University of Washington Nanotechnology User Faculty (NSF, NNIN 0335765) for AFM instrument use.
Footnotes
Supporting Information Available.
Characterization of domain regions and justification of triple-Gaussian fit. Height histogram fits for ‘low’ sugar glycoSAM. Height histogram fits for ‘high’ sugar glycoSAM. AFM images of 1:2 and 3:1 sugar:OEG samples stored over five months. This material is available free of charge via the Internet at http://pubs.acs.org/.
References
- 1.Varki A. Essentials of glycobiology. Cold Spring Harbor Laboratory Pr; 1999. [PubMed] [Google Scholar]
- 2.Feizi T, Chai W. Oligosaccharide microarrays to decipher the glyco code. Nat Rev Mol Cell Biol. 2004;5(7):582–588. doi: 10.1038/nrm1428. [DOI] [PubMed] [Google Scholar]
- 3.Van Kooyk Y, Geijtenbeek TBH. A novel adhesion pathway that regulates dendritic cell trafficking and T cell interactions. Immunological reviews. 2002;186(1):47–56. doi: 10.1034/j.1600-065x.2002.18605.x. [DOI] [PubMed] [Google Scholar]
- 4.Zhao YY, Takahashi M, Gu JG, Miyoshi E, Matsumoto A, Kitazume S, Taniguchi N. Functional roles of N - glycans in cell signaling and cell adhesion in cancer. Cancer science. 2008;99(7):1304–1310. doi: 10.1111/j.1349-7006.2008.00839.x. [DOI] [PMC free article] [PubMed] [Google Scholar]
- 5.Cobb BA, Kasper DL. Coming of age: carbohydrates and immunity. European journal of immunology. 2005;35(2):352–356. doi: 10.1002/eji.200425889. [DOI] [PubMed] [Google Scholar]
- 6.(a) Varki A. Biological roles of oligosaccharides: all of the theories are correct. Glycobiology. 1993;3(2):97–130. doi: 10.1093/glycob/3.2.97. [DOI] [PMC free article] [PubMed] [Google Scholar]; (b) Varki A. Glycan-based interactions involving vertebrate sialic-acid-recognizing proteins. Nature. 2007;446(7139):1023–1029. doi: 10.1038/nature05816. [DOI] [PubMed] [Google Scholar]; (c) Gabius H-J, Siebert H-C, André S, Jiménez-Barbero J, Rüdiger H. Chemical Biology of the Sugar Code. ChemBioChem. 2004;5(6):740–764. doi: 10.1002/cbic.200300753. [DOI] [PubMed] [Google Scholar]; (d) Dwek RA. Glycobiology:□ Toward Understanding the Function of Sugars. Chemical Reviews. 1996;96(2):683–720. doi: 10.1021/cr940283b. [DOI] [PubMed] [Google Scholar]; (e) Hakomori S. Carbohydrate-to-carbohydrate interaction, through glycosynapse, as a basis of cell recognition and membrane organization. Glycoconjugate Journal. 2004;21(3):125–137. doi: 10.1023/B:GLYC.0000044844.95878.cf. [DOI] [PubMed] [Google Scholar]
- 7.Stevens J, Blixt O, Paulson JC, Wilson IA. Glycan microarray technologies: tools to survey host specificity of influenza viruses. Nat Rev Micro. 2006;4(11):857–864. doi: 10.1038/nrmicro1530. [DOI] [PMC free article] [PubMed] [Google Scholar]
- 8.Smith AE, Helenius A. How Viruses Enter Animal Cells. Science. 2004;304(5668):237–242. doi: 10.1126/science.1094823. [DOI] [PubMed] [Google Scholar]
- 9.Fuster MM, Esko JD. The sweet and sour of cancer: glycans as novel therapeutic targets. Nat Rev Cancer. 2005;5(7):526–542. doi: 10.1038/nrc1649. [DOI] [PubMed] [Google Scholar]
- 10.(a) Liang P-H, Wang S-K, Wong C-H. Quantitative Analysis of Carbohydrate-Protein Interactions Using Glycan Microarrays:□ Determination of Surface and Solution Dissociation Constants. Journal of the American Chemical Society. 2007;129(36):11177–11184. doi: 10.1021/ja072931h. [DOI] [PubMed] [Google Scholar]; (b) Smith EA, Thomas WD, Kiessling LL, Corn RM. Surface Plasmon Resonance Imaging Studies of Protein-Carbohydrate Interactions. Journal of the American Chemical Society. 2003;125(20):6140–6148. doi: 10.1021/ja034165u. [DOI] [PubMed] [Google Scholar]
- 11.Barth KA, Coullerez G, Nilsson LM, Castelli R, Seeberger PH, Vogel V, Textor M. An Engineered Mannoside Presenting Platform: Escherichia coli Adhesion under Static and Dynamic Conditions. Advanced Functional Materials. 2008;18(9):1459–1469. [Google Scholar]
- 12.Oberli MA, Tamborrini M, Tsai Y-H, Werz DB, Horlacher T, Adibekian A, Gauss D, Moller HM, Pluschke G, Seeberger PH. Molecular Analysis of Carbohydrate-Antibody Interactions: Case Study Using a Bacillus anthracis Tetrasaccharide. Journal of the American Chemical Society. 2010;132(30):10239–10241. doi: 10.1021/ja104027w. [DOI] [PubMed] [Google Scholar]
- 13.Kensinger RD, Yowler BC, Benesi AJ, Schengrund C-L. Synthesis of Novel, Multivalent Glycodendrimers as Ligands for HIV-1 gp120. Bioconjugate Chemistry. 2004;15(2):349–358. doi: 10.1021/bc034156a. [DOI] [PubMed] [Google Scholar]
- 14.(a) Oyelaran O, Gildersleeve JC. Glycan arrays: recent advances and future challenges. Current Opinion in Chemical Biology. 2009;13(4):406–413. doi: 10.1016/j.cbpa.2009.06.021. [DOI] [PMC free article] [PubMed] [Google Scholar]; (b) Nyquist RM, Eberhardt AS, Silks LA, Li Z, Yang X, Swanson BI. Characterization of self-assembled monolayers for biosensor applications. Langmuir. 2000;16(4):1793–1800. [Google Scholar]
- 15.(a) Nelson KE, Gamble L, Jung LS, Boeckl MS, Naeemi E, Golledge SL, Sasaki T, Castner DG, Campbell CT, Stayton PS. Surface Characterization of Mixed Self-Assembled Monolayers Designed for Streptavidin Immobilization. Langmuir. 2001;17(9):2807–2816. [Google Scholar]; (b) Cheng F, Gamble LJ, Castner DG. XPS, TOF-SIMS, NEXAFS, and SPR Characterization of Nitrilotriacetic Acid-Terminated Self-Assembled Monolayers for Controllable Immobilization of Proteins. Analytical Chemistry. 2008;80(7):2564–2573. doi: 10.1021/ac702380w. [DOI] [PMC free article] [PubMed] [Google Scholar]; (c) Prime KL, Whitesides GM. Adsorption of proteins onto surfaces containing end-attached oligo(ethylene oxide) - a model system using self-assembled monolayers. Journal of the American Chemical Society. 1993;115(23):10714–10721. [Google Scholar]
- 16.Dhayal M, Ratner DM. XPS and SPR Analysis of Glycoarray Surface Density. Langmuir. 2009;25(4):2181–2187. doi: 10.1021/la8031122. [DOI] [PMC free article] [PubMed] [Google Scholar]
- 17.Shi J, Yang T, Kataoka S, Zhang Y, Diaz A, Cremer P. GM1 clustering inhibits cholera toxin binding in supported phospholipid membranes. J. Am. Chem. Soc. 2007;129(18):5954–5961. doi: 10.1021/ja069375w. [DOI] [PMC free article] [PubMed] [Google Scholar]
- 18.Oyelaran O, Li Q, Farnsworth D, Gildersleeve JC. Microarrays with varying carbohydrate density reveal distinct subpopulations of serum antibodies. Journal of proteome research. 2009;8(7):3529–3538. doi: 10.1021/pr9002245. [DOI] [PMC free article] [PubMed] [Google Scholar]
- 19.(a) Chen S, Li L, Boozer CL, Jiang S. Controlled Chemical and Structural Properties of Mixed Self-Assembled Monolayers by Coadsorption of Symmetric and Asymmetric Disulfides on Au(111) The Journal of Physical Chemistry B. 2001;105(15):2975–2980. [Google Scholar]; (b) Folkers JP, Laibinis PE, Whitesides GM. Self-assembled monolayers of alkanethiols on gold - comparisons of monolayers containing mixtures of short-chain and long-chain constituents with ch3 and ch2oh terminal groups. Langmuir. 1992;8(5):1330–1341. [Google Scholar]
- 20.Smith RK, Reed SM, Lewis PA, Monnell JD, Clegg RS, Kelly KF, Bumm LA, Hutchison JE, Weiss PS. Phase separation within a binary self-assembled monolayer on Au{111} driven by an amide-containing alkanethiol. J. Phys. Chem. B. 2001;105(6):1119–1122. [Google Scholar]
- 21.Stranick SJ, Parikh AN, Tao YT, Allara DL, Weiss PS. Phase-separation of mixed-composition self-assembled monolayers into nanometer-scale molecular domains. J. Phys. Chem. 1994;98(31):7636–7646. [Google Scholar]
- 22.(a) Ferrara C, Grau S, Jäger C, Sondermann P, Brünker P, Waldhauer I, Hennig M, Ruf A, Rufer AC, Stihle M. Unique carbohydrate - carbohydrate interactions are required for high affinity binding between Fc γ RIII and antibodies lacking core fucose. Proceedings of the National Academy of Sciences. 2011;108(31):12669. doi: 10.1073/pnas.1108455108. [DOI] [PMC free article] [PubMed] [Google Scholar]; (b) Bucior I, Scheuring S, Engel A, Burger MM. Carbohydrate-carbohydrate interaction provides adhesion force and specificity for cellular recognition. The Journal of cell biology. 2004;165(4):529. doi: 10.1083/jcb.200309005. [DOI] [PMC free article] [PubMed] [Google Scholar]; (c) Matsuura K, Kitakouji H, Sawada N, Ishida H, Kiso M, Kitajima K, Kobayashi K. A quantitative estimation of carbohydrate-carbohydrate interaction using clustered oligosaccharides of glycolipid monolayers and of artificial glycoconjugate polymers by surface plasmon resonance. Journal of the American Chemical Society. 2000;122(30):7406–7407. [Google Scholar]; (d) Haseley SR, Vermeer HJ, Kamerling JP, Vliegenthart JFG. Carbohydrate self-recognition mediates marine sponge cellular adhesion. Proceedings of the National Academy of Sciences. 2001;98(16):9419. doi: 10.1073/pnas.151111298. [DOI] [PMC free article] [PubMed] [Google Scholar]; (e) Eggens I, Fenderson B, Toyokuni T, Dean B, Stroud M, Hakomori SI. Specific interaction between Lex and Lex determinants. A possible basis for cell recognition in preimplantation embryos and in embryonal carcinoma cells. Journal of Biological Chemistry. 1989;264(16):9476. [PubMed] [Google Scholar]
- 23.Simons K, Ikonen E. Functional rafts in cell membranes. Nature. 1997;387(6633):569–572. doi: 10.1038/42408. [DOI] [PubMed] [Google Scholar]
- 24.(a) Yuan C, Johnston LJ. Distribution of Ganglioside GM1 in l-[alpha]-Dipalmitoylphosphatidylcholine/Cholesterol Monolayers: A Model for Lipid Rafts. Biophysical Journal. 2000;79(5):2768–2781. doi: 10.1016/S0006-3495(00)76516-7. [DOI] [PMC free article] [PubMed] [Google Scholar]; (b) Vié V, Van Mau N, Lesniewska E, Goudonnet JP, Heitz F, Le Grimellec C. Distribution of Ganglioside GM1 between Two-Component, Two-Phase Phosphatidylcholine Monolayers. Langmuir. 1998;14(16):4574–4583. [Google Scholar]
- 25.Houseman BT, Mrksich M. The role of ligand density in the enzymatic glycosylation of carbohydrates presented on self-assembled monolayers of alkanethiolates on gold. Angewandte Chemie International Edition. 1999;38(6):782–785. doi: 10.1002/(SICI)1521-3773(19990315)38:6<782::AID-ANIE782>3.0.CO;2-N. [DOI] [PubMed] [Google Scholar]
- 26.Ratner Daniel M., Plante Obadiah J., Seeberger Peter H. A Linear Synthesis of Branched High-Mannose Oligosaccharides from the HIV-1 Viral Surface Envelope Glycoprotein gp120. European Journal of Organic Chemistry. 2002;2002(5):826–833. [Google Scholar]
- 27.Castner DG, Hinds K, Grainger DW. X-ray photoelectron spectroscopy sulfur 2p study of organic thiol and disulfide binding interactions with gold surfaces. Langmuir. 1996;12(21):5083–5086. [Google Scholar]
- 28.(a) Bernsen J. Dynamic thresholding of grey-level images. 1986. pp. 252–255. [Google Scholar]; (b) Sezgin M, Sankur B. Survey over image thresholding techniques and quantitative performance evaluation. Journal of Electronic imaging. 2004;13:146. [Google Scholar]
- 29.(a) Benseñor LB, Barlan K, Rice SE, Fehon RG, Gelfand VI. Microtubule-mediated transport of the tumor-suppressor protein Merlin and its mutants. Proceedings of the National Academy of Sciences. 2010;107(16):7311. doi: 10.1073/pnas.0907389107. [DOI] [PMC free article] [PubMed] [Google Scholar]; (b) Xu F, Beyazoglu T, Hefner E, Gurkan UA, Demirci U. Automated and Adaptable Quantification of Cellular Alignment from Microscopic Images for Tissue Engineering Applications. Tissue Engineering Part C: Methods. 2011;17(6):641–649. doi: 10.1089/ten.tec.2011.0038. [DOI] [PMC free article] [PubMed] [Google Scholar]
- 30.Jackson AM, Myerson JW, Stellacci F. Spontaneous assembly of subnanometre-ordered domains in the ligand shell of monolayer-protected nanoparticles. Nature Materials. 2004;3(5):330–336. doi: 10.1038/nmat1116. [DOI] [PubMed] [Google Scholar]
- 31.Tielens F, Humblot V, Pradier CM, Calatayud M, Illas F. Stability of Binary SAMs Formed by ω-Acid and Alcohol Functionalized Thiol Mixtures. Langmuir. 2009;25(17):9980–9985. doi: 10.1021/la901127g. [DOI] [PubMed] [Google Scholar]
- 32.Love JC, Estroff LA, Kriebel JK, Nuzzo RG, Whitesides GM. Self-assembled monolayers of thiolates on metals as a form of nanotechnology. Chemical Reviews-Columbus. 2005;105(4):1103–1170. doi: 10.1021/cr0300789. [DOI] [PubMed] [Google Scholar]
- 33.Stranick S, Parikh A, Allara D, Weiss P. A new mechanism for surface diffusion: motion of a substrate-adsorbate complex. The Journal of Physical Chemistry. 1994;98(43):11136–11142. [Google Scholar]
- 34.(a) Vanderah DJ, Valincius G, Meuse CW. Self-assembled monolayers of methyl 1-thiahexa (ethylene oxide) for the inhibition of protein adsorption. Langmuir. 2002;18(12):4674–4680. [Google Scholar]; (b) Li L, Chen S, Zheng J, Ratner BD, Jiang S. Protein adsorption on oligo (ethylene glycol)- terminated alkanethiolate self-assembled monolayers: the molecular basis for nonfouling behavior. The Journal of Physical Chemistry B. 2005;109(7):2934–2941. doi: 10.1021/jp0473321. [DOI] [PubMed] [Google Scholar]
- 35.(a) Maciel J, Martins MCL, Barbosa MA. The stability of self - assembled monolayers with time and under biological conditions. Journal of Biomedical Materials Research Part A. 2010;94(3):833–843. doi: 10.1002/jbm.a.32746. [DOI] [PubMed] [Google Scholar]; (b) Jans K, Bonroy K, De Palma R, Reekmans G, Jans H, Laureyn W, Smet M, Borghs G, Maes G. Stability of mixed PEO-thiol SAMs for biosensing applications. Langmuir. 2008;24(8):3949–3954. doi: 10.1021/la703718t. [DOI] [PubMed] [Google Scholar]; (c) Willey TM, Vance AL, Van Buuren T, Bostedt C, Terminello L, Fadley C. Rapid degradation of alkanethiol-based self-assembled monolayers on gold in ambient laboratory conditions. Surface science. 2005;576(1-3):188–196. [Google Scholar]; (d) Schoenfisch MH, Pemberton JE. Air stability of alkanethiol self-assembled monolayers on silver and gold surfaces. Journal of the American Chemical Society. 1998;120(18):4502–4513. [Google Scholar]
- 36.(a) Mani G, Johnson DM, Marton D, Dougherty VL, Feldman MD, Patel D, Ayon AA, Agrawal CM. Stability of self-assembled monolayers on titanium and gold. Langmuir. 2008;24(13):6774–6784. doi: 10.1021/la8003646. [DOI] [PubMed] [Google Scholar]; (b) Rundqvist J, Hoh JH, Haviland DB. Poly (ethylene glycol) self-assembled monolayer island growth. Langmuir. 2005;21(7):2981–2987. doi: 10.1021/la0471792. [DOI] [PubMed] [Google Scholar]; (c) Stranick S, Parikh A, Tao YT, Allara D, Weiss P. Phase separation of mixed-composition self-assembled monolayers into nanometer scale molecular domains. The Journal of Physical Chemistry. 1994;98(31):7636–7646. [Google Scholar]; (d) Kakiuchi T, Sato K, Iida M, Hobara D, Imabayashi S, Niki K. Phase separation of alkanethiol self-assembled monolayers during the replacement of adsorbed thiolates on Au (111) with thiols in solution. Langmuir. 2000;16(18):7238–7244. [Google Scholar]
- 37.Bain CD, Biebuyck HA, Whitesides GM. Comparison of self-assembled monolayers on gold: coadsorption of thiols and disulfides. Langmuir. 1989;5(3):723–727. [Google Scholar]
- 38.Jung LS, Campbell CT. Sticking probabilities in adsorption from liquid solutions: Alkylthiols on gold. Physical Review Letters. 2000;84(22):5164–5167. doi: 10.1103/PhysRevLett.84.5164. [DOI] [PubMed] [Google Scholar]
- 39.Sun L, Gardella JA., Jr Oxidation-assisted secondary ion mass spectrometry methodology to quantify mixed alkylthiol self-assembled monolayers on gold: Applications to competitive chemical adsorption. Langmuir. 2002;18(24):9289–9295. [Google Scholar]
- 40.(a) Liu F, Burgess J, Mizukami H, Ostafin A. Sample preparation and imaging of erythrocyte cytoskeleton with the atomic force microscopy. Cell biochemistry and biophysics. 2003;38(3):251–270. doi: 10.1385/CBB:38:3:251. [DOI] [PubMed] [Google Scholar]; (b) Tokarev I, Krenek R, Burkov Y, Schmeisser D, Sidorenko A, Minko S, Stamm M. Microphase separation in thin films of poly (styrene-block-4-vinylpyridine) copolymer-2-(4′-hydroxybenzeneazo) benzoic acid assembly. Macromolecules. 2005;38(2):507–516. [Google Scholar]; (c) Polano M, Bek A, Benetti F, Lazzarino M, Legname G. Structural insights into alternate aggregated prion protein forms. Journal of molecular biology. 2009;393(5):1033–1042. doi: 10.1016/j.jmb.2009.08.056. [DOI] [PubMed] [Google Scholar]
- 41.(a) Liu F, Mizukami H, Sarnaik S, Ostafin A. Calcium-dependent human erythrocyte cytoskeleton stability analysis through atomic force microscopy. Journal of Structural Biology. 2005;150(2):200–210. doi: 10.1016/j.jsb.2005.02.001. [DOI] [PubMed] [Google Scholar]; (b) Carnally SM, Dev HS, Stewart AP, Barrera NP, Van Bemmelen MX, Schild L, Henderson RM, Edwardson JM. Direct visualization of the trimeric structure of the ASIC1a channel, using AFM imaging. Biochemical and biophysical research communications. 2008;372(4):752–755. doi: 10.1016/j.bbrc.2008.05.100. [DOI] [PubMed] [Google Scholar]
- 42.Tamada K, Hara M, Sasabe H, Knoll W. Surface phase behavior of n-alkanethiol self-assembled monolayers adsorbed on Au (111): An atomic force microscope study. Langmuir. 1997;13(6):1558–1566. [Google Scholar]
- 43.(a) Stranick S, Atre S, Parikh A, Wood M, Allara D, Winograd N, Weiss P. Nanometer-scale phase separation in mixed composition self-assembled monolayers. Nanotechnology. 1996;7:438. [Google Scholar]; (b) Smith RK, Reed SM, Lewis PA, Monnell JD, Clegg RS, Kelly KF, Bumm LA, Hutchison JE, Weiss PS. Phase separation within a binary self-assembled monolayer on Au {111} driven by an amide-containing alkanethiol. The Journal of Physical Chemistry B. 2001;105(6):1119–1122. [Google Scholar]; (c) Lewis P, Donhauser Z, Mantooth B, Smith R, Bumm L, Kelly K, Weiss P. Control and placement of molecules via self-assembly. Nanotechnology. 2001;12:231. [Google Scholar]
- 44.(a) Hayes WA, Kim H, Yue X, Perry SS, Shannon C. Nanometer-scale patterning of surfaces using self-assembly chemistry. Preparation, characterization, and electrochemical behavior of two-component organothiol monolayers on gold surfaces. Langmuir. 1997;13(9):2511–2518. [Google Scholar]; (b) Salaita K, Amarnath A, Maspoch D, Higgins TB, Mirkin CA. Spontaneous “phase separation” of patterned binary alkanethiol mixtures. Journal of the American Chemical Society. 2005;127(32):11283–11287. doi: 10.1021/ja042393y. [DOI] [PubMed] [Google Scholar]
- 45.Hobara D, Ota M, Imabayashi S, Niki K, Kakiuchi T. Phase separation of binary self-assembled thiol monolayers composed of 1-hexadecanethiol and 3-mercaptopropionic acid on Au (111) studied by scanning tunneling microscopy and cyclic voltammetry. Journal of electroanalytical chemistry. 1998;444(1):113–119. [Google Scholar]
- 46.(a) Jung H, Robison AD, Cremer PS. Multivalent ligand-receptor binding on supported lipid bilayers. Journal of Structural Biology. 2009;168(1):90–4. doi: 10.1016/j.jsb.2009.05.010. [DOI] [PMC free article] [PubMed] [Google Scholar]; (b) Shi J, Yang T, Kataoka S, Zhang Y, Diaz AJ, Cremer PS. GM1 clustering inhibits cholera toxin binding in supported phospholipid membranes. Journal of the American Chemical Society. 2007;129(18):5954–61. doi: 10.1021/ja069375w. [DOI] [PMC free article] [PubMed] [Google Scholar]
Associated Data
This section collects any data citations, data availability statements, or supplementary materials included in this article.


