

Abstract
There has been a new interest in using aldehyde dehydrogenase (ALDH) activity as one marker for stem cells since the Aldefluor flow cytometry-based assay has become available. Diethylaminobenzaldehyde (DEAB), used in the Aldeflour assay, has been considered a specific inhibitor for ALDH1A1 isoform. In this study, we explore the effects of human ALDH isoenzymes, ALDH1A2 and ALDH2, on drug resistance and proliferation, and the specificity of DEAB as an inhibitor. We also screened for the expression of 19 ALDH isoenzymes in K562 cells using TaqMan Low Density Array (TLDA). We used lentiviral vectors containing the full cDNA length of either ALDH2 or ALDH1A2 to over express the enzymes in K562 leukemia and H1299 lung cancer cell lines. Successful expression was measured by activity assay, Western blot, RT-PCR, and Aldefluor assay. Both cell lines, with either ALDH1A2 or ALDH2, exhibited higher cell proliferation rates, higher clonal efficiency, and increased drug resistance to 4-hydroperoxycyclophosphamide and doxorubicin. In order to study the specificity of known ALDH activity inhibitors, DEAB and disulfiram, we incubated each cell line with either inhibitor and measured the remaining ALDH enzymatic activity. Both inhibitors reduced ALDH activity of both isoenzymes by 65–90%. Furthermore, our TLDA results revealed that ALDH1, ALDH7, ALDH3 and ALDH8 are expressed in K562 cells. We conclude that DEAB is not a specific inhibitor for ALDH1A1 and that Aldefluor assay is not specific for ALDH1A1 activity. In addition, other ALDH isoenzymes seem to play a major role in the biology and drug resistance of various malignant cells.
Keywords: ALDH activity, Stem cells, Aldefluor, DEAB, Cell proliferation, Drug resistance
1. Introduction
Aldehyde dehydrogenases (ALDHs) are a group of NAD(P)+-dependent enzymes involved in the metabolism of a wide variety of aliphatic and aromatic aldehydesC According to the latest database, the human genome contains 19 ALDH functional genes and three pseudogenes [3–7]. The role of some of these ALDHs in endobiotic and xenobiotic metabolism has been reviewed extensively before [1,2,8–15] and the specific metabolic pathways affected have been previously detailed [1]. Many allelic variants within the ALDH gene family have been identified, resulting in pharmacogenetic heterogeneity between individuals which, in most cases, results in distinct phenotypes [1,15] including intolerance to alcohol and increased risk of ethanol-induced cancers (ALDH2 and ALDH1A1), Sjogren-Larson Syndrome (ALDH3A1), type II hyperprolinemia (ALDH4A1), 4-hydroxybutyric aciduria (ALDH5A1), developmental delay (ALDH6A1), hyperammonemia (ALDH18A1), and late onset of Alzheimer’s disease (ALDH2). Furthermore, knockouts of ALDH1A2 and ALDH1A3 in mouse are embryonic lethal and newborn lethal, respectively [16–18].
ALDH activity is one of the identifying markers of stem cells, both normal and malignant [19,20]. Different assays for the measurement of ALDH isozymes have been available including Western blot analysis, RT-PCR, spectrophotometric assay for enzyme activity, and immunohistochemistry. A relatively new flow cytometry-based method, Aldefluor staining, has the advantage of measuring ALDH activity in viable cells. With the introduction and marketing of the Aldefluor assay (StemCell Technologies, Inc.) it has become more feasible to study the significance of ALDH expression in murine and human hematopoietic cells [21–27]. These studies confirmed that ALDH activity is a good surrogate marker for hematopoietic stem cell activity, both in vitro and in vivo. FACS strategies that employ both surface marker expression and ALDH activity have been used to enrich for hematopoietic stem cells (HSC) and in discerning primitive and progenitor cell populations isolated from umbilical cord blood [27]. With the popularity of the cancer stem cell hypothesis, there have been many publications and reviews about the usefulness of measuring ALDH activity to identify cancer stem cells in the different tissues and its potential as a therapeutic target [19,20].
It is widely presumed that this Aldefluor assay mostly measures ALDH1A1 isozyme activity due to the report that diethylaminobenzaldehyde (DEAB) used in this assay is a specific inhibitor for ALDH1A1 [28]. Therefore, most researchers believe that the high ALDH activity detected in the early stem cells/progenitors is mainly due to ALDH1A1. On the other hand, ALDH1A1 knockout does not affect hematopoietic stem cells and hematopoiesis [29]. Based on this study and our own observation, we hypothesize that ALDH1A1 is not the only enzyme responsible for the ALDH activity measured by Aldefluor assay and that DEAB is not a specific inhibitor for ALDH1A1. Recently Marcato et al. [30] reported that Aldefluor assay detects ALDH1A3 activity in breast cancer stem cells as the main ALDH isoenzyme. As part of our ongoing interest in ALDH isoenzymes and the search for specific inhibitors [31], we overexpressed two other isoenzymes, ALDH2 and ALDH1A2 in two different cell lines and used them in the present study in order to examine our hypothesis.
2. Materials and methods
2.1. Materials and cell lines
We used three cell lines including K562 leukemia, H1299 lung cancer and Beas-2b lung epithelial cell lines, all obtained from ATCC. K562 is known to express ALDH activity but has low levels of ALDH1A1 protein by Western blot, while both H1299 and Beas-2b are known to have no significant activity by Aldefluor assay and Western blot [32]. Cells were cultured and maintained in RPMI1640 culture medium supplemented by 10% fetal bovine serum and used for the experiments when in the exponential phase of their growth. Both cell lines, K562 and H1299, were transduced with lentiviral vectors containing the full cDNA for either ALDH2, ALDH1A2 (see below) or green fluorescent protein (GFP, as a control) thus creating 4 different cell lines for each: original wild type (WT), GFP, ALDH2 and ALDH1A2 cell lines.
Aldefluor kit was purchased from StemCell Technologies, Inc. (Vancouver, Canada), and used according to the manufacturer’s recommendations. A colorimetric assay kit (MTT based) was purchased from Roche Diagnostic Corporation (Indianapolis, IN) and used for cell proliferation experiments.
2.2. Lentiviral constructs and gene expression
We used RT-PCR to synthesize the full length cDNA for human ALDH2 (NM_000690.2) and ALDH1A2 (NM_170696). Primers were designed and purchased from MWG-Biotech AG (Bridgeport, GA). Total RNA was extracted from wild type K562 cells and used for the synthesis of the mentioned cDNAs. The Appropriate cDNAs were verified by size and full sequencing before cloning into the self-inactivating (SIN) pTYF-EF lentiviral vector between the BamH I and Spe I sites [33]. Cells were incubated at 1 × 10⁴ in 300 μl culture medium with the lentivirus for 4–5 h and then transferred to a small flask for continuous culture. Expression of the gene of interest was measured by RT-PCR using one primer in the promoter of the lentiviral construct and another for the specific ALDH isoenzyme. ALDH activity and Western blots were used to detect increase in ALDH activity and the corresponding proteins (described below). These were performed on the parent cell line as well the new cell lines expressing ALDH1A2 or ALDH2. These cell lines were established as single clones expanded from single colonies that were manually picked under an inverted microscope.
2.3. Western blots
Western blot analysis was performed as described before[34,35]. In brief, lysates from each of the cell lines were size separated in parallel on 12% denaturing SDS–polyacrylamide gels (BioRad, Hercules, CA), electrotransferred onto nitrocellulose membranes, blocked with 5% milk in TBS, and probed using mouse anti human ALDH1A2 and ALDH2 polyclonal antibodies. Antibodies against ALDH1A2 were purchased from Santa Cruz Biotechnology, Inc. (Santa Cruz, CA) and antibodies against ALDH2 were a generous gift from Dr. Henry Weiner (Purdue University, West Lafayette, IN). Blots were incubated with ALDH1A2 and ALDH2 primary antibodies at 1:200 or 1:300 dilution, respectively, for 1 h at room temperature. After washing, the secondary antibody (horse-radish peroxidase-labeled rabbit anti-mouse IgG antibody; A8044, Sigma Chemical Co., St. Louis, MO) was used at 1:4000 dilution for 1 h. Chemiluminescence method (SuperSignal, Pierce, Rockford, IL) was used for the final visualization of the protein bands on X-ray film (Super Rx, Fuji Photo Film, Tokyo, Japan). After washing and blocking, the same blots were labeled again for visualization of actin as a loading control using anti-actin antibody (Oncogene Research Products, Cambridge, MA).
2.4. ALDH activity measurement
The cell lysates used for Western blot analysis, were also freshly used to measure ALDH enzyme activity using the spectrophotometric assay as described before [34,35]. Briefly, the aliquots of 600 μl lysing buffer were incubated at 37 °C in Beckman DLC 64 spectrophotometer cuvettes with the addition of cell lysate, 5 mM NAD+ and 5 mM propionaldehyde as a substrate. The rate of change in absorbance at 340 nm was measured in 3 replicates over 5 min. A control reaction in which the substrate was not added monitored the endogenous rate of NAD+ reduction. The ALDH activity was expressed in nmol/107 cells*min.
2.5. Cell proliferation and colony formation assays
In order to study the effect of overexpressing the ALDH isoenzymes on cell behavior, we performed several assays that measure cell proliferation and clonal efficiency on each of the cell lines mentioned above. All experiments were performed in duplicates or triplicates as indicated. First, cells were cultured in their usual culture medium at a concentration of 5 × 10³ cells/mL/well in 6-well plates and manual cell count and viability (determined by trypan blue exclusion) were performed daily over 3 days and the results were plotted against time in order to show the growth rate. Second, 3-(4,5-dimethylthiazol-2-yl)-2,5-diphenyl tetrazolium bromide (MTT) cell proliferation assay was performed in a 96-well plate, 5 × 10³ cells/100 μl/well of each cell line were cultured for 72 h. After the 72 h incubation period, 20 μl of MTT reagent was added to each well, and incubated for one hour in a humidified 5% CO2 incubator at 37 °C. The absorbance was measured using a BIORADMicroplate reader at a wavelength of 490 nm according to the manufacturer’s protocol. In this experiment, absorbance directly correlates with number of viable cells per well. Mean ± SD of the absorbance values were calculated for each experimental group and graphically expressed. Differences were evaluated for significance using the t-student test, and P value of <0.05 was considered statistically significant.
Liquid colony assay (for H1299 cell lines) and methylcellulose colony assay (for K562 cell lines) were performed as described before [33,36]. H1299 cells were trypsinized, washed and counted and 600 cells were added to 3 mL of RPMI culture medium supplemented by 10% FBS, and then aliquoted at 200 cells/mL/dish. K562 cells were harvested, counted and then 600 cells were added to 3 mL of readily available methylcellulose-containing growth factors (Methocult GF-H4435; Stem Cell Technology, Vancouver, BC, Canada). The dishes were kept in a humidified 5% CO2 incubator at 37 °C and colonies were counted on day 5–7 using an inverted microscope. The total number of colonies per culture dish was scored and the mean ± SD was obtained from triplicate readings. Differences between the different cell types were evaluated for significance using the t-student test.
2.6. Drug resistance induced by ALDH1A2 and ALDH2 overexpression
Previous studies have established the relationship between the expression of ALDH1A1 and ALDH3A1 and drug resistance to cyclophosphamide and its derivatives [35], as well as etoposide and mitomycin C [37]. The role of ALDH1A2 and ALDH2 in such drug resistance has not been studied before. In order to evaluate the effect of ALDH1A2 and ALDH2 overexpression on drug resistance, we exposed the different K562 and H1299 cell lines to either 4-hydroperoxycyclophosphamide (4-HC) or doxorubicin and used MTT assay described above to measure toxicity. We chose these two drugs for the following reasons: both drugs are clinically effective and frequently used anti cancer chemotherapy, 4-HC is known to be a substrate for ALDH1A1 and ALDH3A1, and doxorubicin is known not to be a substrate for any ALDH isoenzyme. We incubated 5 × 10³ cells per well in triplicates using 96-well plate and exposed them to the different concentrations of each drug for 72 h. The viability was measured by BIORADMicroplate reader and expressed as the mean ± SD for each treatment concentration.
2.7. Aldefluor assay
The Aldefluor reagent system supplied by Stem Cell Technologies (Vancouver, Canada) uses an immunofluorescent method to detect intracellular enzyme activity of ALDH. Aldefluor is supplied in the form of Bodipy-aminoacetaldehyde diethyl acetal (BAAA-DA). BAAA-DA is converted to Bodipy-aminoacetaldehyde (BAAA) by exposure to acid. BAAA is a fluorescent substrate for ALDH. In this study, we treated each cell mixture at 1.0 × 10⁶ cells in 1 ml of Aldefluor assay buffer with BAAA at a concentration of 1.5 mM for 45 min at 37 °C. In each experiment, a sample of cells was stained under identical conditions with 15 μM of the ALDH inhibitor DEAB to serve as a negative control. Flow cytometry was performed using FACScan instrument equipped with 488 nm argon laser (B-D Biosciences, San Jose, CA) and the data analyzed using Cell Quest software, version 3.3 (B-D Biosciences), as described before [32].
2.8. Taqman Low Density Array (TLDA) analysis
WT K562 cells were stained for Aldefluor and sorted into cells with high (ALDHhi) and low (ALDHlo) ALDH activity groups of cells using FACScan flow cytometer as described before [32]. Total RNA was isolated from each group of K562 cells using the RNeasy mini kit from Qiagen. The RNA integrity number (RIN) was tested by using the Agilent 2100 Bioanalyzer (Agilent Technologies). Complementary DNAs (cDNAs) were produced from 2 μg RNA of each sample using the High Capacity RNA-to-cDNA Master Mix (Applied Biosystems) according to the manufacturer’s instructions. These cDNAs were used to interrogate custom made TaqMan array 96-well plates prepared by Applied Biosystems. The wells contained primers for all known ALDH isoenzymes as well as suitable endogenous control genes (using the GeneBank accession numbers) that included 18S, GAPDH, HPRT1, and GUSP. Each sample was measured in triplicate and normalized to each of the control genes. 30 μl of cDNA were mixed with 770 μl of nuclease-free water and 800 μl of 2 × TaqMan Gene Expression Master Mix (cat# 4369016, Applied Biosystems). 20 μl of the reaction mix were delivered to each of the 72 wells containing the primers. Applied Biosystems SDS software version 2.3 was used to cycle the plates, parameters were 50 °C for 2 min, 95 °C for 10 min, and 40 cycles of 95 °C for 15 s and 60 °C for 1 min. The data for several plates were then combined into a study using the Applied Biosystems software SDS RQ (relative quantity) Manager version 1.2. Threshold and baseline were set to auto. RQ min/max confidence level was set to 99% and the plate centric view was used to export the data as Ct values to Excel file. Ct is the fractional cycle number at which the fluorescence intensity exceeds the threshold intensity. The final results reflected comparison between the normalized values for each ALDH gene detected in ALDHhi cells to those in ALDHlo cells and expressed as the log10 RQ in bar graphs.
3. Results
3.1. Ectopic overexpression of ALDH1A2 and ALDH2
K562 leukemia and H1299 lung cancer cells were transduced with lentiviral vectors encoding ALDH1A2, ALDH2, or GFP (as a control). The ALDH2 and ALDH1A2 transduced cells were cultured and single colonies were picked and expanded in culture. These clones were harvested, given names designated sequentially either by numbers or alphabetical letters and screened for expression of the corresponding isoenzyme using Western blots as well as ALDH activity using spectrophotometry based assay. The results of Western blots and enzyme activity are shown in Fig. 1A–C. RT-PCR using one primer in the promoter of the lentiviral constructs and another for the specific ALDH isoenzyme was also performed and confirmed successful expression of each one of the isoenzymes (data not shown). Overall, our results show high expression of ALDH1A2 and ALDH2 in the parent cell lines and their clones shown in Fig. 1 without significant differences. Thus, we established 4 different cell lines for K562 and H1299 (WT, GFP, ALDH1A2, and ALDH2) and used the clones and parent cell lines interchangeably throughout the experiments described below. We also established that WT and GFP cell lines had similar ALDH activity and proliferation rate (Fig. 1-S), and therefore we used WT cells only as the control in all subsequent experiments.
Fig. 1.

Western blot analysis showing the expression of ALDH2 and ALDH1A2 isoenzymes in each of the cell lines, K562 and H1299 (A and B). Baseline expression is shown for each of the cell lines including the original cell line (WT), transduced cell line (parent) and several clones obtained from single colonies of the transduced parent cell line. Western blots were labeled for ALDH1A2 and ALDH2 as well as actin for loading control. A total of 40 lg/lane protein was loaded. (C) ALDH activity is shown for each of the transduced cell lines, K562 and H1299, expressing ALDH2 and ALDH1A2. The enzyme activity is measured by the spectrophotometric enzyme assay and expressed as nmol/107 cells*min. Comparison is made to the baseline enzyme activity in the parent cell line (WT). The results reflect the mean ± SD of at least 6 readings measured at P3 different experiments.
3.2. Effects of ALDH1A2 and ALDH2 overexpression on cell proliferation and clonal efficiency
Our previously published study showed that knock down of ALDH1A1 and ALDH3A1 resulted in a significant decrease in cell proliferation of A549 and H522 lung cancer cell lines [33]. The effect of ALDH1A2 and ALDH2 on cell proliferation and clonal efficiency has not been studied before. Thus, we designed studies to explore these effects in both cell lines used here. For cell proliferation, we used both 72 h cell culture as well as MTT assay to detect differences in daily cell growth and the results from 5 different experiments are shown in Fig. 2. For K562 leukemia cell lines, overexpression of ALDH2 and ALDH1A2 significantly (P ≤ 0.022, at 96 h) increased the proliferation rate as compared to wild type parental cells (Fig. 2A and C). On the other hand, only ALDH1A2 overexpression in H1299 increased the proliferation rate significantly (P ≤ 0.043, at 96 h) when compared to the wild type cells (Fig. 2B and D). The variation in the results suggests that overexpression of ALDH2 or ALDH1A2 promote cell growth yet the impact level differs depending on other factors that may be specific to the cell type. Although the results presented here and in all subsequent experiments in this paper reflect experiments that were performed on multiple occasions and multiple cell cultures, there is still the possibility that certain clones of each cell line may behave differently and that more experiments comparing individual clones from each transduced cell line may be needed to confirm these results.
Fig. 2.

The effect of overexpression of ALDH2 and ALDH1A2 on cell proliferation. Cell proliferation for the different cell lines was measured by counting viable cells using the trypan blue (A and B) or by the MTT colorimetric method (C and D). The results reflect the mean ± SD of triplicate measurements per one experiment repeated for P2 experiments. *indicates significant difference in comparison to the WT cells (P < 0.05). (For interpretation of the references to color in this figure legend, the reader is referred to the web version of this article.)
The ability to form colonies was also significantly increased (P ≤ 0.018) by the overexpression of either ALDH1A2 or ALDH2 in both cell lines when compared to the parent cell line (Fig. 3). The results reflect the mean ± SD of number of colonies from 6 dishes per experimental group and obtained from two similar experiments.
Fig. 3.
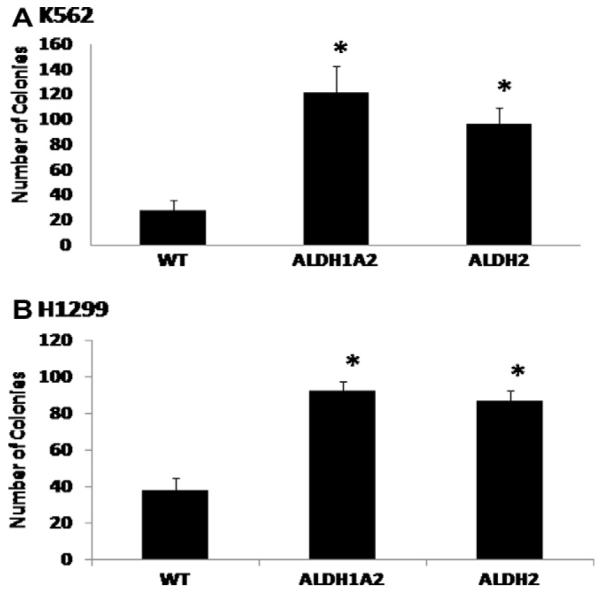
The effect of overexpressing ALDH2 and ALDH1A2 on colony formation. Colony assays were performed as described in the methods for each of 3 cell lines established for K562 and H1299. The results reflect mean ± SD of the number of colonies per 200 cells/dish plated and obtained from P2 different experiments. *indicates significant difference in comparison to the WT cells (P < 0.05).
3.3. Effects of ALDH1A2 and ALDH2 overexpression on drug resistance
In the present study, we treated K562 and H1299 cell lines with various concentrations of either 4-HC or doxorubicin and assessed toxicity by MTT assay. Drug concentrations were chosen according to published data. Interestingly, both ALDH1A2 and ALDH2 overexpression resulted in increased relative resistance to both drugs at the different drug concentrations used in both cell lines (Fig. 4).
Fig. 4.

The effects of overexpressing ALDH2 and ALDH1A2 on drug resistance. Cells were treated with 4-HC (A and B) and doxorubicin (Dox) (C and D) at different concentrations and the toxicity was measured by MTT assay. The results reflect mean ± SD of triplicate wells treated for each cell type and drug concentration.
3.4. Specificity of DEAB and disulfiram as ALDH activity inhibitors
One of our main aims for this study was to investigate the specificity of existing ALDH activity inhibitors, such as DEAB and disulfiram (Antabuse, TT). DEAB is used as a specific inhibitor for ALDH1A1 [28], while TT is not specific inhibiting a number of other enzymes [38]. In this study, we incubated each cell line with each inhibitor at a concentration of 25 μM for 48 h, and then measured the ALDH activity in the cell lysate using the spectrophotometric enzyme activity assay. The results are shown in Fig. 5, and indicate that both DEAB and TT can inhibit 65–90% of the enzymatic activity resulting from overexpressing ALDH1A2 or ALDH2. In addition, we measured the inhibitory effects of DEAB in vitro by incubating the cell lysate from both cell lines with 1, 10, and 25 μM DEAB for 5 min at 37 °C before measuring the ALDH enzymatic activity. These results are shown in Table 1 and demonstrate again that DEAB inhibits both ALDH1A2 and ALDH2 isoenzymes. Thus, our main conclusion is that DEAB can inhibit other ALDH isoenzymes other than ALDH1A1. However, DEAB at the concentrations used here may not be a strong inhibitor for ALDH1A2. This is in good agreement with the observation made in Aldefluor assay results shown in Fig. 6. The differences seen here between transduced K562 and H1299 are most likely related to the differences in baseline ALDH activity. The use of higher concentrations of DEAB up to 100 μM may have overcome that difference.
Fig. 5.

The use of ALDH activity inhibitors DEAB and disulfiram (TT). Each cell line was incubated with ALDH inhibitor at a concentration of 25 μM for 48 h, and then measured the ALDH activity in the cell lysate using the spectrophotometric enzyme activity assay. The results reflect mean ± SD of the remaining ALDH activity % calculated from multiple measurements obtained from at least 3 different experiments. The remaining activity % = activity after inhibitor/activity without inhibitor × 100. See Fig. 1C for examples of ALDH activity levels without inhibitors. The ALDH activity decreases to zero in WT K562 and H1299 cells after similar treatments with the same inhibitors (data not shown).
Table 1.
The effect of in vitro DEAB treatment on inhibition of ALDH1A2 and ALDH2 enzymatic activity using propionaldehyde as a substrate.
| DEAB (μM) | K562/ALDH1A2 | K562/ALDH2 | H1299/ALDH1A2 | H1299/ALDH2 |
|---|---|---|---|---|
| 1 | 81 ± 12a | 93 ± 6 | 65.5 ± 3.5 | 90 ± 3.5 |
| 10 | 45 ± 9 | 58 ± 5 | 58 ± 5 | 55 ± 10 |
| 25 | 13 ± 1 | 5 ± 4 | 52 ± 2 | 41 ± 5 |
The results show the mean ± SD of the remaining ALDH enzymatic activity (%) after 5 min incubation of cell lysate with increasing concentrations of DEAB. The remaining activity % = activity after inhibitor/activity without inhibitor × 100. The baseline ALDH activity for K562/ALDH1A2 was 38 ± 9, K562/ALDH2 36 ± 6, H1299/ALDH1A2 86 ± 13, H1299/ALDH2 77 ± 18 nmol/107cells*min. The ALDH activity of untransduced K562/WT and H1299/WT cells was 4.5 ± 2 and 3.6 ± 2.4 nmol/107*min, respectively, and decreased to zero with the addition of DEAB.
Fig. 6.

Aldefluor assay in K562 and H1299 cells expressing ALDH2 (H2), ALDH1A2 (1A2), or wild type cells (WT). Mixtures of these cells with Beas-2B cells were labeled with Aldefluor (BAAA) with and without the ALDH inhibitor DEAB as described in Section 2 and analyzed by flow cytometry. The gate (R3 region) for ALDH + cells is determined in relation to the DEAB control (first column DEAB+) and shows the brightly fluorescent ALDH population versus the side scatter, a population that is absent/decreased in the presence of DEAB. The number shown in each panel reflects the percentage of ALDH + cells in each corresponding group.
3.5. The specificity of Aldefluor assay
Aldefluor flow cytometry-based assay has been used to isolate candidate normal and cancer stem cells from different human tissues [19,20]. Because DEAB is used as the control arm in the Aldefluor assay, many investigators presumed that the detected ALDH activity in these candidate stem cells was due to ALDH1A1. In order to test the specificity of the Aldefluor assay, we used it to detect intracellular enzymatic activity of ALDH1A2 and ALDH2 in each of the different K562 and H1299 cell lines created for this study. In order to facilitate the detection of ALDH activity, we combined the ALDH1A2 or ALDH2 cells (20–25%) with Beas-2B immortalized lung epithelial cells (75–80%) known to have negligible ALDH activity [32]. The cell mixture was then stained and analyzed and the results are shown in Fig. 6. Overall, our results show that the enzyme activity of both ALDH1A2 and ALDH2 can be easily detected by the Aldefluor assay and therefore the Aldefluor assay cannot be viewed as a specific assay for the detection of ALDH1 or ALDH1A1 enzymatic activity. Of interest is the fact that in both cell lines, the DEAB inhibition of ALDH1A2 was not complete (middle panels, Fig 6). This finding was seen on repeated assays and could be explained by inadequate concentration of DEAB versus the amount of ALDH1A2 molecules to be inhibited. This finding does not affect our conclusions.
3.6. TLDA results show other ALDH isoenzymes expressed in K562 cells
The TLDA assay is used here to compare the expression of different ALDH isoenzymes between ALDHhi obtained from WT K562 cells and ALDHlo cells obtained from K562 cell expressing ALDH1A2. These cells were sorted using aldefluor staining and FACS Vantage. The measurements for the expression of each ALDH gene were normalized to each of the 4 reference genes expression. However, because the results did not differ significantly, the final results reflect normalization to the 18S ribosomal RNA only. The comparative Ct method was used to show the final change (relative quantity = RQ) in expression of the different isoenzymes in ALDHhi cells when compared to the ALDHlo cells (Table 2). High RQ value means higher expression of the specific ALDH isoenzyme in the ALDHhi cells. Some of the samples are assigned Ct values of >40. This is because after 40 cycles of PCR, the calibrator sample did not produce enough fluorescence to cross the threshold, so there is no cycle threshold (Ct) value, defined as the number of PCR cycles in order to get a fluorescent signal. For quantitative purposes, these samples are assigned a Ct value of 40. However, that is the best possible Ct value which is used to calculate an RQ value, thus the RQ could be even much higher in samples where the value in ALDHhi cells is lower than 40 and that of the ALDHlo cells is >40 such as the case for ALDH3A1 and ALDH1L1. The RQ value cannot be calculated if the Ct value is >40 in both groups of cells (see Table 2).
Table 2.
The results of TLDA analysis. The average Cta values ± standard error (SE) are given for the two experimental groups of K562 cells: cells with high (ALDHhi) versus low (ALDHlo) ALDH activity. The relative quantity (RQ) values reflect the differential expression of the different ALDH isoenzymes. High RQ values indicate higher expression of the gene in ALDHhi cells.
| Gene name | Average Ct ± SE ALDHlo | Average Ct ± SE ALDHhi | RQa |
|---|---|---|---|
| 18S-Hs99999901_s1 | 12.9 | 13.7 | - |
| ALDH16A1 -Hs00292269_m1 | 32 ± 0.05 | 32.3 ± 0.03 | 1.4 |
| ALDH18A1-Hs00913261_m1 | 30.1 ± 0.12 | 31.1 ± 0.1 | 0.9 |
| ALDH1Al-Hs00167445_m1 | 31 ± 0.06 | 31.7 ± 0.03 | 1.1 |
| ALDH1A1-Hs00946916_m1 | 30.4 ± 0.06 | 30.9 ± 0.02 | 1.2 |
| ALDH1A2-Hs00180254_m1 | 23.96 ± 0.05 | 26.8 ± 0.03 | 0.2 |
| ALDH1A3-Hs00167476_m1 | >40 | >40 | Unknown |
| ALDH1B1-Hs00377718_m1 | 28.2 ± 0.07 | 29.3 ± 0.3 | 0.8 |
| ALDH1L1-Hs00201836_m1 | >40 | 36.6 ± 0.6 | ≥19 |
| ALDH1L2-Hs00402876_m1 | 33.9 ± 0.05 | 34.4 ± 0.06 | 1.2 |
| ALDH2-Hs00355914_m1 | 30.2 ± 0.05 | 30.8 ± 0.05 | 1.1 |
| ALDH3A1-Hs00167469_m1 | >40 | >40 | Unknown |
| ALDH3Al-Hs00964880_m1 | >40 | 35.9 ± 0.03 | ≥29.6 |
| ALDH3B1-Hs00997594_m1 | 35.1 ± 0.1 | 35.9 ± 0.6 | 0.99 |
| ALDH3B2-Hs02511514_s1 | 33.9 ± 0.05 | 32.6 ± 0.07 | 4.3 |
| ALDH4A1-Hs00186689_m1 | 28.9 ± 0.05 | 29.5 ± 0.05 | 1.1 |
| ALDH5A1-Hs00542449_m1 | 30.7 ± 0.06 | 30.9 ± 0.03 | 1.6 |
| ALDH6A1-Hs00194421_m1 | 30.8 ± 0.06 | 30.7 ± 0.03 | 1.9 |
| ALDH7A1-Hs00609622_m1 | 35.9 ± 0.06 | 34.6 ± 0.12 | 4.3 |
| ALDH8A1-Hs00542456_m1 | 35.9 ± 0.7 | 32.5 ± 0.15 | 18.3 |
| ALDH9A1-Hs00997881_m1 | 30.4 ± 0.08 | 30.8 ± 0.03 | 1.3 |
| GAPDH-Hs99999905_m1 | 22.9 ± 0.06 | 23.3 ± 0.2 | 1.3 |
| GUSB-Hs99999908_m1 | 29.3 ± 0.05 | 29.9 ± 0.02 | 1.1 |
| HPRT1-Hs99999909_m1 | 27.9 ± 0.05 | 28.9 ± 0.03 | 0.89 |
Ct reflects the fractional cycle number at which the fluorescence intensity exceeds the threshold intensity. Smaller Ct value indicates higher level of gene expression. For ALDH1A1 and ALDH3A1, two different sets of primers were used in the custom made TaqMan array (shaded rows). Based on these Ct values, RQ was calculated using the Applied Biosystems software SDS Manager version 1.2.
The results reveal that in addition to the ALDH1 isoenzymes, these cells express several ALDH genes from other families including ALDH3, ALDH7 and ALDH8 and to a lesser degree ALDH5 and ALDH6. These isoenzymes seem to be contributing to the ALDH activity as measured by Aldefluor assay and could be inhibited by DEAB as well. Further studies, especially with ALDH7 and ALDH8, are needed to confirm that.
4. Discussion
The human ALDH family of enzymes contains 19 genes and belongs to the group of drug-metabolizing enzymes [7]. The total number of substrates for these enzymes is very large and the degree of substrate specificity is not well understood [39]. The ALDH family is known to catalyze various endogenous and exogenous substrates with some specificity [40,41]. The best evidence for isoenzyme substrate specificity comes from the polymorphism of human ALDHs which in most cases is associated with altered drug metabolism and disease phenotype [40,41]. On the other hand, in vitro enzymatic assays have used few substrates such as propionaldehyde and benzaldehyde with little evidence of specificity [42,43]. In this study, we show that ALDH1A2 and ALDH2 can metabolize propionaldehyde using spectrophotometric assay, while our previous publications show that ALDH1A1 and ALDH3A1 can do that as well [32–35]. These studies suggest an overlap in enzymatic activity between 3 different ALDH families.
We have previously shown that knock-down of ALDH1A1 and ALDH3A1 using siRNA affects cell proliferation and motility [33]. In this study, the overexpression of ALDH1A2 and ALDH2 results in a significant increase in cell proliferation and colony formation. This is previously unknown effect for these ALDH isoenzymes. The results from our microarray analysis performed on the cells with knock-down of ALDH1A1 and ALDH3A1 [33] showed that 4% of the induced genes were related to cell proliferation pathways while 5% of the repressed genes were cell cycle related. Thus it is possible that the overexpression of ALDH1A2 and ALDH2 affect similar genes that result in increased proliferation. We plan to perform similar gene profiling analysis on the cells used in this study in order to verify such possible mechanisms. Furthermore, these cells become more resistant to chemotherapy such as 4-HC and doxorubicin. This is previously unknown finding, since there is no literature on the activity of ALDH2 and ALDH1A2 and metabolism of cyclophosphamide derivatives or doxorubicin. The mechanism for resistance to 4-HC is most likely related to direct metabolism by ALDH1A2 and ALDH2, similar to what is known about ALDH1A1 and ALDH3A1. The increased resistance to doxorubicin is most likely mediated through other indirect mechanisms such as the oxidative stress response and clearance of free radicals as reported before for ALDH3A1 in relation to resistance to etoposide and mitomycin C [37]. Further studies are still needed to verify such possible mechanisms; however the results of our studies suggest a significant overlap among these ALDH isoenzymes which has never been reported before. These findings also suggest that the use of ALDH isoenzyme-specific inhibitors may not be clinically desirable when it comes to treatment of drug resistant cancer. On the other hand, targeting ALDH activity for other therapeutic purposes may turn out to be complicated, just as it has been demonstrated with the clinical use of disulfiram in the treatment of alcohol addiction [44].
Over the last few decades, several investigators have tried to identify ALDH inhibitors with variable specificity [45–47]. DEAB was promoted as a specific competitive inhibitor of ALDH1 [28]. We and others have used it in our experiments over the years to inhibit other ALDH isoenzyes [33,48,49], but never questioned its specificity before. However, current interest in ALDH activity, Aldefluor assay and cancer stem cells and the potential clinical implications have been behind our current questioning of the specificity of DEAB. Our studies clearly demonstrate that DEAB as well as TT are not specific for ALDH1 family. The implication of these findings is that DEAB mediated inhibition of ALDH activity is not equivalent to exclusive inhibition of ALDH1. Furthermore, it is now clear that more specific inhibitors of the active ALDH isoenzymes are needed for the appropriate clinical applications such as targeting ALDH + cancer stem cells. Thus currently the only method of specific inhibition available is the use of isoenzyme specific siRNA, or similar approach, as we have demonstrated before [33].
Similarly, the results of our studies show that Aldefluor assay is not specific for ALDH1A1 and detects the activity of different ALDH isoenzymes including ALDH2 as shown in our current results. Furthermore, WT K562 cells with high ALDH activity (ALDHhi) that were sorted based on Aldefluor staining and studied by TLDA, show expression of other ALDH isoenzymes including ALDH3, ALDH7 and ALDH8. These results again show that ALDH activity detected by Aldefluor may reflect the activity of other ALDH families beyond just the ALDH1 family. For the future, it will be interesting to develop similar Aldefluor assays using different but more specific substrates that will allow the detection of the exact ALDH isoenzymes expressed in any given cell type.
5. Conclusions
In summary, ALDH1A2 and ALDH2 isoenzymes are important for cell proliferation and drug resistance, and their enzymatic activity can be detected by Aldefluor assay and is inhibited by DEAB and TT. K562 cells express more ALDH gene families other than just the ALDH1 family. Thus, there are many overlaps in the expression and function of these ALDH enzyme families. In view of these results and the clinical experience with the use of disulfiram as a treatment for alcohol addiction, the future challenge is to develop more specific inhibitors for the different ALDH isoenzymes for use in cancer therapy and other diseases.
Supplementary Material
Acknowledgment
This work was supported by NIH U01 Grant (Number HD060488-03) to J.K. Amory, J.S. Moreb and A.S. Goldstein.
Footnotes
Conflict of interest statement The authors declare that there are no conflicts of interest.
Author contributions J.S. Moreb – Conception and design, data analysis and interpretation, manuscript writing, and final approval of manuscript.
D. Ucar – Collection and assembly of results, data analysis and interpretation.
S. Han – Collection and assembly of results, data analysis and interpretation.
J.K. Moreb – Financial support, conception and design, proof reading the manuscript.
A.S. Goldstein – Financial support, conception and design, proof reading the manuscript.
B. Ostmark – Collection and assembly of results.
L.-J. Chang – Conception and design, designed primers and assembled lentiviral vectors.
Appendix A. Supplementary data Supplementary data associated with this article can be found, in the online version, at doi:10.1016/j.cbi.2011.10.007.
References
- [1].Vasiliou V, Pappa A, Estey T. Role of human aldehyde dehydrogenases in endobiotic and xenobiotic metabolism. Drug Metab. Rev. 2004;36:279–299. doi: 10.1081/dmr-120034001. [DOI] [PubMed] [Google Scholar]
- [2].Sladek NE. Human aldehyde dehydrogenases: potential pathological, pharmacological, and toxicological impact. J. Biochem. Mol. Toxicol. 2003;17:7–23. doi: 10.1002/jbt.10057. [DOI] [PubMed] [Google Scholar]
- [3].Vasiliou V, Bairoch A, Tipton KF, Nebert DW. Eukaryotic aldehyde dehydrogenase (ALDH) genes: human polymorphisms, and recommended nomenclature based on divergent evolution and chromosomal mapping. Pharmacogenetics. 1999;9:421–434. [PubMed] [Google Scholar]
- [4].Ziegler TL, Vasiliou V. Aldehyde dehydrogenase gene superfamily. The 1998 update. Adv. Exp. Med. Biol. 1999;463:255–263. doi: 10.1007/978-1-4615-4735-8_32. [DOI] [PubMed] [Google Scholar]
- [5].Vasiliou V, Pappa A. Polymorphisms of human aldehyde dehydrogenases. Consequences for drug metabolism and disease. Pharmacology. 2000;6:192–198. doi: 10.1159/000028400. [DOI] [PubMed] [Google Scholar]
- [6].Sophos NA, Vasiliou V. Aldehyde dehydrogenase gene superfamily: the 2002 update. Chem. Biol. Interact. 2003;143–144:5–22. doi: 10.1016/s0009-2797(02)00163-1. [DOI] [PubMed] [Google Scholar]
- [7].Vasiliou V, Nebert DW. Analysis and update of the human aldehyde dehydrogenase (ALDH) gene family. Hum. Genomics. 2005;2:138–143. doi: 10.1186/1479-7364-2-2-138. [DOI] [PMC free article] [PubMed] [Google Scholar]
- [8].Pietruszko R. Aldehyde dehydrogenase isozymes. Isozymes Curr. Top. Biol. Med. Res. 1983;8:195–217. [PubMed] [Google Scholar]
- [9].Agarwal DP, Goedde HW. Human aldehyde dehydrogenase isozymes and alcohol sensitivity. In: Rattazzi MC, Scandalios JG, Whitt GS, editors. Isozymes: Current Topics in Biological and Medical Research. Agriculture, Physiology, and Medicine. vol. 16. Alan R Liss; New York: 1987. pp. 21–48. [PubMed] [Google Scholar]
- [10].Sladek NE, Manthey CL, Maki PA, Zhang Z, Landkamer GJ. Xenobiotic oxidation catalyzed by aldehyde dehydrogenases. Drug Metab. Rev. 1989;20:697–720. doi: 10.3109/03602538909103572. [DOI] [PubMed] [Google Scholar]
- [11].Goedde HW, Agarwal DP. Pharmacogenetics of aldehyde dehydrogenase (ALDH) Pharmacol. Ther. 1990;45:345–371. doi: 10.1016/0163-7258(90)90071-9. [DOI] [PubMed] [Google Scholar]
- [12].Lindahl R. Aldehyde dehydrogenases and their role in carcinogenesis. Crit. Rev. Biochem. Mol. Biol. 1992;27:283–335. doi: 10.3109/10409239209082565. [DOI] [PubMed] [Google Scholar]
- [13].Yoshida A, Rzhetsky A, Hsu LC, Chang C. Human aldehyde dehydrogenase gene family. Eur. J. Biochem. 1998;251:549–557. doi: 10.1046/j.1432-1327.1998.2510549.x. [DOI] [PubMed] [Google Scholar]
- [14].Sladek NE. Aldehyde dehydrogenase-mediated cellular relative insensitivity to the oxazaphosphorines. Curr. Pharm. Des. 1999;5:607–625. [PubMed] [Google Scholar]
- [15].Vasiliou V, Pappa A, Petersen DR. Role of aldehyde dehydrogenases in endogenous and xenobiotic metabolism. Chem. Biol. Interact. 2000;129:1–19. doi: 10.1016/s0009-2797(00)00211-8. [DOI] [PubMed] [Google Scholar]
- [16].Niederreither K, McCaffery P, Drager UC, Champon P, Dolle’ P. Restricted expression and retinoic acid-induced downregulation of the retinaldehyde dehydrogenase type 2 (RALDH-2) gene during mouse development. Mech. Dev. 1997;62:67–78. doi: 10.1016/s0925-4773(96)00653-3. [DOI] [PubMed] [Google Scholar]
- [17].Niederreither K, Subbarayan V, Dolle’ P, Champon P. Embryonic retinoic acid synthesis is essential for early mouse post-implantation development. Nat. Genet. 1999;21:444–448. doi: 10.1038/7788. [DOI] [PubMed] [Google Scholar]
- [18].Dupe V, Matt N, Garnier JM, Chambon P, Mark M, Ghyselinck NB. A newborn lethal defect due to inactivation of retinaldehyde dehydrogenase type 3 is prevented by maternal retinoic acid treatment. Proc. Natl. Acad. Sci. USA. 2003;100:14036–14041. doi: 10.1073/pnas.2336223100. [DOI] [PMC free article] [PubMed] [Google Scholar]
- [19].Moreb JS. Aldehyde dehydrogenase as a marker for stem cells. Curr. Stem Cell. Res. Ther. 2008;3:237–246. doi: 10.2174/157488808786734006. [DOI] [PubMed] [Google Scholar]
- [20].Alison MR, Guppy NJ, Lim SM, Nicholson LJ. Finding cancer stem cells: are aldehyde dehydrogenases fit for purpose? J Pathol. 2010;222:335–344. doi: 10.1002/path.2772. [DOI] [PubMed] [Google Scholar]
- [21].Storms RW, Trujillo AP, Springer JB, Shah L, Colvin OM, Ludeman SM, Smith C. Isolation of primitive human hematopoietic progenitors on the basis of aldehyde dehydrogenase activity. Cell Biol. 1999;96:9118–9123. doi: 10.1073/pnas.96.16.9118. [DOI] [PMC free article] [PubMed] [Google Scholar]
- [22].Jones RJ, Barber JP, Vala MS, Collector MI, Kaufmann SH, Ludeman SM, Colvin OM, Hilton J. Assessment of aldehyde dehydrogenase in viable cells. Blood. 1995;85:2742–2746. [PubMed] [Google Scholar]
- [23].Armstrong L, Stojkovic M, Dimmick I, Ahmad S, Stojkovic P, Hole N, Lako M. Phenotypic characterization of murine primitive hematopoietic progenitor cells isolated on basis of aldehyde dehydrogenase activity. Stem Cells. 2004;22:1142–1151. doi: 10.1634/stemcells.2004-0170. [DOI] [PubMed] [Google Scholar]
- [24].Hess DA, Meyerrose TE, Wirthlin L, Craft TP, Herrbrich PE, Creer MH, Nolta JA. Functional characterization of highly purified human hematopoietic repopulating cells isolated according to aldehyde dehydrogenase activity. Blood. 2004;104:1648–1655. doi: 10.1182/blood-2004-02-0448. [DOI] [PubMed] [Google Scholar]
- [25].Pearce DJ, Taussig D, Simpson C, Allen K, Rohatiner AZ, Lister TA, Bonnet D. Characterization of cells with a high aldehyde dehydrogenase activity from cord blood and acute myeloid leukemia samples. Stem Cells. 2005;23:752–760. doi: 10.1634/stemcells.2004-0292. [DOI] [PubMed] [Google Scholar]
- [26].Lioznov MV, Freiberger P, Kroger N, Zander AR, Fehse B. Aldehyde dehydrogenase activity as a marker for the quality of hematopoietic stem cell transplants. Bone Marrow Transplant. 2005;35:909–914. doi: 10.1038/sj.bmt.1704928. [DOI] [PubMed] [Google Scholar]
- [27].Storms RW, Green PD, Safford KM, Niedzwiecki D, Cogle CR, Colvin OM, Chao NJ, Rice HE, Smith CA. Distinct hematopoietic progenitor compartments are delineated by the expression of aldehyde dehydrogenase and CD34. Blood. 2005;106:95–102. doi: 10.1182/blood-2004-09-3652. [DOI] [PMC free article] [PubMed] [Google Scholar]
- [28].Russo JE, Hilton J. Characterization of cytosolic aldehyde dehydrogenase from cyclophosphamide resistant L1210 cells. Cancer Res. 1988;48:2963–2968. [PubMed] [Google Scholar]
- [29].Levi BP, Yilmaz OH, Duester G, Morrison SJ. Aldehyde dehydrogenase 1a1 is dispensable for stem cell function in the mouse hematopoietic and nervous systems. Blood. 2009;113:1670–1680. doi: 10.1182/blood-2008-05-156752. [DOI] [PMC free article] [PubMed] [Google Scholar]
- [30].Marcato P, Dean CA, Pan D, Araslanova R, Gillis M, Joshi M, Helyer L, Pan L, Leidal A, Gujar S, Giacomantonio CA, Lee PW. Aldehyde dehydrogenase activity of breast cancer stem cells is primarily due to isoform ALDH1A3 and its expression is predictive of metastasis. Stem Cells. 2011;29:32–45. doi: 10.1002/stem.563. [DOI] [PubMed] [Google Scholar]
- [31].Amory JK, Muller CH, Shimshoni JA, Isoherranen N, Paik J, Moreb JS, Amory DW, Sr., Evanoff R, Goldstein AS, Griswold MD. Suppression of spermatogenesis by bisdichloroacetyldiamines is mediated by inhibition of testicular retinoic acid biosynthesis. J Androl. 2011;32:111–119. doi: 10.2164/jandrol.110.010751. [DOI] [PMC free article] [PubMed] [Google Scholar]
- [32].Moreb JS, Zucali JR, Ostmark B, Benson NA. Heterogeneity of aldehyde dehydrogenase expression in lung cancer cell lines is revealed by Aldefluor flow cytometry-based assay. Cytometry B Clin. Cytom. 2007;72:281–289. doi: 10.1002/cyto.b.20161. [DOI] [PubMed] [Google Scholar]
- [33].Moreb JS, Baker HV, Chang L-J, Amaya M, Lopez MC, Ostmark B, Chou W. ALDH isozymes downregulation affects cell growth, cell motility and gene expression in lung cancer cells. Mol. Cancer. 2008;7:87. doi: 10.1186/1476-4598-7-87. [DOI] [PMC free article] [PubMed] [Google Scholar]
- [34].Moreb JS, Gabr A, Vartikar GR, Gowda S, Zucali JR, Mohuczy D. Retinoic acid down-regulates aldehyde dehydrogenase and increases cytotoxicity of 4-hydroperoxycyclophosphamide and acetaldehyde. J. Pharmacol. Exp. Ther. 2005;312:339–345. doi: 10.1124/jpet.104.072496. [DOI] [PubMed] [Google Scholar]
- [35].Moreb JS, Muhoczy D, Ostmark B, Zucali JR. RNAi-mediated knockdown of aldehyde dehydrogenase class-1A1 and class-3A1 is specific and reveals that each contributes equally to the resistance against 4-hydroperoxycyclophosphamide. Cancer Chemother. Pharmaco. 2006;59:127–136. doi: 10.1007/s00280-006-0233-6. [DOI] [PubMed] [Google Scholar]
- [36].Moreb JS, Maccow C, Schweder M, Hecomovich J. Expression of antisense RNA to aldehyde dehydrogenase class-1 sensitizes tumor cells to 4-hydroperoxycyclophosphamide in vitro. J. Pharmacol. Exp. Ther. 2000;293:390–396. [PubMed] [Google Scholar]
- [37].Pappa A, Brown D, Koutalos Y, DeGregori J, White C, Vasiliou V. Human aldehyde dehydrogenase 3A1 inhibits proliferation and promotes survival of human corneal epithelial cells. J. Biol. Chem. 2005;280:27998–28006. doi: 10.1074/jbc.M503698200. [DOI] [PubMed] [Google Scholar]
- [38].Barth KS, Malcolm RJ. Disulfiram: an old therapeutic with new applications CNS Neurol. Disord. Drug Targets. 2010;9:5–12. doi: 10.2174/187152710790966678. [DOI] [PubMed] [Google Scholar]
- [39].Nebert DW, Puga A, Vasiliou V. Role of the Ah receptor and the dioxin-inducible [Ah] gene battery in toxicity, cancer, and signal transduction. Ann. NY. Acad. Sci. 1993;685:624–640. doi: 10.1111/j.1749-6632.1993.tb35928.x. [DOI] [PubMed] [Google Scholar]
- [40].Black WJ, Stagos D, Marchitti SA, Nebert DW, Tipton KF, Bairoch A, Vasiliou V. Human aldehyde dehydrogenase genes: alternatively spliced transcriptional variants and their suggested nomenclature. Pharmacogenet. Genomics. 2009;19:893–902. doi: 10.1097/FPC.0b013e3283329023. [DOI] [PMC free article] [PubMed] [Google Scholar]
- [41].Marchitti SA, Brocker C, Stagos D, Vasiliou V. Non-P450 aldehyde oxidizing enzymes: the aldehyde dehydrogenase superfamily. Expert Opin. Drug Metab. Toxicol. 2008;4:697–720. doi: 10.1517/17425250802102627. [DOI] [PMC free article] [PubMed] [Google Scholar]
- [42].Wang MF, Han CL, Yin SJ. Substrate specificity of human and yeast aldehyde dehydrogenases. Chem. Biol. Interact. 2009;178:36–39. doi: 10.1016/j.cbi.2008.10.002. [DOI] [PubMed] [Google Scholar]
- [43].Klyosov AA. Kinetics and specificity of human liver aldehyde dehydrogenases toward aliphatic, aromatic, and fused polycyclic aldehydes. Biochemistry. 1996;35:4457–4467. doi: 10.1021/bi9521102. [DOI] [PubMed] [Google Scholar]
- [44].Johansson B. A review of the pharmacokinetics and pharmacodynamics of disulfiram and its metabolites. Acta Psychiatr. Scand. Suppl. 1992;369:15–26. doi: 10.1111/j.1600-0447.1992.tb03310.x. [DOI] [PubMed] [Google Scholar]
- [45].Sládek NE, Rekha GK, Lee MJ, Nagasawa HT. Inhibition of ALDH3A1catalyzed oxidation by chlorpropamide analogues. Chem. Biol. Interact. 2001;138:201–215. doi: 10.1016/s0009-2797(01)00282-4. [DOI] [PubMed] [Google Scholar]
- [46].Canuto RA, Muzio G, Salvo RA, Maggiora M, Trombetta A, Chantepie J, Fournet G, Reichert U, Quash G. The effect of a novel irreversible inhibitor of aldehyde dehydrogenases 1 and 3 on tumour cell growth and death. Chem. Biol. Interact. 2001;130–132:209–218. doi: 10.1016/s0009-2797(00)00280-5. [DOI] [PubMed] [Google Scholar]
- [47].Overstreet DH, Knapp DJ, Breese GR, Diamond I. A selective ALDH-2 inhibitor reduces anxiety in rats. Pharmacol. Biochem. Behav. 2009;94:255–261. doi: 10.1016/j.pbb.2009.09.004. [DOI] [PMC free article] [PubMed] [Google Scholar]
- [48].Bunting KD, Townsend AJ. Protection by transfected rat or human class 3 aldehyde dehydrogenase against the cytotoxic effects of oxazaphosphorine alkylating agents in hamster V79 cell lines. Demonstration of aldophosphamide metabolism by the human cytosolic class 3 isozyme. J. Biol. Chem. 1996;271:11891–11896. doi: 10.1074/jbc.271.20.11891. [DOI] [PubMed] [Google Scholar]
- [49].Alexa K, Choe SK, Hirsch N, Etheridge L, Laver E, Sagerström CG. Maternal and zygotic aldh1a2 activity is required for pancreas development in zebrafish. PLoS ONE. 2009;4:e8261. doi: 10.1371/journal.pone.0008261. [DOI] [PMC free article] [PubMed] [Google Scholar]
Associated Data
This section collects any data citations, data availability statements, or supplementary materials included in this article.