Abstract
In this paper we discuss a deterministic regularization algorithm to handle the missing cone problem of three-dimensional optical diffraction tomography (ODT). The missing cone problem arises in most practical applications of ODT and is responsible for elongation of the reconstructed shape and underestimation of the value of the refractive index. By applying positivity and piecewise-smoothness constraints in an iterative reconstruction framework, we effectively suppress the missing cone artifact and recover sharp edges rounded out by the missing cone, and we significantly improve the accuracy of the predictions of the refractive index. We also show the noise handling capability of our algorithm in the reconstruction process.
1. INTRODUCTION
Diffraction tomography is an inverse scattering technique used to reconstruct a three dimensional object from a series of two dimensional measurements of the scattering field. The principle of diffraction tomography was proposed by Wolf in 1969 [1]. Based on the first Born approximation, he suggested a way to map 2-D scattering fields onto a 3-D frequency spectrum of the scattering potential. The Fourier diffraction theorem was later extended by Devaney [2] to adopt the first Rytov approximation. Recently, we have applied Fourier mapping based on the first Rytov approximation to the imaging of live biological samples [3]. This Fourier mapping is conceptually straightforward and fast, but the mapping of the 2-D scattering field onto 3-D rectangular coordinates requires an interpolation and induces an artifact. The filtered back-propagation method [4] resolves this problem, and is known to provide a better quality [5]. However, the filtered back-propagation is valid only within the Born approximation, and its 3-D application is quite involved. On the other hand, iterative reconstruction can overcome these limitations by iteratively updating a trial solution based on a scattering model and a priori knowledge about a sample. Iterative reconstruction has been applied to projection tomography that neglects diffraction effects [6–8] and then to diffraction tomography [9, 10] which Zunino et al. used to find the magnetization distribution in a buried layer from measurements of magnetic field at the surface [9]. Bronstein et al. applied it to suppress noise in broad-band ultrasound tomography [10]. For the optical regime, Belkebir and Sentenac presented an iterative method to retrieve the map of permittivity in transmission and total internal reflection microscopy [11], and Maire et al. applied the theory to highly scattering samples in a reflection configuration [12]. Belkebir et al. presented a full-vectorial nonlinear inversion scheme to retrieve the 3-D map of permittivity in total internal reflection microscopy [13]. The main benefits of iterative reconstruction come from the regularizing effect of the iterative process and the capability of incorporating various pieces of information about a sample such as maximum energy, piecewise smoothness, etc.
In this paper, we apply iterative reconstruction to 3-D optical diffraction tomography (ODT) and focus on the recovery of the missing cone. The missing cone originates from incomplete angular coverage of the incident beam and arises in most practical applications of diffraction tomography. The missing cone leads to elongation of the reconstructed shape along the optical axis and to underestimation of the refractive index [2]. It is worthwhile to note that rotating-sample tomography also suffers from the missing cone problem when the sample is rotated around one axis [14]. Iterative reconstruction without additional constraints has been called ART (algebraic reconstruction technique). Ladas and Devaney [15] showed that ART is capable of reconstructing a sample from a limited amount of data only insofar as the data are noise-free [5]. A recent overview of optical diffraction tomography principles can be found in Haeberlé et al [16].
2. ITERATIVE RECONSTRUCTION OF OPTICAL DIFFRACTION TOMOGRAPHY
In the real experiment, a collimated laser beam is delivered to the sample plane using a telescopic system, and the incident beam onto a sample can be approximated to a plane wave since only a small region near the center of the wave front is used [3, 17]. The interaction of the plane wave with a weakly scattering sample can be reasonably well described by the scalar theory [18]. A three dimensional object can be represented by the scattering potential [1],
| (1) |
where k = 2π/λ, λ is the wavelength of the incident beam in the medium, n(r⃗) is the complex refractive index, and n0 is the refractive index of the medium.
Under the first Born approximation, the measured field u(r⃗) and the scattering potential f(r⃗) have the following relationship:
| (2) |
in which uin(r⃗) is the incident field, and G(r⃗) = exp(ik|r⃗|)/|r⃗| is the Green’s function for the Helmholtz operator.
Under the first Rytov approximation [2],
| (3) |
As with other inverse scattering problems, optical diffraction tomography can be considered as a problem of minimizing the following functional:
| (4) |
in which Φμ(f;g) is the cost functional, α is a regularization parameter, J(f) is the penalty functional, f is the objective function to be reconstructed. An is the nth diffractive projection of f onto the plane z=0, and it provides 2-D scattering field of a 3-D object for the incident angle (uin(θn), vin(θn), win(θn)). gn is the measured scattering field, u(r⃗)/uin(r⃗))−1 in the first Born approximation, or gn is ln(u(r⃗)/uin(r⃗) in the first Rytov approximation.
There are several methods for choosing the regularization parameter α [19]. In our simulation, we have used α = 10−5, and it produced good results for various samples of different values of the refractive index (1.35 – 1.37). Equation (4) is minimized by the function fμ that can be found by the following iteration [20]:
| (5) |
in which τ is the relaxation parameter, and An† is the adjoint operator defined below.
The exact form of the penalty functional is determined by the kind of constraint used for the regularization. For example, the penalty functional for the Tikhonov regularization J(f) =1/2 ∫ |f|2 dV penalizes the energy of the objective function so that the optimized solution possesses minimal energy of noise [21]. Alternatively, the functional that penalizes the gradient of the objective function may be used to smooth out the noise while preserving the sharp edge. The so-called edge preserving regularization corresponds to using the piecewise smoothness constraint. Charbonnier et al. suggested criteria for the form of the penalty functional that will define an edge preserving regularization with guaranteed convergence to a solution [22]. Equation (6) shows an example satisfying those criteria; it will be used in this paper.
| (6) |
in which f is the objective function, dV is the volume element in space, , and β is an arbitrary, small number that prevents ψ′(t) from having a singular value at t=0.
In this paper the piecewise smoothness constraint is used together with the positivity constraint in a deterministic framework. In Gibb’s ringing, a sharp edge reconstructed from a spectrum of finite bandwidth displays an undershoot below the background amplitude. Similarly, the refractive index profile reconstructed from a finite bandwidth spectrum contains negative regions with the refractive index below that of the medium. Since the refractive index is proportional to the concentration of dry mass, the medium is assumed to have the smallest refractive index [23]. Hence, using this prior knowledge we can force those negative regions to have the same refractive index as the medium, and in this way we can introduce new information that may improve the overall image quality. We already showed the positivity constraint together with the Fourier mapping are capable of recovering the missing cone to some extent [3]. This use of the positivity constraint to retrieve out-of-band information is also known as the Gerchberg-Papoulis algorithm [24, 25]. Our interest here is to further improve the image by combining the piecewise smoothness constraint with the others in an iterative reconstruction framework. This edge preserving technique has been used for 2-D microwave tomography in the Bayesian framework [26]. In Assayo et al., a priori knowledge that a sample consists of a finite number of homogeneous regions has been incorporated by means of the Gauss–Markov–Potts model in the Bayesian framework [27]. However, in many applications, computation time is critical, so the deterministic strategy is preferable [22].
One can use the projection operator to incorporate the positivity constraint into the iterative reconstruction as follows:
| (7) |
in which DΩ is the band-limiting operator preserving only the components inside the frequency band Ω, D̄Ω is a complementary operator to DΩ preserving only components outside of the band, Ω is the frequency support of the measured spectrum, and P+ is the projection operator for the positivity constraint which is defined as P+fμ = fμ if fμ > 0, and 0 otherwise.
Using the Fourier diffraction theorem derived by Wolf, we define the forward operator for the 3-D optical diffraction tomography as follows:
| (8) |
in which f̃ is the Fourier transform of f, , W = w − win(θn), and .
For the adjoint operator An†, we define inner products as in Ladas & Devaney [28]:
| (9) |
in which X, Y are the Hilbert spaces of square integrable functions defined on
 and
and
 , respectively. Then, the adjoint operator An† satisfies the following relationship:
| (10) |
which can be calculated by
| (11) |
Finally, the composite operator in Eq. (5) may be simplified as follows:
| (12) |
Figure 1 summarizes the iterative reconstruction process described in this section. Once f(k) is calculated, we apply Eq. (7) to get f′(k) and calculate Eqs. (11) and (12) with f′(k).
Figure 1.
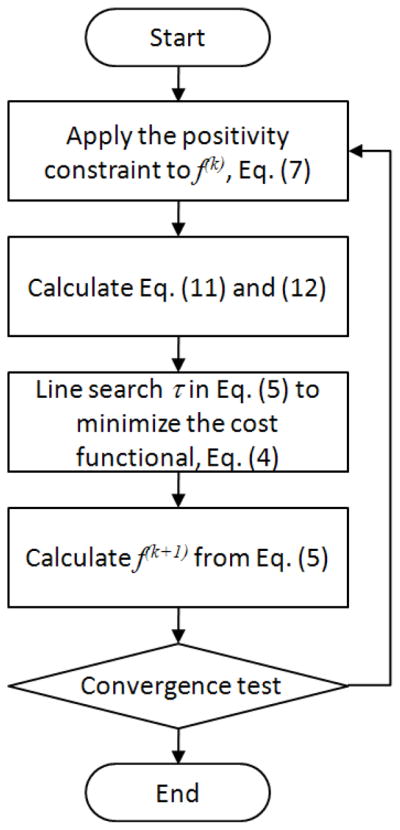
Flow chart for iterative reconstruction of optical diffraction tomography.
3. EDGE PRESERVING REGULARIZATION FOR THE NOISE REDUCTION
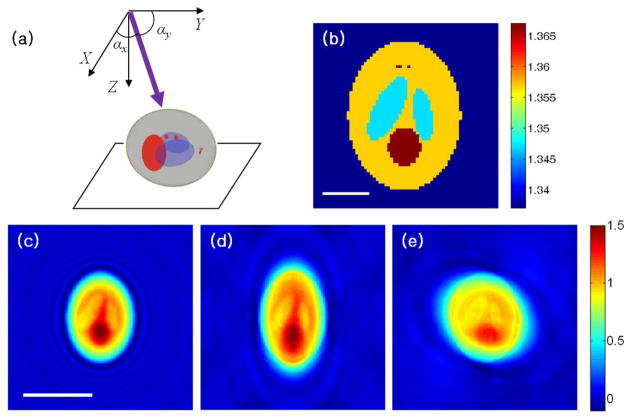
For the numerical simulation, we generate scattering fields by using the forward operator that is valid within the first Rytov approximation. As a sample we used a 3-D Shepp-Logan phantom [29] modified to have the real refractive index of usual biological samples (1.35 – 1.37) with negligible absorption. Fig. 2(a)–(b) shows the schematic of the set-up for the numerical simulation. In Fig. 2(a), z is the optical axis, and the thick, purple line represents the wave vector of the incident beam. Fig. 2(b) is the center cross-section of the 3-D phantom, and the color represents the refractive index value. Fig. 2(c)–(e) show scattering fields from the modified 3-D Shepp-Logan phantom for various illumination angles. The measurement plane is the center of the object, more exactly it is the image plane conjugated to the center of the object. For the reconstruction of the tomogram, 200 phase images were used for incident angles varying from 0° to 60° with respect to the optical axis. The numerical aperture for the detection is 60°, the same as for the illumination. Since the index of refraction of the phantom is real, the phase delay induced in the scattering field contains information about the sample.
Figure 2.
Modified 3-D Shepp-Logan phantom and its scattering fields calculated for various illumination angles: (a) 3-D rendered phantom with the wave vector of the incident wave shown as a thick, purple line, (b) center cross-section of the phantom refractive index, (c)–(e) scattered fields calculated for the incident angle of (c) αx = 90°, αy = 90°, (d) αx = 90°, αy = 49.5°, (e) αx = 51.5°, αy = 78.3°. Color bar for (c)–(e) indicates the phase delay in radian after the phase unwrapping. Scale bar for (b), 2 μm; scale bar for (c), 5 μm.
Now we introduce into the scattering fields some noise, the physical origin of which can be speckle, dust in the beam path, phase unwrapping error, etc. For example, Fig. 3(a) shows the same cross-section as Fig. 2(c) after being corrupted by Gaussian noise adjusted to have a noise level of the same order of magnitude as the signal. From the corrupted scattering fields, we try to reconstruct the original 3-D phantom first by the Fourier mapping and then by the iterative reconstruction with the edge preserving regularization. Fig. 3(b)–(c) show the center cross-section of the reconstructed 3-D refractive index map. In the Fourier mapping process, there can be an overlap in the frequency domain since the data are collected from various illumination angles. In such a case, we take the average, which helps to suppress the noise to some extent. For example, in Fig. 3(b) the boundary of internal structures is visible. This visibility is surprising considering the noise level in the scattering fields as in Fig. 3(a). Fig. 3(c) is the same cross-section as Fig. 3(b), but after the iterative reconstruction using the edge preserving regularization defined in Eq. (5). As the figure clearly shows, most of the noise in the scattering fields is suppressed, while the boundaries of the internal structure stay sharp. The noise handling capability of the edge preserving regularization was demonstrated by Bronstein et al. [10] in the 2-D diffracting field under the first Born approximation. However, here we show the edge preserving regularization can restore the absolute value of the 3-D refractive index, even when the scattering fields are corrupted by the same level of phase noise as the signal. In addition, our result is based on the first Rytov approximation, which is more appropriate for the optical imaging of biological samples [3].
Figure 3.
(a) An example of a scattering field corrupted with additive noise, (b) horizontal cross-section of the reconstructed 3-D image using direct mapping by the Fourier diffraction theorem, (c) horizontal cross-section of the reconstructed 3-D image by the iterative reconstruction with the edge preserving penalty. Scale bar, 2 μm.
4. MISSING CONE PROBLEM OF OPTICAL DIFFRACTION TOMOGRAPHY
In the coherent imaging of a 3-D object, only the limited information of a sample can pass through an optical system because of the Bragg condition and the finite numerical aperture. This is the reason we need to take several measurements at different illumination angles with respect to a sample. To make such measurements we could rotate a sample with the illumination beam fixed [14], or we could rotate the illumination beam with the sample fixed on a stage [3, 17]. For reconstruction, the former is more straightforward, but it is very difficult to rotate a sample in an accurately controlled manner, especially with the resultant perturbation to the sample. On the other hand, rotating the incident beam minimally perturbs a sample, and hence is more suitable for the high resolution imaging of a live biological sample. Murdy et al. showed that the axial resolution of a tomographic microscopy can be drastically improved by mounting the sample on a perfect mirror [30]. However, the isotropic resolution can be achieved only with complete angular coverage from −90° to 90° with respect to the optical axis. Such coverage is hard to achieve in most practical applications.
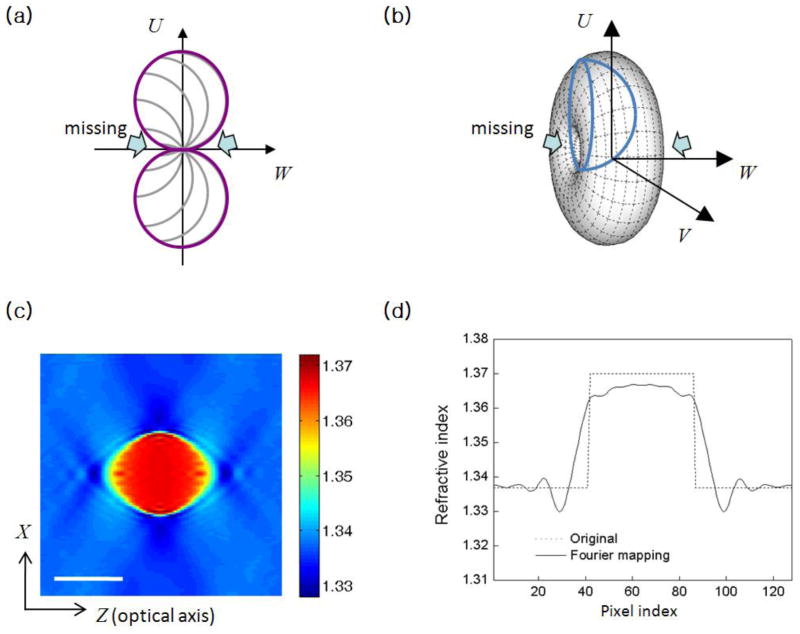
To analyze the imaging characteristics of ‘rotating-beam’ optical diffraction tomography, we examine the transfer function. Figs. 4(a) and (b) show the transfer functions for 2-D and 3-D optical diffraction tomography, respectively. Fig. 4(a) may be considered as the U-W cross section of the 3-D transfer function shown in Fig. 4(b). In this case the arcs in Fig. 4(a) represent the cross-sections of the Ewald sphere, the hemispherical surface, with the U-W plane in Fig. 4(b) for various illumination angles. It is important to note there exists a region that is not covered by the transfer function even with the maximum angular coverage of the incident beam, from −90° to 90° with respect to the optical axis. A similar missing cone occurs in ‘rotating-sample’ tomography when a sample is rotated with respect to one axis.
Figure 4.
(a) Transfer function of 2-D diffraction tomography and (b) 3-D diffraction tomography, (c) vertical cross-section of the reconstructed refractive index map using the Fourier mapping, (d) index profile of (c) along the dotted line. The sample used for the simulation is a homogeneous, spherical bead with the refractive index 1.37. (U,V,W) are the spatial frequency components corresponding to the spatial coordinates (X,Y,Z). Scale bar for (c), 5 μm.
Figs. 4(c) and (d) show how the missing cone affects the reconstruction of a homogeneous, spherical bead. In this simulation, the scattering field was generated by the same method as used in the 3-D Shepp-Logan phantom case, and the Fourier mapping was used for the reconstruction. The angular coverage is from −60° to 60°, which is about the maximum practically achieved with the high NA (1.4) oil immersion lens. Fig. 4(c) is the cross-section of the reconstructed bead within the plane containing the optical axis, and Fig. 4(d) is the refractive index profile along the optical axis. As expected from Gibbs ringing, the missing cone is responsible for the elongation of the reconstructed object along the optical axis direction. In addition, the refractive index of the bead is underestimated correspondingly.
The next section will show how in the iterative reconstruction framework additional constraints suppress these artifacts and improve the accuracy of the prediction of the refractive index. More specifically, we will use both the positivity constraint and the piecewise smoothness constraint for the reconstruction of several samples. It is important to note that these constraints can be used for any kind of sample without additional measurement.
5. RECOVERY OF MISSING CONE REGION
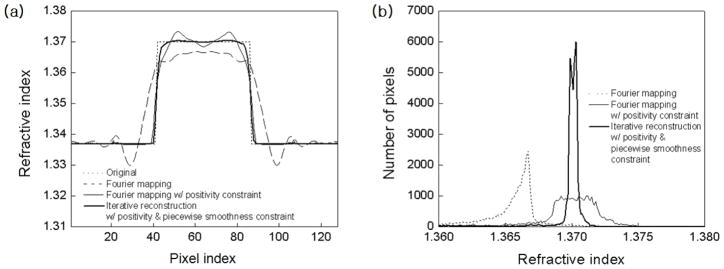
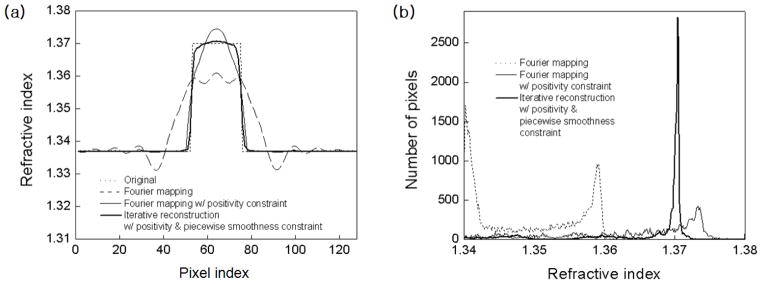
In this section, we apply the edge-preserving regularization to 3-D optical diffraction tomography, and show how it recovers the sharp edge smoothed by the missing cone and improves the accuracy of the prediction of the refractive index. Delaney & Bresler applied edge-preserving regularization to the missing cone problem of projection tomography for the case of a non-diffracting source [7]. They showed the edge-preserving regularization can recover edges that were smoothed out by the missing cone. For projection tomography, the reconstruction uses the inverse Radon transform, which assumes the incident field propagates rectilinearly within the sample [31]. This assumption is not valid in optical imaging of a biological sample because small organelles within the sample diffract the transmitted light. Therefore, projection tomography cannot be used for high-resolution, optical imaging of 3-D biological samples. For the case of the recovery of the sharp edge, we look at the refractive index profile along the optical axis. The index profile in the transverse direction is not affected by the missing cone, and it is sharp with two times better resolution than the diffraction limit [3]. For a more precise prediction of the refractive index, we introduce the refractive index histogram shown in Fig. 5(b). An ideal reconstruction of a homogeneous sample will provide a delta-function like peak, so the width of the broadened peak can be used to estimate the accuracy of the prediction.
Figure 5.
Simulation with a spherical bead: (a) comparison of index profile along the optical axis, (b) histogram of the 3-D refractive index map, which was reconstructed by various methods.
Let us consider as a sample a spherical bead with a homogeneous refractive index of 1.37, the same as in the previous section. Fig. 5(a) shows profiles of the refractive index along the optical axis after reconstruction by various methods. As observed before, for angular coverage from −60° to 60° the Fourier mapping provides an edge smoothed out approximately over the radius of the bead. The positivity constraint helps to recover the edge, but it induces a strong oscillation of the profile at the center of the bead. On the other hand, the iterative reconstruction together with the positivity and the piecewise smoothness constraint provide a sharp edge with noticeable reduction in the oscillation of the profile. Fig. 5(b) shows more dramatically how the missing cone artifact is reduced by additional constraints. In case of the Fourier mapping, the peak of the index histogram is formed near 1.367, an underestimate of the refractive index by 0.003. Because the refractive index of a biological sample usually differs from the culture medium by less than 0.03, this underestimate can be a significant error. The positivity constraint helps to increase the mean value almost to the original one, but the width of the peak, which is about 0.005, indicates the index prediction across the volume is still not accurate enough. However, iterative reconstruction, using the positivity and the piecewise smoothness constraints, provides a sharp peak centered at 1.37 with width less than 0.001. This result suggests that we can obtain a 3-D refractive index map with an accuracy of less than 0.001 using practically attainable angular coverage from −60° to 60°.
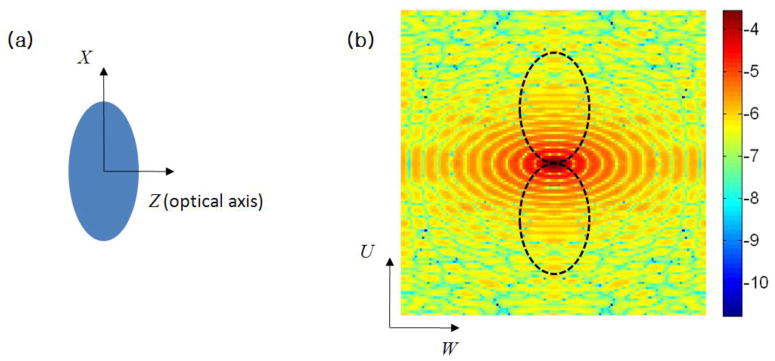
The missing cone artifact becomes more serious when a sample is squashed in the optical axis direction as in Fig. 6(a). As a result, the flattened sample has an elongated spectrum in the W direction as in Fig. 6(b), in which W is the spatial frequency corresponding to the optical axis, Z. The frequency support of the transfer function is fixed for a given angular coverage, while the elongated spectrum has more information missing.
Figure 6.
(a) A spherical bead squashed in the optical axis direction with the aspect ratio of 2 to 1, (b) spatial frequency spectrum of (a), in which the frequency support of the transfer function for the angular coverage from −60° to 60° is drawn as a dotted line. The color bar indicates the amplitude of the spectrum in the logarithmic scale with base 10.
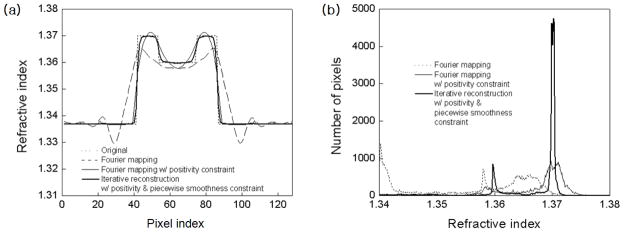
Fig. 7 shows refractive index profiles along the optical axis and corresponding index histograms of the squashed bead after reconstruction using various methods. As shown in Fig. 7(a), the edge of the squashed bead is smoothed out more broadly than the spherical bead, and the index histogram in Fig. 7(b) has a peak near 1.359 corresponding to an underestimate of 0.011. Interestingly, the index histogram has another peak near 1.34, which is an artifact caused by the missing cone. As for the spherical bead, the positivity constraint helps to recover the edge of the squashed bead. However, the index histogram predicts the refractive index of the squashed bead with 0.003 overestimate. In contrast, the iterative reconstruction used with the positivity and the piecewise smoothness constraints restores the edge more sharply, and predicts the refractive index within 0.001 accuracy.
Figure 7.
Simulation with a squashed bead in Fig. 6(a): (a) comparison of index profiles along the optical axis, (b) histograms of the 3-D refractive index map reconstructed by various methods.
It is important to note that the positivity constraint is given to the negative region mainly formed outside of a sample, while the piecewise smoothness constraint is given to the overall region. For this reason the smoothness constraint may be more effective than the positivity constraint in a non-homogeneous sample containing various internal structures. Consider a sample consisting of two regions of different refractive index as in Fig. 8. This configuration may be thought of as a simplified model of a biological cell with the inner part representing the nucleus.
Figure 8.
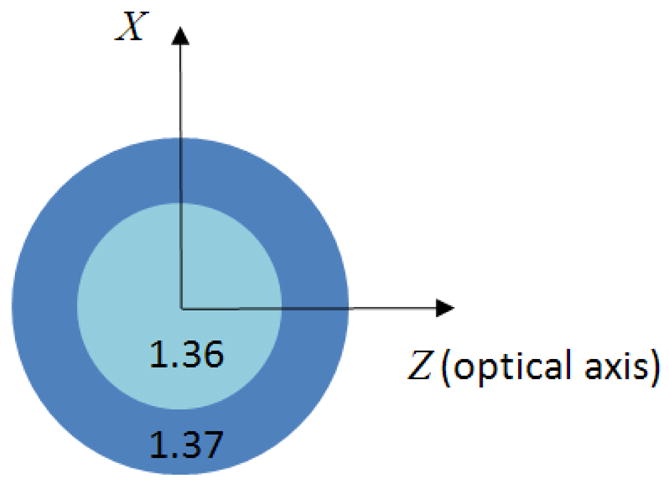
A non-homogeneous sample consisting of two regions of different refractive index. The numbers in the figure are the values of the refractive index.
Fig. 9 shows refractive index profiles along the optical axis and corresponding index histograms for the sample shown above. From the Fourier mapping, the reconstructed sample has two boundaries, both of which are smoothed out by the missing cone, and the index histogram shows a similar underestimation of the refractive index for both regions. In case of the Fourier mapping with the positivity constraint, the outer boundary is restored, while the inner boundary shows considerable deviation from the original one. From the index histogram, the refractive index of the outer region is increased to near 1.37 although with some broadened profile. However, the peak for the inner region is not clear, but vaguely indicates a value somewhere below 1.36. In contrast, the iterative reconstruction together with the positivity and the piecewise smoothness constraints restores the inner boundary as sharply as the outer one. What is more important, the index histogram indicates the refractive index for both regions is predicted within 0.001 accuracy. Since a biological sample consists of various organelles with different refractive indices, the piecewise smoothness constraint would be critical for the accurate prediction of the refractive index of internal organelles.
Figure 9.
Simulation with a non-homogeneous sample representing a biological cell: (a) comparison of index profiles along the optical axis, (b) histograms of the 3-D refractive index map reconstructed by various methods.
6. CONCLUDING REMARKS
In this paper, we have applied the deterministic regularization algorithm to 3-D optical diffraction tomography. By using constraints of piecewise smoothness and positivity as prior information, we are able to suppress both the missing cone artifact and noise. Using a practically attainable angular coverage from −60° to 60°, we are able to predict the refractive index to an accuracy within 0.001 irrespective of the shape of the sample. Using a simple model of a biological cell, we showed that the refractive index of internal organelles can be predicted with the same accuracy. Note that the regularization does not completely remove the ill-posedness of an inverse problem, but only helps to alleviate it. There is no doubt that more a priori information about a sample will generate more credible data in the region where no direct measurement is available. This algorithm will not work well with features that have gradual change in refractive index. For accurate imaging of such a sample, it needs to be rotated with respect to two axes which are orthogonal to the optical axis and to each other.
Acknowledgments
This work was funded by the National Center for Research Resources of the National Institutes of Health (P41-RR02594-18), the National Science Foundation (DBI-0754339) and Hamamatsu Corporation. The authors would like to thank Prof. Yoram Bresler and Dr. Iman Aganj for fruitful discussions through correspondence, and Ishan Barman and Prof. Charles H. Holbrow for proofreading the manuscript. Yongjin Sung is grateful for the support by a fellowship from the Kwanjeong Educational Foundation.
References
- 1.Wolf E. Three-dimensional structure determination of semi-transparent objects from holographic data. Optics Communications. 1969;1:153–156. [Google Scholar]
- 2.Devaney A. Inverse-scattering theory within the Rytov approximation. Optics Letters. 1981;6:374–376. doi: 10.1364/ol.6.000374. [DOI] [PubMed] [Google Scholar]
- 3.Sung Y, Choi W, Fang-Yen C, Badizadegan K, Dasari R, Feld M. Optical diffraction tomography for high resolution live cell imaging. Optics express. 2009;17:266–277. doi: 10.1364/oe.17.000266. [DOI] [PMC free article] [PubMed] [Google Scholar]
- 4.Devaney A. A filtered backpropagation algorithm for diffraction tomography. Ultrasonic imaging. 1982;4:336–350. doi: 10.1177/016173468200400404. [DOI] [PubMed] [Google Scholar]
- 5.Tsihrintzis G, Devaney A. Higher-order (nonlinear) diffraction tomography: reconstruction algorithms and computer simulation. Image Processing, IEEE Transactions on. 2002;9:1560–1572. doi: 10.1109/83.862637. [DOI] [PubMed] [Google Scholar]
- 6.Defrise M, De Mol C. A regularized iterative algorithm for limited-angle inverse Radon transform. Journal of Modern Optics. 1983;30:403–408. [Google Scholar]
- 7.Delaney A, Bresler Y. Globally convergent edge-preserving regularized reconstruction: an application to limited-angle tomography. Image Processing, IEEE Transactions on. 2002;7:204–221. doi: 10.1109/83.660997. [DOI] [PubMed] [Google Scholar]
- 8.Persson M, Bone D, Elmqvist H. Total variation norm for three-dimensional iterative reconstruction in limited view angle tomography. Physics in Medicine and Biology. 2001;46:853. doi: 10.1088/0031-9155/46/3/318. [DOI] [PubMed] [Google Scholar]
- 9.Zunino A, Benvenuto F, Armadillo E, Bertero M, Bozzo E. Iterative deconvolution and semiblind deconvolution methods in magnetic archaeological prospecting. Geophysics. 2009;74:L43. [Google Scholar]
- 10.Bronstein M, Bronstein A, Zibulevsky M, Azhari H. Reconstruction in diffraction ultrasound tomography using nonuniform FFT. Medical Imaging, IEEE Transactions on. 2003;21:1395–1401. doi: 10.1109/TMI.2002.806423. [DOI] [PubMed] [Google Scholar]
- 11.Belkebir K, Sentenac A. High-resolution optical diffraction microscopy. JOSA A. 2003;20:1223–1229. doi: 10.1364/josaa.20.001223. [DOI] [PubMed] [Google Scholar]
- 12.Maire G, Drsek F, Girard J, Giovannini H, Talneau A, Konan D, Belkebir K, Chaumet PC, Sentenac A. Experimental demonstration of quantitative imaging beyond Abbe’s limit with optical diffraction tomography. Physical review letters. 2009;102:213905. doi: 10.1103/PhysRevLett.102.213905. [DOI] [PubMed] [Google Scholar]
- 13.Belkebir K, Chaumet PC, Sentenac A. Superresolution in total internal reflection tomography. JOSA A. 2005;22:1889–1897. doi: 10.1364/josaa.22.001889. [DOI] [PubMed] [Google Scholar]
- 14.Charrière F, Marian A, Montfort F, Kuehn J, Colomb T, Cuche E, Marquet P, Depeursinge C. Cell refractive index tomography by digital holographic microscopy. Optics Letters. 2006;31:178–180. doi: 10.1364/ol.31.000178. [DOI] [PubMed] [Google Scholar]
- 15.Lada K, Devaney A. Iterative methods in geophysical diffraction tomography. Inverse Problems. 1992;8:119. [Google Scholar]
- 16.Haeberlé O, Belkebir K, Giovaninni H, Sentenac A. Tomographic diffractive microscopy: basics, techniques and perspectives. Journal of Modern Optics. 2010;57:686–699. [Google Scholar]
- 17.Choi W, Fang-Yen C, Badizadegan K, Oh S, Lue N, Dasari R, Feld M. Tomographic phase microscopy. Nature methods. 2007;4:717–719. doi: 10.1038/nmeth1078. [DOI] [PubMed] [Google Scholar]
- 18.Goodman J. Introduction to Fourier optics. Roberts & Company Publishers; 2005. [Google Scholar]
- 19.Bertero M, Boccacci P. Introduction to inverse problems in imaging. Taylor & Francis; 1998. [Google Scholar]
- 20.Piana M, Bertero M. Projected Landweber method and preconditioning. Inverse Problems. 1997;13:441. [Google Scholar]
- 21.Vogel C. Computational methods for inverse problems. Society for Industrial Mathematics; 2002. [Google Scholar]
- 22.Charbonnier P, Blanc-Feraud L, Aubert G, Barlaud M. Deterministic edge-preserving regularization in computed imaging. Image Processing, IEEE Transactions on. 2002;6:298–311. doi: 10.1109/83.551699. [DOI] [PubMed] [Google Scholar]
- 23.Barer R, Tkaczyk S. Refractive index of concentrated protein solutions. 1954. [DOI] [PubMed] [Google Scholar]
- 24.Gerchberg R. Super-resolution through error energy reduction. Journal of Modern Optics. 1974;21:709–720. [Google Scholar]
- 25.PAPOULIS A. A New Algorithm in Spectral Analysis and Band-Limited Extrapolation. IEEE TRANSACTIONS ON CIRCUITS AND SYSTEMS. 1975;22:735. [Google Scholar]
- 26.Baussard A, Belkebir K, Premel D. A markovian regularization approach of the modified gradient method for solving a two-dimensional inverse scattering problem. Journal of electromagnetic waves and applications. 2003;17:989–1008. [Google Scholar]
- 27.Ayasso H, Duchêne B, Mohammad-Djafari A. Bayesian inversion for optical diffraction tomography. Journal of Modern Optics. 2010;57:765–776. [Google Scholar]
- 28.Ladas K, Devaney A. Generalized ART algorithm for diffraction tomography. Inverse Problems. 1991;7:109. [Google Scholar]
- 29.Schabel M. MATLAB Central File Exchange. 2006. 3D Shepp-Logan phantom. [Google Scholar]
- 30.Mudry E, Chaumet P, Belkebir K, Maire G, Sentenac A. Mirror-assisted tomographic diffractive microscopy with isotropic resolution. Optics Letters. 2010;35:1857–1859. doi: 10.1364/OL.35.001857. [DOI] [PubMed] [Google Scholar]
- 31.Kak A, Slaney M. Principles of computerized tomographic imaging. 1988 [Google Scholar]


