Abstract
Phosphatidylserine (PS) embedded within supported lipid bilayers (SLBs) was found to bind Cu2+ from solution with extraordinarily high affinity. In fact, the equilibrium dissociation constant was in the femtomolar range. The resulting complex formed in a 1:2 Cu2+ to PS ratio and quenches a broad spectrum of lipid-bound fluorophores in a reversible and pH-dependent fashion. At acidic pH values, the fluorophores were almost completely unquenched, while at basic pH values significant quenching (85–90%) was observed. The pH at which the transition occurred was dependent on the PS concentration and ranged from approximately pH 5 to 8. The quenching kinetics was slow at low Cu2+ concentrations and basic values pH (up to several hours), while the unquenching reaction was orders of magnitude more rapid upon lowering the pH. This was consistent with diffusion limited complex formation at basic pH, but rapid dissociation under acidic conditions. The tight binding of Cu2+ to PS may have physiological consequences under certain circumstances.
INTRODUCTION
Phosphatidylserine (PS) lipids are found in a wide variety of cell types, but are typically only present in moderate abundance. In eukaryotic systems, they account for approximately 5–10 mol% of phospholipid content.1 Moreover, PS is unevenly distributed within cells. For example, it is enriched in the inner leaflet of the plasma membrane and depleted in the outer leaflet.1,2 It is essentially absent in mitochondrial membranes.1,3 A number of proteins interact specifically with PS and it is an important signaling molecule in clotting, apoptosis, and embryonic development.1,4–9 PS bears a negative charge at physiological pH and is known to form complexes with metal ions such as Ca2+, Mg2+ and Cu2+.10–12 These interactions are assumed to be relatively weak with equilibrium dissociation constants that have been generally measured in the mM range for Ca2+. The presence of Ca2+ mediates a number of protein-PS interactions and therefore the Ca2+-PS interaction has been relatively well studied.10,13–16 There have been far fewer investigations of Cu2+-PS interactions, although it is known that at mM concentrations Cu2+ forms a 1:2 complex with PS in solutions containing water, methanol, and chloroform.12
Cu2+ is necessary for the proper activity of various enzymes, but uncomplexed Cu2+ is toxic to cells.17,18 Indeed, in healthy cells the total copper ion concentration is generally around 100 μM, but the free copper ion concentration is so low that on average there is less than one free ion per cell.19 Thus, copper is tightly regulated with copper chaperones responsible for the delivery of copper ions to copper-binding enzymes and the vast majority of the copper delivery is in the form of Cu+.18,20 Excessive copper has been linked to Wilson’s disease and a number of medically relevant events are influenced by copper ions, including the outcome of vascular injury and the onset of prion disease.21,22 Cu2+ has also been proposed for use as an anti-tumor agent.23
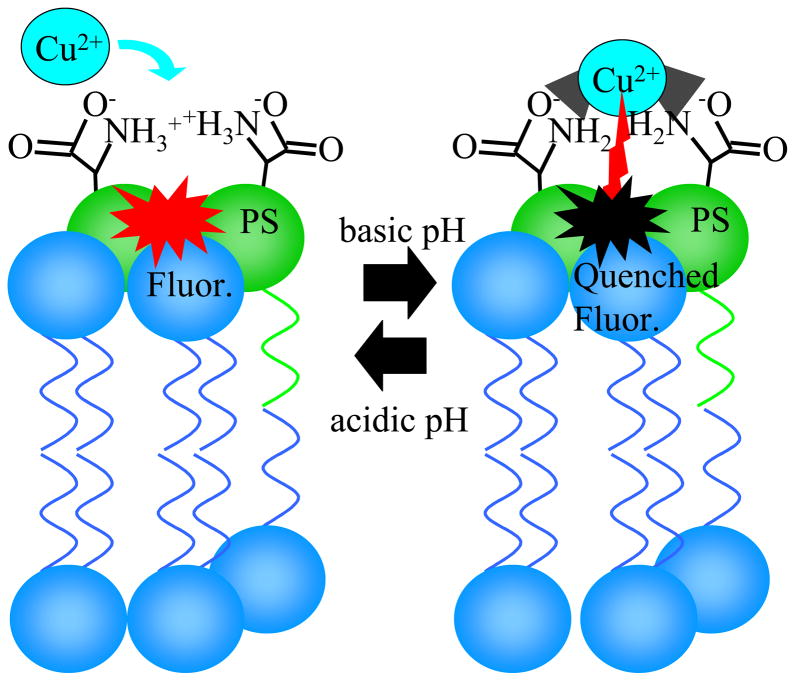
Using a fluorescence quenching assay, we report herein that PS binds Cu2+ with an equilibrium dissociation constant that is in the femtomolar range. The Cu2+-PS system forms a one metal ion to two PS lipid complex and is observed to quench a variety of lipid-bound fluorophores as illustrated schematically in Figure 1. Fluorescence quenching takes place at basic pH values and unquenching occurs under acidic conditions. The very tight 1:2 Cu2+-PS complex has a number of implications for biological processes. For example, the PS-enriched inner plasma membrane may serve as a Cu2+ scavenger or as a location for copper-dependent reactions at high environmental Cu2+ levels.
Figure 1.
The PS-mediated Cu2+ quenching reaction. At basic pH values, Cu2+ binds to 2 PS molecules and quenches nearby fluorophores (red to black in the diagram). The reaction can be reversed by lowering the pH.
EXPERIMENTAL SECTION
Vesicle Preparation
Phospholipid vesicles were prepared using the freeze-thaw/extrusion method.24,25 Lipids were mixed in chloroform at the desired ratio and then the chloroform was evaporated in a stream of N2 gas. The dried lipids were put under vacuum for at least four hours to remove any remaining solvent. The lipid mixture was rehydrated with Tris buffer (100 mM NaCl, 10 mM tris(hydroxymethyl)aminomethane, pH 7.4), subjected to ten freeze/thaw cycles in liquid nitrogen and warm water, and then extruded through a track etched polycarbonate membrane with 100 nm pores (Whatman, Florham Park, NJ). The vesicles were diluted to 1 mg/mL with Tris buffer and stored at 4°C until use. The average size of the vesicles was found to be 100 ± 20 nm by dynamic light scattering (90Plus Particle Size Analyzer, Brookhaven Instrument Corp., Holtsville, NY).
Glass Cleaning
Glass coverslips (Corning, Inc., Corning, NY, 24 x 40 mm No. 1.5) were cleaned by boiling in a 1:5 solution of 7X (MP Biomedicals, Solon, OH) and purified water. The slides were extensively rinsed with 18 MΩ water (Barnstead Nanopure water purification system, Thermo Scientific), blown dry with filtered air, and annealed at 530°C for five hours.26
Microfluidic Fabrication
Microfluidic devices were fabricated from polydimethylsiloxane (PDMS, Sylgard 184, Dow Corning, Midland, MI) and clean glass coverslips using previously reported procedures (Figure S1).26 Briefly, HF etching was performed on a glass plate protected by photolithographically patterned photoresist (Microposit S1813, Shipley Corp., Marlborough, MA) to form a master. PDMS was mixed in a 10 part base to 1 part polymerizer mass ratio, degassed under vacuum for 1 hour, poured over the master, and baked at 100 °C for 2 hours. Access holes were punched with a polished needle. The devices were assembled by pressing together an oxygen plasma-cleaned PDMS body and an oxygen plasma-cleaned glass cover slip and heating to 100 °C for 1 minute.
Bilayer Formation
SLBs were formed via the vesicle fusion method.27–29 Fourteen microliters of vesicle solution were injected via a pipette into each channel of a freshly prepared microfluidic device. In all runs, the largest lipid component of the vesicles was 1-palmitoyl-2-oleoyl-sn-glyero-3-phosphocholine (POPC, Avanti Polar Lipids, Alabaster, AL). A fluorescent lipid was also present, typically Texas Red 1,2-dihexadecanoyl-sn-glycero-3-phosphoethanolamine (TR-DHPE, Invitrogen, Carlsbad, CA) at either 0.1 or 1.0 mol% along with 0 to 30 mol% PS. 1,2-dioleoyl-sn-glycero-3-phospho-L-serine (DOPS, Avanti Polar Lipids, Alabaster, AL) was the PS species used in all experiments unless otherwise noted. The vesicles spontaneously fused to the cleaned glass slides to form continuous SLBs. After a thirty minute incubation time, the channels were rinsed by gravity driven buffer flow for one hour to remove any remaining vesicles and experiments were subsequently commenced.
Microfluidic Procedure
A flow splitter was used to change the buffer and sequester any bubbles introduced during buffer exchanges before they could reach the microfluidic device. The flow splitter consisted of a small (<1 mL) solution chamber in a PDMS slab sealed between two glass slides with 4 to 9 tubes (0.6 mm internal diameter Teflon tubing, SPC Technology) coming from it (Figure S2). The total number of tubes determined the total number of fluidic channels that could be employed. A buffer supply tube brought buffer from a reservoir to the device and a drain tube flowed to a waste container during buffer exchange. Up to seven supply tubes provided buffer to the individual microfluidic channels of the PDMS/glass platform. Flow through the device was gravity driven with an average flow rate on the order of 200 μL/hour in each microfluidic channel. The total buffer consumption rates were on the order of 10 mL/hour when the buffer was being exchanged. The consumed buffer drained to a waste container during buffer exchanges. Tris, phosphate, and citrate buffers were tested to ensure the independence of the observed quenching reaction by specific buffers. Similar behavior was observed with each buffer.
For the flow cell experiments shown in this work, a universal buffer consisting of a 2:1:2 molar ratio of sodium citrate:MES (2-(N-morpholino)ethanesulfonic acid):Tris was used.30 The buffer was adjusted to the desired pH value with NaOH and HCl. Most buffers were run at 1 mM total buffer concentration with only trace amounts of CuSO4 and no other salts present. Buffers with 100 mM NaCl along with the buffering agents were also tested and found to behave identically to those with no salt. CuSO4 and CuCl2 salts were both tested as sources of Cu2+ and no difference was observed in the quenching reaction. Buffer was constantly flowed through the channels during all experiments. When the buffer reservoir solution was exchanged, there was a lag time of a few minutes before the fluorescence intensities inside the microchannels began to change. This was due to the dead volume in the tubing between the flow splitter and the microfluidic device. For this reason the length of the tubing between the splitter and the device was kept relatively short (~5 cm). The fluorescence of the channels was intermittently observed until equilibrium was reached. When low CuSO4 concentrations were employed (pM and below), several hours were required for equilibrium to be established.
Vesicle Titration Measurements
Fluorescence measurements at constant Cu2+ concentrations were recorded in a QE 65000-FL Scientific Grade Spectrometer with a DH-2000 Deuterium Tungsten Halogen Light Source (Ocean Optics, Dunedin, FL). The lipid mixture with 1 mol% TR-DHPE and 15 mol% DOPS in POPC was mixed in chloroform and dried with flowing N2 and vacuum. It was then rehydrated with Tris/NaCl buffer (10 mM Tris, 100 mM NaCl, pH 7.4) containing serial concentrations of CuSO4 ranging from 0 to 43 μM. This was followed by ten freeze/thaw cycles in liquid nitrogen and warm water. Finally, the vesicles were extruded through a track etched polycarbonate membrane with 100 nm pores (Whatman, Florham Park, NJ), which should distribute the CuSO4 both inside and outside the vesicles, which is important to insure that fluorophores on both leaflets can be accessed by Cu2+. Fluorescence measurements were performed with 1.5 mL aliquots of these 100 nm vesicle solutions at 0.17 mg/mL.
RESULTS
Cu2+-PS Binding in Flowing Buffer inside Microfluidic Channels
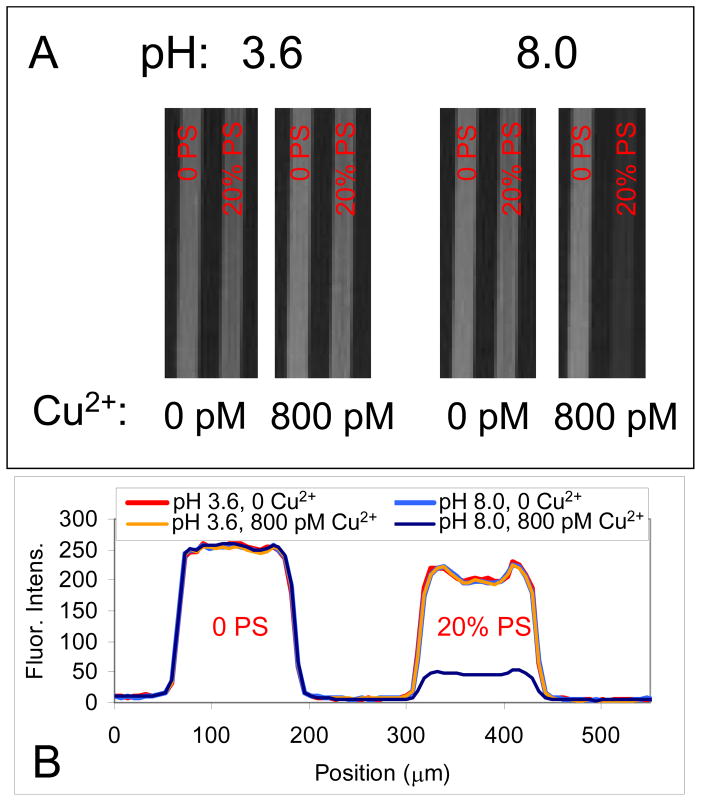
In a first set of experiments, fluorescence imaging of supported lipid bilayers was performed in two parallel microfluidic channels. The bilayers contained 0.1 mol% TR-DHPE and were interrogated at pH 3.6 and 8.0 in the presence and absence of 800 pM CuSO4 (Figure 2). The left channel of each channel pair contained no PS, while the right channel had 20 mol% PS in the bilayer. As can be seen, the fluorescence intensity was uniform under most conditions. However, in the presence of both PS and Cu2+ the fluorescent response of the TR-DHPE was quenched by a factor of 5 under basic conditions. If any one of the three necessary components (PS, Cu2+, and basic pH) for quenching were missing, very little or no quenching was observed. As will be explored below, the quenching was the result of Cu2+-PS complex formation, as illustrated in Figure 1. The complex localized Cu2+ near the bilayer surface, which in turn quenched the fluorophore.
Figure 2.
(A) Fluorescence images and (B) line scans from microfluidic devices when no DOPS (left channel) and 20 mol% DOPS (right channel) were present in SLBs along with 0.1 mol% TR-DHPE. The fluorescence is shown in the presence and absence of 800 pM CuSO4 at both pH 3.6 and 8.0 with 1 mM citrate/MES/Tris buffer. The increased fluorescence intensity observed on the sides of the channels in the line scans with the 20 mol% DOPS channel is an edge effect from where the glass floor of the microchannels met the PDMS walls.31
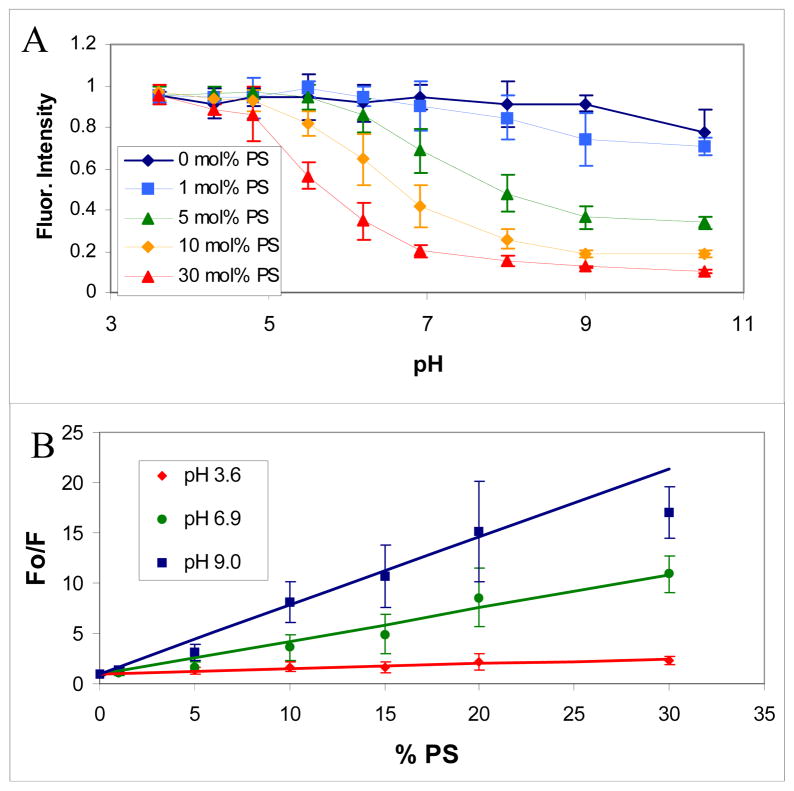
To explore the pH response of this process, the pH of the buffer flowing over the SLBs was varied between pH 3 and pH 10 with 800 pM CuSO4 and the DOPS concentration in the SLBs was varied from 0 to 30 mole percent (Figure 3A). Each data set was normalized to its own maximum intensity over the pH range to better illustrate the pH at which the fluorescence began to be quenched at a given amount of DOPS. The midpoint of the titration curve occurred near pH 5.5 when 30 mol% DOPS was present. This titration point shifted to higher pH and became much less pronounced as the concentration of DOPS was lowered. Also, at a given pH, increasing the amount of PS in the SLB increased the quenching that occurred.
Figure 3.
The Cu2+-PS quenching response as a function of pH and PS concentration. In (A) the fluorescence intensity is shown as a function of pH. In (B) a Stern-Volmer plot of the data is shown at pH 3.6, 6.9, and 9.0. Both plots are for SLBs consisting of 1.0 mol% TR-DHPE and 0 to 30 mol% DOPS in POPC with a 1 mM citrate/MES/Tris buffer and 800 pM Cu2+.
The dye employed in these experiments, TR-DHPE, consisted of ortho and para isomers. The ortho dye, which is usually no more than a quarter of the mixture, is reversibly quenched at basic pH values.31 This fact accounts for the small decrease in fluorescent signal observed at pH 10.5 even in the absence of any DOPS in the membrane. Moreover, it should be noted that dequenching occurred above pH 11. This is due to the formation of a copper hydroxide complex, most likely Cu(OH)42−.32
Stern-Volmer plots of the data in Figure 3A show nearly linear dependence as the DOPS concentration was increased until at least 20 mol% DOPS (Figure 3B). Fo was the fluorescence intensity when no quencher was added and F was the observed fluorescence intensity at the indicated quencher concentration. In this and subsequent figures, the error bars represent the standard deviation of multiple measurements. The fluorescence increase became somewhat nonlinear above 20 mol% DOPS at pH 9.0. This may be because essentially all of the TR-DHPE molecules could already be quenched with just 20 mol% DOPS. The quenching constant (slope of the line) increased with increasing pH, but even at relatively acidic pH values there was modest quenching of the TR-DHPE. Of course, the degree of quenching can also be seen to diminish as the DOPS concentration was lowered, which is consistent with a greater average distance between Cu2+-PS complexes and TR-DHPE molecules under these conditions. Control experiments using UV-visible spectroscopy demonstrated that quenching occurred under conditions where the adsorption of the fluorophore neither shifted nor attenuated (Figure S3). As such, a dynamic rather than a static quenching mechanism should be involved.33,34
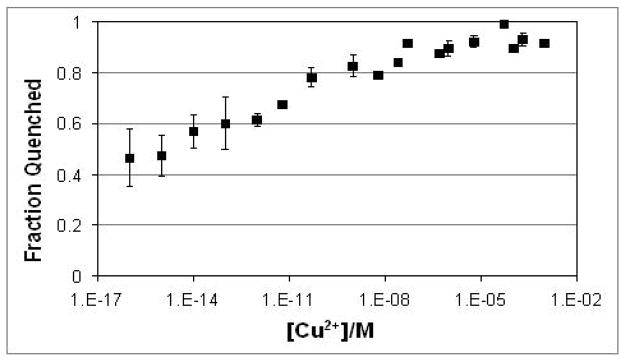
The above quenching behavior stands in stark contrast to that observed when the experiments were repeated as a function of CuSO4 concentration at pH 8 and 20 mol% DOPS (Figure 4). In that case, the quenching was nearly unchanged over 7 orders of magnitude in bulk Cu2+ concentration. This unusual behavior underlines the fact that while Cu2+ is necessary for quenching, it is Cu2+ in the form of a Cu2+-PS complex. As can be seen, DOPS concentrations of 1 mol% or greater were required to observe substantial quenching (Figure 3a), while very low concentrations of Cu2+ were sufficient to observe quenching. The requirement for higher DOPS concentrations was likely a consequence of the change in the average distance between Cu2+ and the fluorophore as the PS concentration was modulated. On the other hand, the need for only trace Cu2+ was evidence for an extremely tight Cu2+-DOPS complex (Figure 4).
Figure 4.
The quenching response as a function of Cu2+ concentration. The fraction of dye that was quenched (1 minus the normalized intensity) is shown as a function of Cu2+ concentration. The SLBs consisted of 0.1 mol% TR-DHPE and 20 mol% DOPS in POPC. The buffer consisted of 1 mM citrate/MES/Tris at pH 8.0 and the data were normalized versus the fluorescence response from 1 mM citrate/MES/Tris buffer at pH 3.6.
The quenching measurements were made at ten-fold CuSO4 concentration increments in the low concentration regime. As can be seen, the data points with 0.1, 1.0, 10, and 100 fM CuSO4 had larger error bars than were obtained at higher concentrations. These lowest concentration measurements reached equilibrium within ~15 hours and the quenching was completely reversible upon lowering the pH to 3.6. It should be noted, however, that trace Cu2+ contamination may exist even in purified water or buffer salts. ICP-MS was used to verify the purity of these solutions, but the instrument had a detection limit of 10 fM (see supporting information, Table S1). As such, the total Cu2+ concentration (added CuSO4 plus background) was less certain and may fluctuate under the lowest concentration conditions. It can be stated with high confidence, that the TR-DHPE was largely quenched when the Cu2+ concentration was in the mid pM range. Moreover, the signal dequenched monotonically as ever smaller Cu2+ concentrations were introduced in the femtomolar. As such, the equilibrium dissociation constant should be in the femtomolar range, although an exact value was difficult to determine with certainty (Figure S4).
Results at Fixed Total Cu2+ Concentrations
In the microfluidic experiments discussed above, a continual flow of buffer above the SLBs ensured that a constant Cu2+ concentration was maintained in the bulk solution even as Cu2+ bound to the DOPS lipids. In the next set of experiments, measurements were performed with bulk vesicle solutions in cuvettes to determine the quenching behavior as the DOPS was titrated with a fixed amount of Cu2+ (Figure 5). In these experiments, the added Cu2+ was consumed to form Cu2+-DOPS complexes and thus the fluorescence response decreased as a function of time before leveling off. The data were obtained at multiple CuSO4 concentrations in well mixed solutions.
Figure 5.
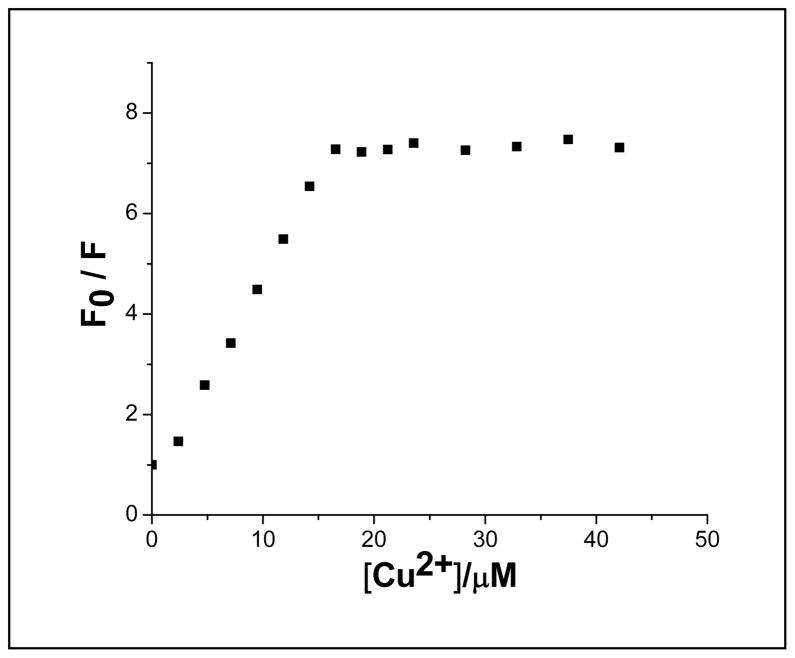
A Stern-Volmer plot of a Cu2+ titration of POPC vesicle solutions containing 15 mol% DOPS and 1 mol% TR-DHPE. 10 mM Tris buffer containing 100 mM NaCl at pH 7.4 was used and the indicated amount of CuSO4 was added during vesicle extrusion.
CuSO4 solution was added to aqueous solutions containing 100 nm vesicles with 15 mol% DOPS and 1 mol% TR-DHPE at pH 7.4. The total lipid concentration was 0.17 mg/ml; hence, the DOPS concentration was approximately 33 μM. Monitoring the extent to which the fluorescence was ultimately quenched as a function of CuSO4 concentration produced a nearly linear rise in the Stern-Volmer plot at lower Cu2+ concentrations before reaching a plateau as the concentration was further increased (Figure 5). The crossover between these regimes occurred at about 16 μM CuSO4. This concentration represented a Cu2+ to PS ratio of approximately 1 to 2. In addition to the Stern-Volmer data, a Job’s plot analysis confirmed the 2 to 1 ratio (Figure S5).
The formation of a 1:2 complex is in good agreement with previous spectroscopic and titration data with PS lipid and small molecule systems.12,35,36 For example, a 1:2 complex has been shown to be formed between Cu2+ and O-phospho-L-serine and in bulk aqueous solutions at basic pH values.36 EPR data from that system matched similar data taken with 15 mol% DOPS in POPC vesicles with a saturation concentration of CuSO4 (Figure S6). Analogous CuL2 complexes with amino acids have also been reported.37 As such, the Cu2+-PS binding likely involves the amine and carboxylic acid groups of two PS molecules and results in the deprotonation of the amine. Indeed, the dequenching observed in Figure 3a does not simply correlate with previously reported pKa values of PS.38 It should also be noted that in previous studies, the Cu2+-PS complex was studied at μM or mM concentrations of Cu2+. Such high Cu2+ concentrations often gave rise to double bond oxidation when unsaturated lipids were employed.35,39
pH Driven Reversibility of the Quenching Process
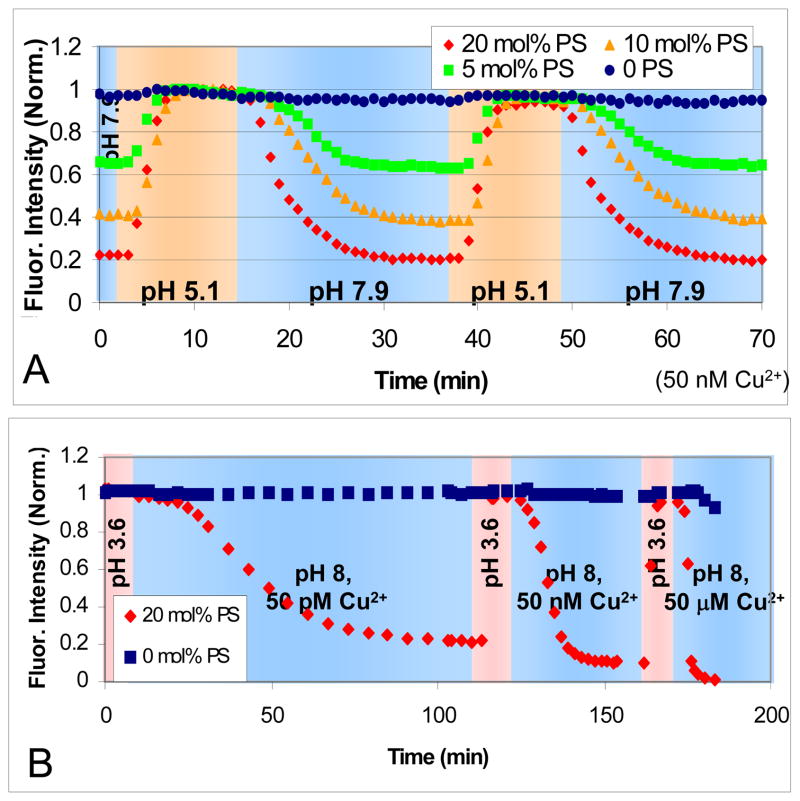
In a next set of experiments, the reversibility of the 1:2 Cu2+-DOPS complex in SLBs was explored as a function of pH in microfluidic channels with continuous buffer flow. Figure 6A shows the response of four different DOPS concentrations ranging from 0 to 20 mol% in POPC bilayers with 0.1 mol% TR-DHPE as the pH was varied in buffers that contained 50 nM CuSO4. The fluorescence was initially low after rinsing at pH 7.9 for bilayers containing PS. The intensity rose when the pH was reduced to 5.1. It could then be raised and lowered reversibly by modulating the pH of the bulk solution. The fluorescence intensity of each channel was normalized to its own maximum value to facilitate comparisons among the various DOPS concentrations. The quenching was highly stable and reproducible. The light exposure was kept sufficiently low such that photobleaching was relatively minor in these experiments.
Figure 6.
In (A) the fluorescence intensity of 0, 5, 10, and 20 mole percent PS is shown as the pH was alternated between pH 5.1 (orange background) and 7.9 (blue background) in 1 mM citrate/MES/Tris with 50 nM Cu2+. (B) Experiments in which different concentrations of CuSO4 solution were tested at pH 3.6 (pink background) and 8.0 (blue background) with 50 pM, 50 nM, and 50 μM levels of CuSO4. The SLBs consisted of 0.1 mol% TR-DHPE in POPC at the labeled DOPS concentration. The buffer was 1 mM citrate/MES/Tris.
As can be seen, the fluorescence quenching rate was much slower than the de-quenching process, which typically took only a few minutes. Such results are consistent with the notion that the Cu2+-DOPS complex formation rate is slow and probably limited by a PS diffusion process required for the one ion, two lipid complex to form. On the other hand, when the pH was lowered, the complex quickly broke up as the protonation of the negatively charged DOPS molecules was rapid. The rate of dequenching upon acidification was limited by the rate at which the pH of the buffer solution could be changed within the microfluidic device. To further investigate the complex formation process, pH jump experiments were performed as a function of CuSO4 concentration (Figure 6B). As can be seen, the formation rate was significantly attenuated at the lowest Cu2+ concentration. Indeed, the quenching took approximately 2 hours to come to completion when only 50 pM CuSO4 was employed. By contrast, the unquenching reaction was essentially independent of Cu2+ concentration. Again, the finite time it took to measure unquenching was related to the time it took to replace the buffer in the channels.
It should be noted that at 50 μM CuSO4 some quenching was observed even when PS was absent (Figure 6B, blue data points). This most likely occurred because Cu2+ concentrations in the μM range were sufficiently high to result in some direct fluorophore-ion interactions without the need for the mediation of the Cu2+-DOPS complex. Another possible source of fluorophore quenching may be the Cu2+-catalyzed generation of reactive oxygen species.40 This should result in permanent quenching independent of pH or Cu2+ concentration. Indeed, some permanent quenching was observed when the CuSO4 concentration was raised to μM or mM levels, and the degree of irreversible quenching was observed to increase with time. However, below 1 μM Cu2+, only reversible quenching and a very small amount of photobleaching were observed.
Quenching by Other Divalent Metal Ions
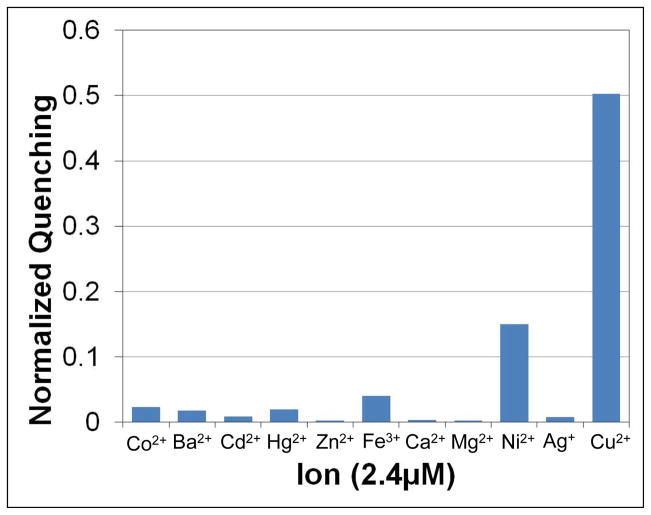
In a penultimate set of experiments, we wished to explore the specificity of the quenching process to the identity of the cation. Heavy metal ion quenching of fluorophores is a common phenomenon, and thus other divalent cations as well as Ag+ were tested for their ability to bind PS and quench the TR-DHPE fluorophore. The results of these experiments are shown in Figure 7. 2.4 μM of each metal ion was added to solutions of vesicles containing 1 mol% TR-DHPE, 15 mol% DOPS, and 84 mol% POPC and the resulting quenching was monitored. In all cases, the metal ion was added as a chloride salt except Ag+, which was added as a nitrate salt. As can be seen, Cu2+ was the strongest quencher tested, although Ni2+ showed some quenching ability. It should be noted, however, that quenching by Ni2+ only occurred at high ion concentrations compared with Cu2+.
Figure 7.
The quenching of TR-DHPE with various divalent metal chlorides and AgNO3. The experiments were performed at pH 7.4 with 1 mM Tris and 100 mM NaCl.
In additional microfluidic experiments, it was found that when 50 μM Ca2+ or Cd2+ were introduced after 950 pM Cu2+, the fluorescence intensity was observed to increase slightly, perhaps because these ions were able to displace some Cu2+ already bound to the PS. Thus, it would appear that an ion has to meet two criteria to induce PS-mediated quenching. First, the ion has to form a complex with PS, as does Cu2+, and to a lesser extent Ni2+, Cd2+ and Ca2+. Second, the ion has to quench the fluorophore, as do Cu2+, Ni2+, Sr2+, and Co2+.34 Since only Cu2+ and Ni2+ fulfill both criteria, they are the only two ions tested that generated appreciable PS-mediated quenching. It should be noted that Fe3+ was also tested, but it was found to only moderately quench TR-DHPE regardless of the presence or absence of PS under acidic or basic conditions. This modest quenching was presumably due to direct ion-fluorophore interactions (see Figure S7 for control experiments of direct ion-fluorophore quenching, which was generally found to occur at mM salt concentrations).
Other Fluorophores and PS Molecules
Finally, to ensure that quenching was specific to PS and general to a wide number of fluorophores, various negatively charged lipids and fluorophores were tested for pH-dependent quenching (see Table S2 for a summary of the fluorophores and lipids tested). All PS lipids tested (DLPS, DOPS, and DPPS) quenched lipid conjugated fluorophores in the presence of Cu2+, but no other negatively charged lipids tested (PG, PA, GM1, and cardiolipin) produced any significant quenching. Moreover, the quenching kinetics of DPPS was tested and found to be identical to that of DOPS within experimental error (Figure S8).
Fluorescence quenching was also monitored in the presence of DOPS and 800 pM Cu2+ for 1 mol% 16:12 tail group-labeled NBD PC, 16:12 tail group-labeled NBD PS, 1 mol% 18:1 head group-labeled NBD PS, 1 mol% rhodamine-DHPE, 2 mol% fluorescein-DHPE, 0.5 mol% bodipy-DHPE, as well as at TR-DHPE concentrations from 0.1 to 5 mol% (complete names of fluorophores provided in supporting information, Table S2). DOPS concentrations of 0, 5, and 15 mol% were employed. All systems tested showed the same quenching phenomenon. Moreover, the normalized Cu2+-PS quenching from 1.0 mol% TR-DHPE was found to be essentially identical with 0.1 mol%, as was the quenching of head group-labeled lipids and tail-labeled lipids. By contrast, fluorophores attached to membrane-bound proteins showed no Cu2+-PS quenching (Figure S9), presumably because the fluorophore was too distant from the Cu2+-PS complex for quenching to occur. Even a rhodamine labeled bactenecin derivative (Rh-AAARRWKIVVIRWRR, a membrane associated anti-microbial peptide, where the initial three alanines are β-alanine and the C-terminus is amidated), showed almost no Cu2+-PS quenching, despite its small size and known ability to partition into lipid bilayers.41 Thus, Cu2+-PS quenching is highly specific to lipid-conjugated fluorophores, which presumably have the appropriate in-plane geometry with the Cu2+-PS complex to afford quenching.
DISCUSSION
The very tight 1:2 Cu2+-PS complex observed in this work may have a number of biological implications. Given the concentrations of PS (variable, but generally μM to low mM)1 and Cu+/Cu2+ (also variable, but ~100 μM is often noted in the literature)19 found in cells and the tight binding observed in this work, it seems reasonable that at least under some conditions Cu2+ could exist in 1:2 Cu2+-PS complexes in vivo. The distribution of both copper and PS in various cell and tissue types are often seen to roughly track one another, both being present in relatively high concentrations, for example, in human brain tissue.42,43 Thus, increased PS may serve to complex and neutralize otherwise reactive Cu2+ in tissues that experience high Cu2+ concentrations. This complexation ability may be particularly important in mitigating copper poisoning. Alternatively, PS may attract Cu2+ to tissues that require greater quantities of Cu2+, although this seems less likely as Cu+ should be the dominant species involved in copper ion transport.18 The 1:2 Cu2+-PS complex may also provide insight into observations that copper ions and PS both play roles in many biological processes, such as fibril formation in neurodegenerative diseases and wound healing.21,22
As noted above, PS is known to bind a number of different metal ions. Ca2+-PS interactions have been the most extensively studied. These interactions are generally believed to involve high μM to low mM range equilibrium dissociation constants.10–12 This interaction mediates a number of different protein-PS interactions, specifically the membrane binding of C2 domain proteins, annexin proteins, and γ-carboxyglutamic acid domain proteins such as prothrombin. Thus, it seems reasonable that the observed 1:2 Cu2+-PS complex might also be involved (interfere or aide) in PS-protein interactions even in the presence of trace Cu2+ concentrations.
In addition to other roles, Cu2+ may also be involved in oxidation reactions. However, the quenching of fluorophores observed in the present experiments was almost perfectly reversible as illustrated by Figure 6. As oxidation is largely observed at relatively high Cu2+ concentrations, it may be possible that at trace Cu2+ concentrations, 1:2 Cu2+-PS complexes help to mitigate Cu2+ mediated oxidation. On the other hand, at higher Cu2+ concentrations, the complex should become saturated and excess Cu2+ may mediate oxidation. This is at least consistent with the present studies in which the employment of Cu2+ in the μM regime in a microfluidic setup at neutral or basic pH, irreversibly quenched the fluorophores (Figure 6B). It should be noted, however, that the high Cu2+ concentrations required to saturate the 1:2 Cu2+-PS complexes are well outside the normal physiological range for common cells and tissues.
Supplementary Material
Acknowledgments
We thank Professor Marcetta Darensbourg (Texas A&M University) for useful discussions, Professor Paul Lindahl for assistance with the EPR and useful discussions, Kai Hilpert (Karlsruhe Institute of Technology) for providing the labeled bactenecin derivative, and Lisa Monson for help in figure preparation. This work was funded by the National Institutes of Health (GM070622) and the Office of Naval Research (N00014-08-1-0467).
Footnotes
ASSOCIATED CONTENT
Schematic diagrams of the microfluidics devices and the flow splitter, UV/Vis absorbance and fluorescence emission spectra, the quenching response as a function of [Cu2+] with a Hill equation fitting curve, a Job’s plot of Cu2+ and PS, EPR spectra data of PS vesicles with Cu2+, Stern-Volmer plots of metal ion quenching with no PS, the time-dependent quenching of DOPS and DPPS, the labeled protein response to Cu2+-PS quenching, FRAP data, ICP-MS results of the nanopure water used, a list of the lipids and fluorophores tested and the image processing procedures are provided. This material is available free of charge online at http://pubs.acs.org.
References
- 1.Leventis PA, Grinstein S. Annual Reviews. Vol. 39. Palo Alto: 2010. Annual Review of Biophysics; p. 407. [DOI] [PubMed] [Google Scholar]
- 2.Gordesky SE, Marinetti GV. Biochem Biophys Res Comm. 1973;50:1027. doi: 10.1016/0006-291x(73)91509-x. [DOI] [PubMed] [Google Scholar]
- 3.Zambrano F, Fleischer S, Fleischer B. Biochim Biophys Acta. 1975;380:357. doi: 10.1016/0005-2760(75)90104-6. [DOI] [PubMed] [Google Scholar]
- 4.Tyurina YY, Shvedova AA, Kawai K, Tyurin VA, Kommineni C, Quinn PJ, Schor NF, Fabisiak JP, Kagan VE. Toxicology. 2000;148:93. doi: 10.1016/s0300-483x(00)00199-2. [DOI] [PubMed] [Google Scholar]
- 5.Majd S, Estes DJ, Mayer M. Calcium Binding Proteins. 2006;1:26. [Google Scholar]
- 6.Bailey RW, Nguyen T, Robertson L, Gibbons E, Nelson J, Christensen RE, Bell JP, Judd AM, Bell JD. Biophys J. 2009;96:2709. doi: 10.1016/j.bpj.2008.12.3925. [DOI] [PMC free article] [PubMed] [Google Scholar]
- 7.Chaurio RA, Janko C, Munoz LE, Frey B, Herrmann M, Gaipl US. Molecules. 2009;14:4892. doi: 10.3390/molecules14124892. [DOI] [PMC free article] [PubMed] [Google Scholar]
- 8.Lentz B. Prog Lipid Res. 2003;42:423. doi: 10.1016/s0163-7827(03)00025-0. [DOI] [PubMed] [Google Scholar]
- 9.Huang BX, Akbar M, Kevala K, Kim HY. J Cell Biol. 2011;192:979. doi: 10.1083/jcb.201005100. [DOI] [PMC free article] [PubMed] [Google Scholar]
- 10.Hauser H, Darke A, Phillips MC. Eur J Biochem. 1976;62:335. doi: 10.1111/j.1432-1033.1976.tb10165.x. [DOI] [PubMed] [Google Scholar]
- 11.Papahadjopoulos D. Biochim Biophys Acta. 1968;163:240. doi: 10.1016/0005-2736(68)90103-x. [DOI] [PubMed] [Google Scholar]
- 12.Shirane K, Kuriyama S, Tokimoto T. Biochim Biophys Acta. 1984;769:596. [Google Scholar]
- 13.Feigenson GW. Biochemistry. 1986;25:5819. doi: 10.1021/bi00367a071. [DOI] [PubMed] [Google Scholar]
- 14.Tokutomi S, Lew R, Ohnishi SI. Biochim Biophys Acta. 1981;643:276. doi: 10.1016/0005-2736(81)90073-0. [DOI] [PubMed] [Google Scholar]
- 15.Sinn C, Antonietti M, Dimova R. Colloids Surf A. 2006;282–283:410. [Google Scholar]
- 16.Majd S, Mayer M. Angew Chem, Int Ed. 2005;44:6697. doi: 10.1002/anie.200502189. [DOI] [PubMed] [Google Scholar]
- 17.Linder M, Hazegh-Azam M. Am J Clin Nutr. 1996;63:797S. doi: 10.1093/ajcn/63.5.797. [DOI] [PubMed] [Google Scholar]
- 18.Elam JS, Thomas ST, Holloway SP, Taylor AB, Hart PJ. In: Advances in Protein Chemistry. Joan Selverstone Valentine EBG, editor. Vol. 60. Academic Press; 2002. p. 151. [DOI] [PubMed] [Google Scholar]
- 19.Rae TD, Schmidt PJ, Pufahl RA, Culotta VC, O'Halloran TV. Science. 1999;284:805. doi: 10.1126/science.284.5415.805. [DOI] [PubMed] [Google Scholar]
- 20.O'Halloran TV, Culotta VC. J Biol Chem. 2000;275:25057. doi: 10.1074/jbc.R000006200. [DOI] [PubMed] [Google Scholar]
- 21.Mandinov L, Mandinova A, Kyurkchiev S, Kyurkchiev D, Kehayov I, Kolev V, Soldi R, Bagala C, de Muinck ED, Lindner V, Post MJ, Simons M, Bellum S, Prudovsky I, Marciag T. Proc Natl Acad Sci USA. 2003;100:6700. doi: 10.1073/pnas.1231994100. [DOI] [PMC free article] [PubMed] [Google Scholar]
- 22.Sigurdsson EM, Brown DR, Alim MA, Scholtzova H, Carp R, Meeker HC, Prelli F, Frangione B, Wisniewski T. J Biol Chem. 2003;278:46199. doi: 10.1074/jbc.C300303200. [DOI] [PubMed] [Google Scholar]
- 23.Tardito S, Bassanetti I, Bignardi C, Elviri L, Tegoni M, Mucchino C, Bussolati O, Franchi-Gazzola R, Marchiò L. J Am Chem Soc. 2011;133:6235. doi: 10.1021/ja109413c. [DOI] [PubMed] [Google Scholar]
- 24.Hope MJ, Bally MB, Webb G, Cullis PR. Biochim Biophys Acta. 1985;812:55. doi: 10.1016/0005-2736(85)90521-8. [DOI] [PubMed] [Google Scholar]
- 25.Mayer LD, Hope MJ, Cullis PR. Biochim Biophys Acta. 1986;858:161. doi: 10.1016/0005-2736(86)90302-0. [DOI] [PubMed] [Google Scholar]
- 26.Yang T, Jung S-y, Mao H, Cremer PS. Anal Chem. 2001;73:165. doi: 10.1021/ac000997o. [DOI] [PubMed] [Google Scholar]
- 27.Brian AA, McConnell HM. Proc Natl Acad Sci USA. 1984;81:6159. doi: 10.1073/pnas.81.19.6159. [DOI] [PMC free article] [PubMed] [Google Scholar]
- 28.Groves JT, Ulman N, Cremer PS, Boxer SG. Langmuir. 1998;14:3347. [Google Scholar]
- 29.Cremer PS, Groves JT, Kung LA, Boxer SG. Langmuir. 1999;15:3893. [Google Scholar]
- 30.Monson CF, Pace HP, Liu C, Cremer PS. Anal Chem. 2011;83:2090. doi: 10.1021/ac1028819. [DOI] [PMC free article] [PubMed] [Google Scholar]
- 31.Jung H, Robison AD, Cremer PS. J Am Chem Soc. 2009;131:1006. doi: 10.1021/ja804542p. [DOI] [PMC free article] [PubMed] [Google Scholar]
- 32.Shriver D, Aktkins P. Inorganic Chemistry. 3. W. H. Freeman and Company; New York: 1999. [Google Scholar]
- 33.Crane JM, Tamm LK. Biophys J. 2004;86:2965. doi: 10.1016/S0006-3495(04)74347-7. [DOI] [PMC free article] [PubMed] [Google Scholar]
- 34.Lakowicz JR. Principles of Fluorescence Spectroscopy. 3. Springer Science+Business Media; New York: 2006. [Google Scholar]
- 35.Gal S, Pinchuk I, Lichtenberg D. Chem Phys Lipids. 2003;126:95. doi: 10.1016/s0009-3084(03)00096-3. [DOI] [PubMed] [Google Scholar]
- 36.Jastrzab R, Lomozik L. J Coord Chem. 2009;62:710. [Google Scholar]
- 37.Várnagy K, Garriba E, Sanna D, Sóvágó I, Micera G. Polyhedron. 2005;24:799. [Google Scholar]
- 38.Cevc G, Watts A, Marsh D. Biochemistry. 1981;20:4955. doi: 10.1021/bi00520a023. [DOI] [PubMed] [Google Scholar]
- 39.Gal S, Lichtenberg D, Bor A, Pinchuk I. Chem Phys Lipids. 2007;150:186. doi: 10.1016/j.chemphyslip.2007.08.001. [DOI] [PubMed] [Google Scholar]
- 40.Albro PW, Corbett JT, Schroeder JL. J Inorg Biochem. 1986;27:191. doi: 10.1016/0162-0134(86)80060-5. [DOI] [PubMed] [Google Scholar]
- 41.Hilpert K, Volkmer-Engert R, Walter T, Hancock REW. Nature Biotechnol. 2005;23:1008. doi: 10.1038/nbt1113. [DOI] [PubMed] [Google Scholar]
- 42.Cross J, Leslie A, Smith H. J Forensic Sci Soc. 1976;16:311. doi: 10.1016/s0015-7368(76)71078-8. [DOI] [PubMed] [Google Scholar]
- 43.Yorek MA. In: Phospholipids Handbook. Cevc G, editor. Marcel Dekker, Inc; New York: 1993. p. 745. [Google Scholar]
Associated Data
This section collects any data citations, data availability statements, or supplementary materials included in this article.


