Abstract
Spinocerebellar ataxia-1 (SCA1) is a late onset neurodegenerative disease caused by the expansion of a polyglutamine repeat within ataxin-1 protein. The toxic effects triggered by mutant ataxin-1 result in degeneration of the neurons in cerebellum, brain stem and spinocerebellar tracts. The targeted overexpression of mutant ataxin-1 in cerebellar Purkinje cells (PCs) of the SCA1 transgenic mice results in the formation of cytoplasmic vacuoles in PCs. These vacuoles appear early on before the onset of behavioral abnormalities. Interestingly, we found that vacoules contain S100B and vimentin proteins, which normally localize to neighboring Bergmann glia (BG). Further, immunohistochemical and specialized silver stain analysis revealed that vacuolar formation is associated with alterations in the morphology of dendritic spines of PCs. To gain insights into the mechanisms of vacuolar formation, we investigated if vacuoles in SCA1 PCs have an autophagic origin or are a consequence of some other event. We examined the expression levels (by Western blotting) of microtubule-associated protein light chain 3 (LC3)-I and LC3-II, and the degradation levels of p62 (a LC3 partner) in the cerebellar fractions prepared from pre-symptomatic SCA1 and age-matched wild-type mice. No p62 degradation was observed; however, LC3-II/(LC3-I + LC3-II) ratios were significantly altered in SCA1 mice indicating changes in the autophagic flux. In addition, LC3 localized to PC vacuoles. Further, we observed a co-localization of myo-inositol monophosphatase 1 (IMPA1) with S100B in PC vacuoles. IMPA1 is present in PC spines and has been implicated in autophagy. In vitro studies using purified IMPA1 and S100B demonstrated that S100B interacted with and activated IMPA1. Both apo and Ca2+-bound S100B were found to activate IMPA1, depending on substrate concentration. IMPA1 is regulated by another calcium-binding protein calbindin-D28k (CaB), since we reported earlier that the CaB levels are reduced in SCA1 PCs, the activation of IMPA1 by S100B may modulate CaB-dependent inositol signaling. This may cause BG–PC interface to degenerate resulting in vacuolar formation. In sum, these data indicate that vacuoles appearing early in SCA1 PCs could be developing through some unknown autophagic mechanism.
Keywords: Purkinje cells, S100B, Myo-inositol monophosphatase 1, Spinocerebellar ataxia-1, Cerebellum, Vacuoles, Neurodegeneration, Glia
Introduction
Spinocerebellar ataxia-1 (SCA1), an autosomal dominant disease, belongs to a group of trinucleotide repeat disorders of the nervous system. SCA1 is associated with progressive ataxia resulting from the loss of cerebellar Purkinje cells (PCs) and neurons in the brainstem [1–3]. The exact function of the mutant protein ataxin-1 is not fully understood [3–5]. Overexpression of mutant ataxin-1 in PCs of SCA1 transgenic mice results in a progressive ataxia and PC pathology that are very similar to those seen in SCA1 patients [6]. In transgenic mice, a prominent feature of SCA1 pathology is the presence of intranuclear inclusions and cytoplasmic vacuoles in PCs. The vacuoles appear much earlier, before the appearance of intranuclear inclusions and onset of behavioral abnormalities [7, 8]. It is not clear why vacuoles are formed and if they are toxic to PCs in SCA1.
Bergmann glia (BG) located in the PC layer in cerebellar cortex elaborately ensheathe PC dendrites, synapses, and soma, and are structurally and functionally related with differentiating PCs [9]. Pakhotin and Verkhratsky [10] demonstrated electrical coupling between BG and PCs. Further, BG are gaining recognition as key players in the clearance of extracellular glutamate [11]. In addition, these cells express high levels of S100B, which acts like a trophic factor on the neighboring neurons [12–14]. Earlier, we showed that S100B protein expressed in BG was localized to PC vacuoles [8]. Although there is no report on the role of BG in PC degeneration in SCA1, recently, Custer and co-workers [15] demonstrated that the BG expression of mutant ataxin-7 produces degeneration of PCs. We believe that BG influence PC differentiation and pathology in SCA1.
S100B belongs to a family of Ca2+-modulated proteins of the EF-hand type [12, 14, 16]. S100B is abundantly expressed in the nervous system and is suggested to function as cytokines with both neurotrophic and neurotoxic effects [14, 17–19]. It is mainly expressed in glial cells and S100B released from astrocytes promotes neuronal survival [20, 21] and development [22]. Increased levels of S100B have been reported in Alzheimer’s disease and Down syndrome [23, 24]. S100B interacts with multiple targets including p53, nuclear Dbf2-related kinases, receptor for advanced glycation end products, protein kinase C, and neuromodulin [16, 25, 26]. Here, we show that S100B interacts with and activates myo-inositol monophosphatase 1 (IMPA1).
Inositol monophosphatase (IMPase) is a key enzyme in the phosphatidylinositol second messenger pathway in which it is responsible for the final step in the degradation of inositol-1,4,5-trisphosphate (IP3) to myo-D-inositol. IMPase is encoded by two genes IMPA1 and IMPA2 [27]. IMPA1 is highly expressed in cerebellar PCs and localizes to dendritic spines where it regulates IP3-mediated Ca2+ signaling [27, 28]. It has also been implicated in autophagy as inhibition of IMPA1 by lithium induces autophagic vacuole formation [29, 30]. In the present study, we describe that IMPA1 and S100B co-localize to the vacuoles of SCA1 PCs. Further, to characterize the function of S100B, we examined its interaction with IMPA1 as a first step to investigating the role of BG in the pathogenesis of SCA1.
Materials and Methods
Materials
Rabbit polyclonal anti-S100B antibody was obtained from Abcam Inc., Cambridge, MA, USA; mouse and goat poly-clonal anti-AMPA1 antibodies were purchased from Novus Biologicals Inc., Littleton, CO, USA and Santa Cruz Biotechnology Inc., Santa Cruz, CA, USA, respectively; mouse monoclonal anti-green fluorescent protein (GFP) antibody was obtained from Roche Diagnostics Corp., Indianapolis, IN, USA; rabbit polyclonal anti-calbindin D-28K (CaB) was obtained from Millipore, Temecula, CA, USA; mouse mono-clonal anti-vimentin antibody and GFAP-cy3 conjugate were purchased from Sigma Chemical Co., St. Louis, MO, USA; mouse and rabbit monoclonal and polyclonal antibodies, which recognize both LC3-I and LC3-II forms, respectively, were obtained from Medical & Biological Laboratories, MBL International Corp., Woburn, MA, USA; rabbit anti-p62 antibody was purchased from Santa Cruz Biotechnology Inc., Santa Cruz, CA, USA; and mouse anti-βIII-tubulin was obtained from Promega Corp., Madison, WI, USA. All cell culture reagents or media were purchased from either Sigma Chemical Co. or Gibco Invitrogen (Carlsbad, CA, USA).
SCA1 Transgenic Mice
The SCA1 transgenic mice are generated by Drs. Harry Orr and Huda Zoghbi [6] at the University of Minnesota. We have a colony of SCA1 mice in our animal facility. The heterozygous PS-82 BO5 line of mice identified using a transgene specific polymerase chain reaction assay were backcrossed to the parental FVB/N strain (N=10) to establish congenic line with homogeneous background strain. The line B05 has 30 copies of the transgene PS-82. Transgenic mice of the B05 line develop progressive loss of PCs and cerebellar function. Heterozygous B05 transgenic mice become visibly ataxic (as assessed by home cage behavior) at 12 weeks of age, whereas in homozygotes, the onset of ataxia is at 6 weeks postnatally.
Green Fluorescent Protein Transgenic Mice
Homozygous GFP mice and wild-type (same background) were obtained from Jackson Labs, Bar Harbor, ME, USA [31]. We have a colony of GFP transgenic mice in our animal facility. The transgene expression of enhanced GFP gene is under the control of pcp2/L7 promoter similar to ataxin-1 expression in SCA1 mice, and GFP is expressed only in PCs, where it fills dendrites, soma, axons, and nuclei. GFP is detected in PCs as early as E17 and increases during development. There is no PC pathology or behavioral abnormalities in these mice.
Generation of Experimental Animals
SCA1/GFP Mice
Female mice (FVB/N) homozygous for SCA1 (SCA1/SCA1) were mated with male (FVB/N) homozygous (GFP/GFP) GFP mice to generate double mutants heterozygous for both SCA1 and GFP (SCA1/+–GFP/+).
Wild-Type/GFP
Homozygous GFP (GFP/GFP) males (FVB/N) were mated with wild-type (+/+) females (FVB/N) to generate heterozygous (GFP/+) mice wild-type for SCA1.
The manipulation and maintenance of animals were approved by the Institutes Animal Care and Use Committee according to the regulations for using animals in scientific research.
Tissue Processing
SCA1 and GFP heterozygous and wild-type mice at different postnatal ages were anesthetized and perfused with 4% buffered paraformaldehyde according to the method described by Neuroscience Associates, Knoxville, TN, USA. The brains were removed and immersed in the perfusion fixative and further fixed overnight, transferred to phosphate-buffered saline (PBS), and processed for vibratome sectioning or paraffin embedding. Sections were cut from the midline sagittal plane of cerebella.
Human Autopsy Tissue
Cerebellar tissues from patients with SCA1 (n=5) and normal patients who had died of non-neurologic illness (n= 4) were obtained and frozen or formalin fixed at autopsy as previously described [32]. The mean age at the time of death and postmortem time for control subjects and SCA1 patients were not significantly different. The SCA1 patients (“C” kindred) suffered from imbalance, ataxia of limbs, and dysarthria. Neuropathological changes represented severe atrophy of inferior olives, pons, and cerebellum [32]. All patients were severely disabled by their end-state cerebellar ataxia and were wheelchair- or bed-bound. The duration of ataxia was 15–30 years.
Immunohistochemistry
Six-micrometer paraffin-embedded or 50-μm vibratome sections of 12-day- to 10-week-old mice (wild-type or SCA1, n= 4) or human SCA1 cerebellar tissue were immunohisto-chemically stained with optimally diluted monoclonal or polyclonal antibodies to S100B (1:100), CaB (1:200), IMPA1 (1:200), GFP (1:100), vimentin (1:200), GFAP (1:400), LC3 (1:100), or βIII-tubulin (1:400) as described earlier [33]. Briefly, paraffin-embedded sections were deparaffinized and then incubated with 3% H2O2 for 10 min and microwaved for 14 min and then with 5% blocking goat serum for 30 min with thorough intervening washes with PBS. After washing the sections with PBS, the sections were incubated for 1 h at room temperature or overnight at 4°C with primary antibody, followed by incubation with (30 min) anti-mouse or rabbit second antibody, biotinylated (for HRP staining) or conjugated to Alexa 488 or 546 fluorescent dye (Molecular Probes Inc., Eugene, OR, USA). The sections were then mounted and photomicrographed using an Olympus BAX60 epifluorescence microscope. Images were processed using Adobe Photoshop CS (version 8.0; San Jose, CA, USA). To avoid bias due to overlapping of layers of cells, serial sections were counterstained with H & E, and neurons with clearly visible nucleoli were marked as PCs and were then probed for the presence of vacuoles.
Spine Density
To access if there was a significant reduction in the number of spines in SCA1 PC with vacuoles as compared to PC without vacuoles, digital images of GFP-immunostained PCs were captured with a digital camera and were analyzed using Image-Pro Plus image analysis system (Media Cybernetics, Silver Spring, MD, USA). Briefly, 6 μm of tertiary dendrites was sampled (n=10) from different regions of the dendritic tree of PCs with and without vacuoles. The number of spines present in those sampled lengths was calculated and subjected to statistical analysis. Significant differences in the spine numbers were calculated using GraphPad Prism, unpaired Student’s t test for independent samples, version 4.0 (GraphPad Software, San Diego, CA, USA). A value of P<0.05 was accepted as statistically significant.
Specialized Sliver Staining
FD NeuroSilver™ Kit I (FD Neurotechnologies, Inc., MD, USA) was used for the detection of degenerating neurons in fixed vibratome cerebellar sections of the SCA1 and wild-type mice. This kit uses the principle that certain components of neurons undergoing degeneration, such as lysosomes, axons, and terminals, become particularly argyrophilic. Under certain conditions, these cellular elements bind to silver ions with high affinity. Upon reduction, the silver ions form metallic grains that are visible under a light microscope.
In Vitro Cross-Linking of Proteins Disuccinimidyl Suberate
S100B and IMPA1 cross-linking was performed as described earlier [34]. The reaction was performed at 37°C for 30 min in 100 μl PBS containing appropriate amounts of purified bovine brain S100B (Sigma Chemical Co.) and IMPA1 (Calbiochem Nova Biochem, San Diego, CA, USA) followed by an additional 20-min incubation at room temperature in the presence of 0.5 mM disuccinimidyl suberate (DSS). The reaction was stopped by the addition of sodium dodecyl sulfate polyacrylamide gel electrophoresis (SDS-PAGE) sample buffer. The samples were then processed for Western blotting.
Western Blots
For Western blot analysis, the above samples or cerebellar cytosolic/membrane fractions were subjected to SDS-PAGE (4–20% acrylamide gels; Bio-Rad Laboratories, Hercules, CA, USA) as described earlier [34]. Equal amounts of proteins were loaded. Proteins were transferred to poly-vinylidene difluoride (PVDF) membrane (Bio-Rad), blocked for 1 h with blocking solution (Western Breeze, Invitrogen, Carlsbad, CA, USA) and incubated for 1 h or overnight with appropriate concentration of anti-S100B (1:1,000), anti-IMPA1 (1:2,000), anti-LC3 (1:1,000), anti-p62 (1:1,000), or anti-βIII-tubulin (1:2,000) primary antibodies. Immunoreactive proteins were visualized by incubation (for 1 h) in the goat anti-mouse alkaline phosphatase-labeled secondary antibody followed by reaction with the luminescent substrates (Western Breeze, Invitrogen). The blots were then exposed to hyperfilm-ECL (Amersham Biosciences, Buckinghamshire, UK).
Co-immunoprecipitation
Co-immunoprecipitation of S100B and IMPA1 was performed using Seize X Protein A IP kit (Pierce, Rockford, IL, USA). Briefly, samples containing 25 μl of 50% slurry of protein A agarose were rotated at room temperature with the mouse anti-IMPA1 antibody (5 μg/ml) or goat serum for 1 h followed by a brief centrifugation (3,000×g) in a spin cup column and washes per manufacturer’s instructions. The resuspended protein A agarose–IMPA1 antibody complex was added to preincubated (30 min, at room temperature) samples containing 2 μg/ml of purified bovine brain IMPA1 and 4 μg/ml of S100B proteins. The contents were rotated at room temperature for 1 h. Immunoprecipitates were centrifuged in the spin cup columns and washed four times with binding/wash buffer. Bound proteins were eluted out by applying elution buffer and eluted fractions were then mixed with SDS-PAGE sample buffer, followed by boiling for 5 min. Samples were resolved by SDS-PAGE and transferred for immunoblot analysis as described above. Electrophoretically separated proteins were transferred to PVDF membranes, blocked 1 h in blocking solution (Western Breeze, Invitrogen), and incubated overnight with diluted monoclonal anti-S100B antibody (1:2,000). Immunoreactive proteins were visualized by incubation (for 1 h) in the goat anti-mouse alkaline phosphatase-labeled secondary antibody followed by reaction with the luminescent substrates (Western Breeze, Invitrogen). The blots were then exposed to hyperfilm-ECL (Amersham).
IMPA1 Activity
The effect of S100B protein on IMPA1 activity was measured by the method of Ohnishi et al. [27]. The activity assay was performed at 37°C for 30 min in the presence of 50 mM Tris–HCl (pH 8.0), 0.7 mM substrate (myo-inositol mono-phosphate 1), 1 mM ethylene glycol bis(2-aminoethyl ether)-N,N,N′,N′-tetraacetic acid (EGTA), 2 mM MgCl2, and 0.5 μg/ml of purified IMPA1. In order to distinguish IMPA1 activity from non-specific phosphatases, the reaction was carried out in the presence and absence of 60 mM LiCl. The reaction was stopped by the addition 60 μl of distilled water and 20 μl of diluted Malachite Green Reagent per manufacturer’s instructions (BioAssay Systems, Hayward, CA, USA). The amount of free phosphate was calculated by calorimetric determination at 620 nm in a microtiter plate format. IMPA1 activity was expressed as micromolar phosphate liberated per minute. For statistical comparison, data were collected from three independent experiments (n= 3) ran in duplicates. Statistical significance was calculated using GraphPad Prism, unpaired Student’s t test for independent samples, version 4.0 (GraphPad Software). A value of P<0.05 was accepted as statistically significant.
Purkinje Cell Cultures
Cerebellar PC mixed or enriched cultures were prepared by our previously described method [35]. We used Thy 1.2 (CD90.2)-coated Dynabeads (Dynal, Oslo, Norway) to prepare PC-enriched cultures.
Preparation of Dissociated Cultures and Feeding
The whole cerebellum was removed from 0- to 1-day-old mouse pup. Meninges were carefully removed under the dissection microscope. Tissue was rinsed in cold Ca2+ and Mg2+-free Hanks balanced salt solution (CMF-HESS) and then 3 ml of cold CMF-HESS was added to a Petri dish containing six cerebella. The tissue was minced and was then added to the centrifuge tubes. Tubes were left at room temperature for 5 min so that the tissue pieces can settle down with gravity. The supernatant was gently removed and 3 ml of 1% trypsin/0.1% DNase (in CMF-HESS) was added. Pellet (minced tissue pieces) was incubated for 14 min at room temperature followed by washing and then trituration in 3 ml Dulbecco’s modified Eagle’s medium (DMEM) containing 0.05% DNase. The dissociated cells were centrifuged gently and the top 2.4 ml of media was removed, and with the remaining media, the cells were titrated and the cell pellet was thoroughly chilled on ice. The pellet was resuspended in DMEM and cells were counted. Cells were diluted with the plating medium (DMEM and 10% horse serum), and the cells were plated at 1–1.5×10⁶ cells/1.5 ml of medium and grown in Lab Tek II Camber slides with four wells/slide. Alternatively, to 1 ml of cell suspension, 25 μl of Thy 1.2-coated Dynabeads was added. Cells were chilled on ice for 5 min and were incubated at room temperature for 15 min with gentle tilting and rotation. The microfuge tubes were placed on Dynal MPC for 1 min and 500 μl of DMEM-1% horse serum was added to the pelleted beads. Beads were washed twice with DMEM–1% horse serum and cells are resuspended in 1 ml plating media. The microfuge tubes or plates were incubated overnight at 35.5°C with 5% CO2 and 100% humidity. The next day, cells were flushed (attached to Dynabeads) vigorously, and released cells were transferred into a flask containing serum-free supplement [50 ml DMEM, 50 ml H-12, l ml (100×) insulin–transferrin–selenium supplement (Gibco BRL), 1 ml (100×) penicillin–streptomycin, 100 μM putrescine, and 20 nM progesterone]. These cultures initially comprise a very heterogeneous mixture of cell types, but the smallest and most numerous type (granule cell precursors) gradually die off in the first 6 to 9 days. The remaining cells include (relatively) flat glial cells, bipolar and tripolar cells 8–10 μm in diameter, and about an equal number of PCs (of similar size with slightly more elaborate asymmetric arbors off to one side of the soma). By 10–15 days, these arbors are more elaborate.
Immunocytochemistry
The cultured PCs were immunostained for CaB or S100B. Briefly, the cultures were fixed for 30 min in 4% paraformaldehyde in PBS. After 3×5 min rinse in PBS, the cultures were incubated with 10% blocking goat or horse serum containing 0.05% Triton X-100 for 10 min with thorough intervening washes with PBS. The sections were then incubated overnight at 4°C with optimal dilution of primary antibody. After washing in PBS, cultures were incubated for 1 h with anti-mouse or anti-rabbit IgG conjugated with Alexa 488, or Cys3 (diluted 1:100 in 5% goat or horse serum prepared in PBS containing 0.05% Triton X-100). After mounting, the immunostained cells were photomicrographed using an Olympus BAX 60 epi-fluorescence microscope.
S100B Protein Labeling
Bovine brain purified S100B protein (Sigma) was labeled with fluorescent dye Oregon Green using Oregon Green 514 protein labeling kit (Molecular Probes Inc.) Five- to 14-day-old cultures were incubated at different time intervals with labeled S100B protein.
Results
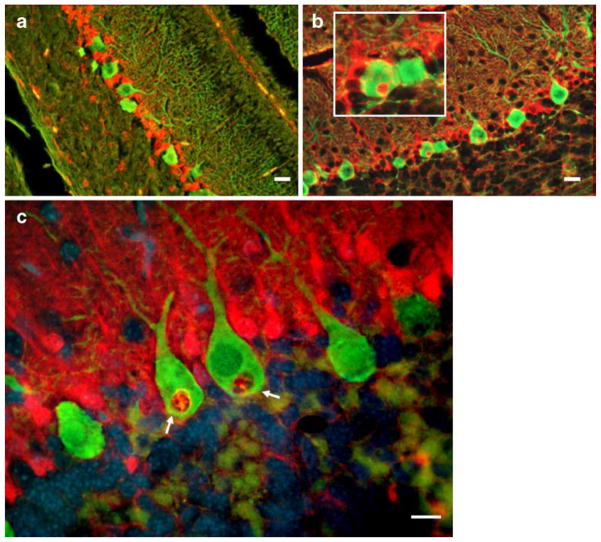
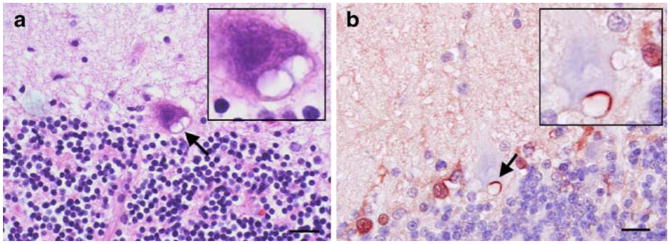
Earlier, we showed that SCA1 PCs cells contain glial-derived cytoplasmic vacuoles [8]. We further demonstrated that S100B though expressed exclusively in BG was localized to these vacuoles (Fig. 1; [8]). S100B containing cytoplasmic vacuoles were not observed during second postnatal week (Fig. 1a) in PCs of heterozygous SCA1 mice, but started appearing during the third week (Fig. 1b), and by 5 weeks, a number of PCs contained S100B-positive vacuoles (Fig. 1c). Gene dosage had no effect on the time line of vacuolar development [8]. Early on, these vacuoles were negative for PC cell marker proteins CaB, protein kinase C-γ, and β-III tubulin. However, in older mice (10 weeks), we also observed a localization of protein kinase C-γ to vacuoles as reported by Skinner et al. [7]. SCA1 mice after 5 weeks of age start showing rotarod abnormalities. No S100B vacuoles were seen in wild-type animals or A02 transgenic line with normal CAG repeats [8]. S100B vacuoles were also observed in PCs of human patients with SCA1 (Fig. 2a, b), but not in patients dying with non-neurologic illness (not shown).
Fig. 1.
a–c S100B (red) and CaB (green) immunofluorescence in the cerebellar PCs of 12-day-old (a), 18-day-old (b), and 5-week-old (c) SCA1 heterozygous mice. S100B-positive cytoplasmic vacuoles (inset in b and arrows in c) are visible in PCs. Vacuoles are negative for CaB. In c, nuclei are stained with DAPI (blue). No vacuoles were seen in a 12-day-old animal (a). Bars=10 μm
Fig. 2.
a, b Human SCA1 cerebellar section showing cytoplamic vacuoles (arrows, insets) in surviving PCs. a H & E staining. b S100B immunostaining (brown/red). Bergmann glial S100B is localized to PC vacuole. The section is counterstained with hematoxylin (blue). No vacuoles were seen in the sections from age-matched normal control patients (not shown). Bars=10 μm
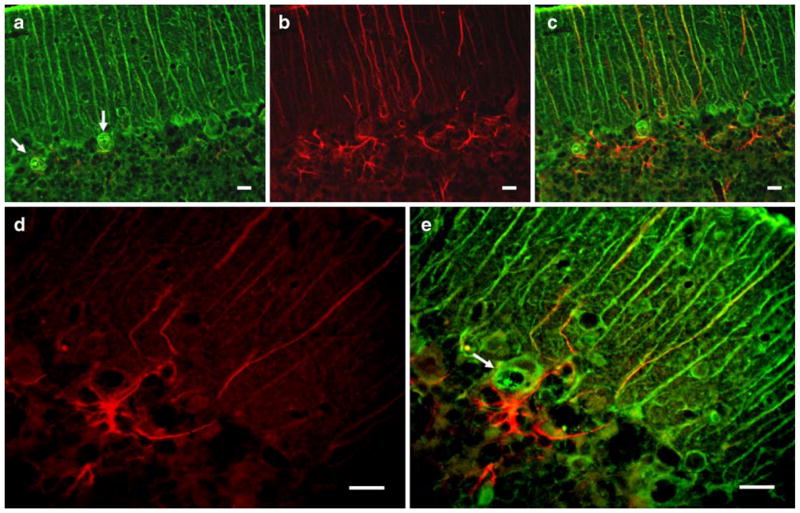
To gain insight into a molecular basis of the vacuole formation in SCA1, we looked at the expression of other BG proteins. The immunohistochemical analysis revealed that besides S100B, vacuoles contain vimentin, another BG marker protein (Fig. 3a). In contrast, they are devoid of GFAP (Fig. 3b–e). Though cerebellar gliosis is a hallmark of SCA1 disease, in 2–5-week-old SCA1 mice, there were a fewer number of GFAP reactive glia (Fig. 3b) However, more GFAP-positive elements were present around PCs with vacuoles (Fig. 3c, e).
Fig. 3.
a–e Double immunofluorescence showing vimentin (green) and GFAP (red) localization in the cerebellar sections of a 5-week-old SCA1 heterozygous mouse. Vimentin-positive cytoplasmic vacuoles (arrows) are visible in PCs. Vacuoles are negative for GFAP (b, d). c, e Merged images. More GFAP-positive elements are seen around PCs with vacuoles (c–e). Bars=10 μm
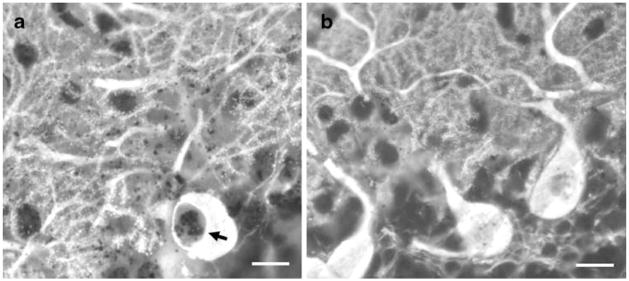
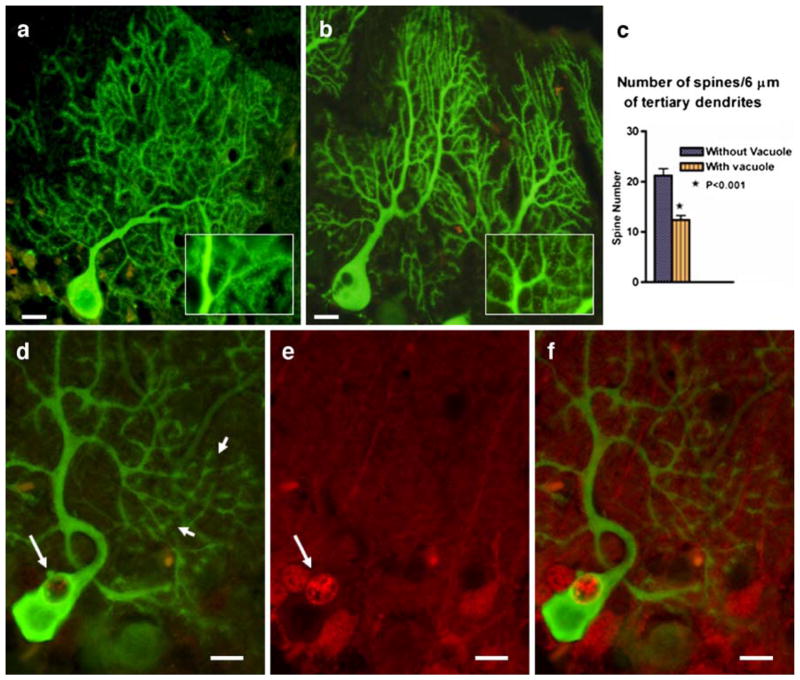
Further, we observed that the process of vacuolar formation may be associated with degenerative and morphologic changes in PCs (Figs. 4 and 5). Figure 4a shows degenerating argyrophilic components in a PC vacuole and along the dendrite in 5-week-old SCA1 mouse. In contrast, these silver deposits are not seen in PCs of age-matched wild-type mouse (Fig. 4b). Moreover, in comparison to 4-week-old wild-types (Fig. 5a), SCA1 PCs with vacuoles exhibited an overall decrease in the number of GFP immunofluorescent PC spines (Fig. 5b). This decrease in the number of spines was significant (P<0.05) when spines were counted across 6 μm of tertiary dendrites sampled from different regions of the dendritic tree of PCs with and without vacuoles (Fig. 5c). At higher magnification, PCs with S100B containing vacuoles showed cluster-like structures on the dendritic branches as revealed by GFP immunofluorescence in Fig. 5d–f. These structures were not visible in PCs without vacuoles (not shown).
Fig. 4.
CaB immunostained PC in a 5-week-old SCA1 mouse (thick vibratome section) showing silver deposits in a vacuole (arrow) and along degenerating dendrites (a). These sliver deposits are not seen in the age-matched wild-type mouse (b). Bars=10 μm
Fig. 5.
GFP expressing wild-type and SCA1 PCs from 4-week-old mice (a, b). Sections were immunostained for GFP (green). The inset in b shows a marked decrease in spine density in SCA1 as compared to wild-type in a. c Six micrometers of tertiary dendrites was sampled (n=10) from different regions of the dendritic tree of PCs with and without vacuoles using Image-Pro Plus image analysis system (Media Cybernetics). The number of spines present in those sampled lengths were calculated and subjected to statistical analysis. Significant differences in the spine numbers were calculated using GraphPad Prism, unpaired Student’s t test for independent samples, version 4.0 (GraphPad Software). A value of P<0.05 was accepted as statistically significant. d–f Double immunostaining showing GFP (green, d) and S100B (red, e) localization to PCs in a 4-week-old SCA1 mouse cerebellum. The large arrows indicate the presence of S100B containing cytoplasmic vacuole in PC, and the small arrows show that this PC with S100B vacuole exhibit cluster-like dendritic spine structures. f Merged image
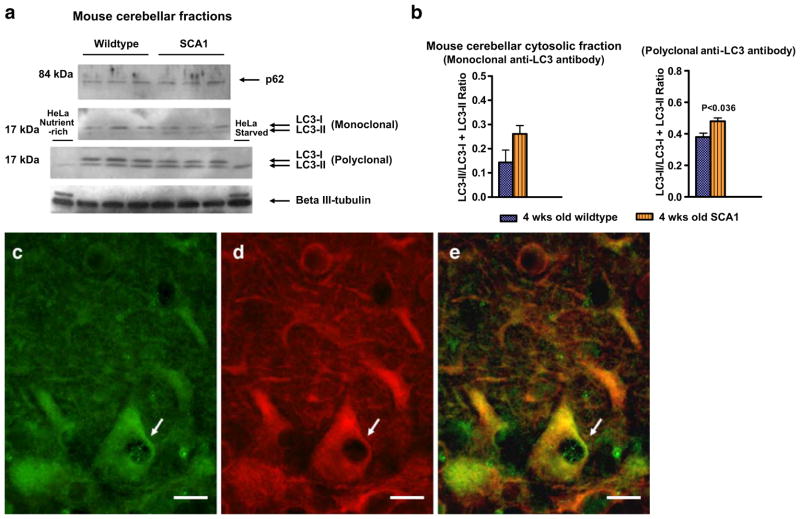
To investigate if vacuoles in SCA1 PCs have an autophagic origin, we examined the expression levels (by Western blotting) of microtubule-associated protein light chain 3 (LC3)-I and LC3-II, and the degradation levels of p62 (a LC3 partner) in the cerebellar fractions prepared from pre-symptomatic SCA1 (4 weeks old) and age-matched wild-type mice (Fig. 6a). The expression levels of βIII-tubulin were used as sample loading control. HeLa cell lysates were used as internal controls in order to identify LC3-II bands (Medical & Biological Laboratories; Fig. 6a). During autophagy, the LC3 form I is converted to form II, and this form II gets associated with autophagic vesicles. Therefore, the presence of LC3 in autophagosomes as well as the conversion of LC3-I to the lower migrating form LC3-II have been used as indicators of autophagy. To assess the autophagic flux, LC3-II/(LC3-I + LC3-II) ratios were calculated (Fig. 6b) [36]. No p62 degradation was observed in the cerebellar fractions of SCA1 mice as compared to wild-type animals (Fig. 6a). However, Western blots analysis of LC3 using mono- and polyclonal antibodies, which recognize both LC3-I and LC3-II forms (Medical & Biological Laboratories, MBL International Corp.) showed altered levels of LC3-I and LC3-II in SCA1 mice. This was further supported by significant alterations in LC3-II/(LC3-I + LC3-II) ratios. LC3 also localized to the vacuoles in PCs in 4-week-old SCA1 mouse cerebellar sections (Fig. 6c–e). These data indicate that vacuoles appearing early in SCA1 PCs could be developing through some autophagic mechanism.
Fig. 6.
a Western blots of p62, LC3, and βIII-tubulin in mouse cerebellar fractions of 4-week-old wild-type (n=3) and SCA1 (n=3) mice. Samples were subjected to SDS-PAGE, followed by electro-transfer and Western blot analysis. Western blots analysis of LC3 using mono- and polyclonal antibodies, which recognize both LC3-I and LC3-II forms (Medical & Biological Laboratories, MBL International Corp.) showed altered levels of LC3-I and LC3-II in SCA1 mice. HeLa cell lysates prepared from cells either incubated with 10% fetal calf serum or starved overnight were used as internal controls to identify LC3-II bands (Medical & Biological Laboratories). The data presented in b are the mean±SD of LC3-II/(LC3-I + LC3-II) ratios calculated from the band intensity measurements of the Western blots. Statistical significance was calculated using GraphPad Prism, unpaired Student’s t test for independent samples, version 4.0 (GraphPad Software). A value of P<0.05 was accepted as statistically significant. c–e Double immunofluorescence showing LC3 (green, c) and βIII-tubulin (red, d) immunostaining in PCs in a 4-week-old SCA1 mouse. e Merged image. Arrows indicate PC vacuoles containing LC3. Bars=10 μm
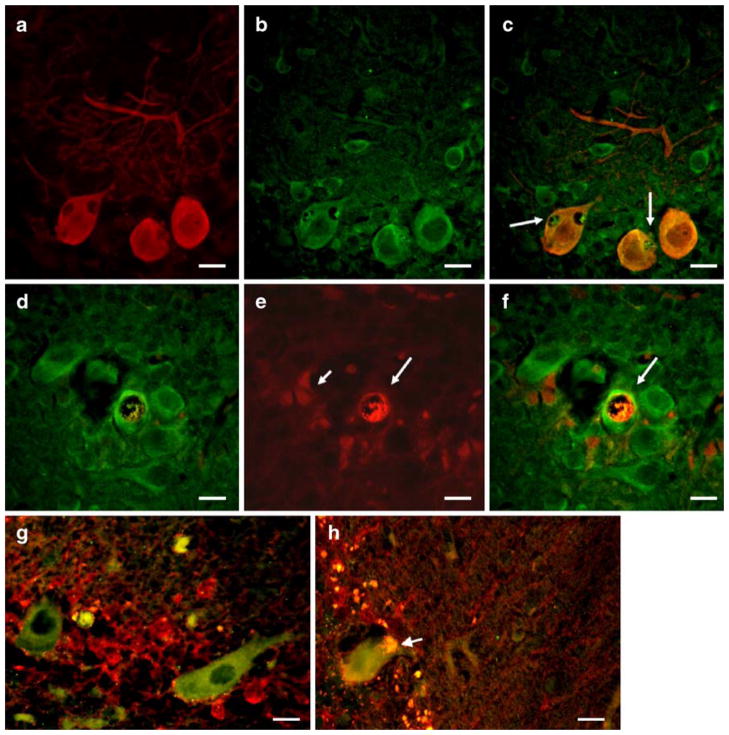
In addition, vacuoles contained IMPA1, another protein implicated in autophagy (Fig. 7a–c), which co-localized with S100B (Fig. 7d–f). IMPA1 regulates inositol signaling pathway and is present in the dendrites of both mouse and human PCs (Fig. 7b, d, g). IMPA1 co-localization with S100B was also observed in PCs of SCA1 patients (Fig. 7h). It is possible that the presence of IMPA1 in vacuoles could be some autophagic process yet to be explained.
Fig. 7.
a, b Double immunofluorescence showing CaB (red, a) and inositol monophosphatase 1 (green, b) immunostaining in PCs in a 4-week-old SCA1 mouse. c Merged image. Arrows indicate PC vacuoles containing IMPA1. d–f Co-localization of IMPA1 (green, d) and S100B (red, e) in a 10-week-old SCA1 homozygous mouse. At 10 weeks, the PC layer is disorganized. Small arrow in e shows S100B-positive BG. Big arrows in e and f show a large vacuole in PC. f Merged image. Bar=10 μm. g, h Human cerebellar sections showing IMPA1 (green) and S100B (red) immunostaining. IMPA1-positive PC in a normal control patient (g) does not show any vacuole. In contrast, S100B and IMPA1-immunostained cytoplasmic vacuole (arrow) is visible in the surviving PC of SCA1 patient (h). Bars=10 μm
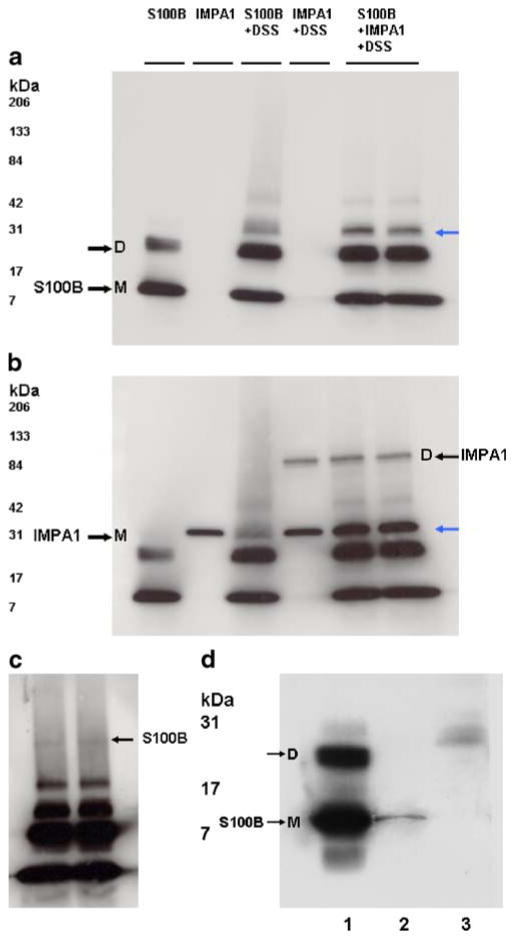
The next question was why S100B and IMPA1 1 co-localize? Is S100B a ligand for IMPA1? Yes, our in vitro experiments revealed that S100B interacted with IMPA1 (Fig. 8a–d). The interaction between S100B and IMPA1 was studied using protein–protein cross-linker DSS followed by Western blot analysis as described under “Materials and Methods”. The same amount of proteins was used in all experiments. S100B under reducing conditions existed as a monomer of 11 kDa, a dimer, and as a multimer (Fig. 8a). On the other hand, IMPA1 normally exists as a dimer, but under reducing conditions appeared as a monomer with approximate molecular weight of 30 kDa (Fig. 8b). The interaction between S100B and IMPA1 was also confirmed by co-immunoprecipitation (Fig. 8d).
Fig. 8.
a–c Western blots showing cross-linking of S100B with IMPA1. Purified bovine brain S100B protein and IMPA1 were incubated in PBS in the presence and absence 0.5-mM protein cross-linker DSS, and then subjected to SDS-PAGE followed by Western blot analysis. The same amount of proteins was used in all experiments and loaded in all lanes. a Blot probed for S100B. This protein under reducing conditions exists as a monomer (M) of 11 kDa, a dimer (D), and as a multimer. b Blot reprobed for IMPA1. IMPA1 normally exists as a dimer, but under reducing conditions appear as a monomer with approximate molecular weight of 30 kDa (black arrow); c overexposed blot a showing higher molecular weight S100B band corresponding to IMPA1 dimer in b. Blue arrows in a and b indicate the position of S100B. d Western blot of S100B showing co-immunoprecipitated S100B with IMPA1 (lane 2). IMPA1 antibody bound to protein A agarose beads was used to co-immunoprecipitate S100B from IMPA1–S100B protein mixture as described in the “Materials and Methods” section. Lane 1 shows standard S100B protein. Lane 3 Instead of IMPA1 antibody, control serum was used
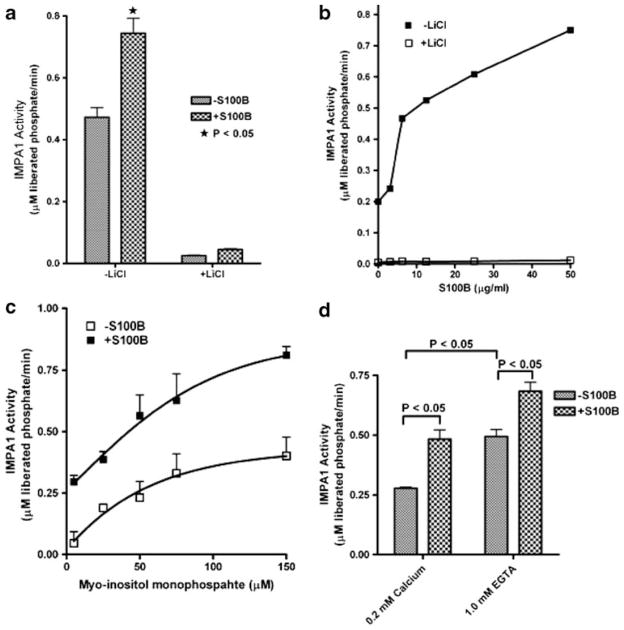
Further, S100B activated IMPA1 as the activity of IMPA1 was enhanced by the presence of S100B (Fig. 9). Using the chromophoric assay, the IMPA1 activity was measured in the presence of 2 mM Mg2+ and 1 mM EGTA to avoid pertubations from Ca2+ ions. To determine the effects of Ca2+, some assays were performed in the absence of EGTA. The stimulation of IMPA1 activity by S100B was sensitive to lithium (Fig. 9a, b). IMPA1 activation by S100B occurred at lower substrate concentrations (Fig. 9c) and also occurred both in calcium-dependent and -independent manner (Fig. 9d). Experiments to determine if S100B competes for the CaB binding site on IMPA1 are currently being pursued.
Fig. 9.
Activation of brain IMPA1 by S100B under different experimental conditions. Purified bovine brain S100B and IMPA1 were used in the activity assays. Non-specific IMPA1 activity was measured in the presence of high concentrations of LiCl (60 mM). a Activity in the presence and absence of S100B; b activity in the presence of various concentrations of S100B; c substrate-dependent activity in the presence and absence of S100B; d calcium-dependent and -independent activity in the presence and absence of S100B. Note in d, IMPA1 activity is significantly inhibited in the presence of high calcium. The data presented in a, c, and d are the mean±SE of three independent experiments (n=3) performed in duplicates. Statistical significance was calculated using GraphPad Prism, unpaired Student’s t test for independent samples, version 4.0 (GraphPad Software). A value of P<0.05 was accepted as statistically significant
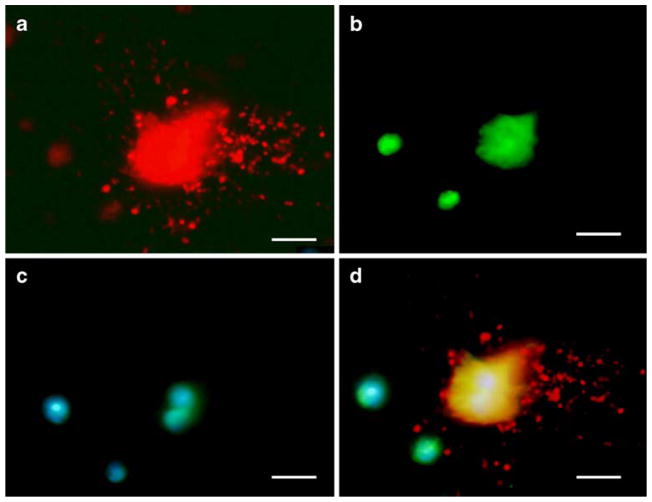
Since activation of IMPA1 by S100B is only possible unless S100B is internalized in PCs, we investigated if exogenous S100B protein interacts with PCs in vitro. PC-enriched cultures were prepared from the cerebella of 0- to 1-day-old wild-type mouse pups. PCs were identified by size, asymmetric arbors, immunoreactivity to CaB, and failure to express GFAP (Fig. 10). Purified S100B protein was labeled with the fluorescent dye Oregon Green. Fifteen-day-old cultures were incubated overnight with either tagged S100B protein or free dye. PCs internalized S100B, even to their nuclei (Fig. 10). S100B fluorescence was detected in PCs as early as 2 h post-incubation. Free dye, however, was not internalized (not shown). Internalization of S100B in PCs suggests that S100B may be associated with normal PC–BG cross-talk.
Fig. 10.
Cultured PC showing CaB immunostaining (a) and S100B fluorescence (b) in 15-day-old cultures. PC-enriched cultures were prepared from the cerebella of 0- to 1-day-old wild-type mouse pups. PCs were identified by size, asymmetric arbors, immunoreactivity to CaB, and failure to express glial fibrillary acidic protein. In this preparation, cultures were incubated overnight with Oregon Green-tagged S100B protein (500 ng/ml). CaB-positive PC shows internalized S100B. c DAPI (staining nuclei) and d merged image of a, b, and c. Bars=10 μm
Discussion
Cytoplasmic vacuolar development in PCs of B05 line of SCA1 mice is an early morphologic event, which precedes ataxin-1 inclusion formation [7, 8]. It is not fully understood why increased expression of mutant ataxin-1 results in the formation of cytoplasmic vacuoles. However, they are definitely associated with the disease process as they are formed only when mutant ataxin-1 (with expanded repeats) is expressed both in mouse model and human patients (Figs. 1 and 2). Furthermore, no vacuoles were seen in wild-type animals and A02 transgenic line with normal CAG repeats [8].
The appearance of BG proteins in the vacuoles, especially S100B, coincides with the degenerative changes in dendritic spines of SCA1 PCs. Neurotoxic effects of S100B and its role in neurodegenerative diseases are well-documented. Increased S100B levels may be caused by secreted S100B or release from damaged astrocytes [19, 23, 24]. In animal studies, changes in the cerebral concentration of S100B cause behavioral disturbances and cognitive deficits [19]. Based on the data presented in this manuscript, we speculate that glial cells may have an important role in SCA1 pathogenesis. Further, our recent observations of the cerebellar gene expression profiling in 2-week-old wild-type and SCA1 mice using Affymetrix microarrays showed a dysregulation of genes involved in BG–PC interactions (unpublished data).
Besides S100B, vimentin was also localized to PC vacuoles. Vimentin belongs to the family of intermediate filament (IF) proteins. In BG of the cerebellum, vimentin and GFAP constitute the structural support of IF [37, 38]. Vimentin may also have a functional role in BG because in vimentin null mice, loss of vimentin results in impaired motor coordination and PC degeneration [39, 40]. Translocation of vimentin to PC vacuoles suggests that BG may play a role in SCA1 pathogenesis. S100B is known to regulate IF and microtubule dynamics. The S100B protein binds to GFAP and vimentin and inhibits their phosphorylation [41]. Furthermore, Sorci and co-workers [42] reported that S100B causes disassembly of IF, and S100B-dependent microtubule disassembly results in a tendency of vimentin IF to aggregate into bundles and/or to condense. Since PC vacuoles contain both S100B and vimentin, we speculate that similar mechanism may be associated with vacuole formation in SCA1.
Throughout the development of the cerebellar cortex, PCs interact closely with BG [9, 43]. Lordkipanidze and Dunaevsky [44] analyzed the pattern of growth of PC dendrites and reported that vertical growth of PC dendrites occurs primarily in alignment with BG processes, and BG processes provide structural substrates in the form of cell adhesion molecules for the directional growth of PC dendrites. The specificity of S100B and IMPA1 localization to vacuoles indicates that the vacuoles are not formed due to bulk internalization of extra-or intracellular material. Changes in LC3-II/(LC3-I + LC3-II) ratios, however, suggest that some autophagic process might be responsible for the vacuole formation. Alternatively, it could also be argued that S100B is released by degenerating Bergmann glia [19, 23, 24]. In SCA7 mice, PC abnormalities develop due to the expression of polyglutamine-expanded protein in the BG, further suggesting that dysfunctional BG could cause PC degeneration [45].
IMPA1 is the most abundant monophosphatases in the cerebellum [27], and its activity is sensitive to lithium. IMPA1 hydrolyzes IMP to produce phosphate and myo-inositol, the starting material for synthesis of PI, as well as phosphatidylinositol mono- and di-phosphates (PIP and PIP2), and subsequently IP3. IMPA1 hence acts in the biosynthetic pathway leading from IMP to IP3. IP3 is an agonist of the IP3 receptor, which is a Ca2+ channel in the endoplasmic reticulum. IP3 may stimulate the release of Ca2+ from the endoplasmic reticulum store to increase the cytosolic Ca2+ levels, although the action of both IP3 and Ca2+ on the IP3 receptor is intricately coupled. The released Ca2+ ions bind to a number of Ca2+ sensor proteins, e.g., calmodulin, leading to the activation of a vast number of enzymes and cellular events. IP3 is short-lived and rapidly depleted if not newly synthesized; its half-life in neuronal cells may be as short as 100 ms. The enzymatic activity of IMPA1 is therefore required to sustain the PI signaling pathway. The stimulatory effect of S100B on IMPA1 activity is apparently not regulated directly by Ca2+ because IMPA1 is activated by S100B both in the absence and presence of Ca2+ (Fig. 9d). This is in striking contrast to the calmodulin system where target enzyme regulation is Ca2+-dependent. The calcium-binding protein CaB also activates IMPA1 both in vitro [46] and in situ in the dendritic spines of PCs [27, 28]. Given the importance of IP3-mediated Ca2+ signaling for synaptic integration and plasticity in PCs, the CaB–IMPase interaction is strategically placed at the site of metabotropic signaling. Co-localization of S100B and IMPA1 to the vacuoles, interaction between these two proteins, and internalization of S100B in PCs in vitro suggest that S100B may be associated with normal PC–BG cross-talk.
The CaB gene expression is known to be upregulated during cell stress [47, 48]. However, we reported earlier that both CaB and parvalbumin are downregulated in SCA1 mice [33]. Further, we demonstrated that CaB interacts with non-aggregated form of ataxin-1 and is recruited to ataxin-1 aggregates in PCs [35, 49]. Therefore, we speculate that in SCA1 a decrease in CaB levels and sustained activation of IMPA1 by S100B may dysregulate the inositol signaling system. Whether this sustained activation results in degeneration of BG (process)–PC (spine) interface leading to vacuolar formation requires further investigation.
Conclusion
This study shows that cytoplasmic vacuoles in PCs in SCA1 contain S100B and vimentin proteins, which normally localize to BG. Further, vacuolar formation is associated with alterations in the morphology of dendritic spines of PCs and may be developing via autophagic mechanism. S100B and IMPA1 co-localize to these vacuoles, and IMPA1 is an activated target of S100B. Another binding partner of IMPA1 is CaB, which is required for the localization of IMPase in spines and dendrites of PCs. Since CaB is downregulated in PCs of SCA1, the results of the present study suggest that CaB-regulated inositol signaling pathway may be modulated by sustained activation of IMPA1 via glial S100B. The discovery of S100B as a potential cellular activator of IMPA1 could be of interest in the development of novel pharmacological treatments for SCA1 or other related ataxias. Substances may be constructed that attenuate the activity of IMPA1 based on its interaction with S100B, for example, by competing with either protein for binding to the other one, by altering the affinity of S100B for IMPA1, by altering rates of association and dissociation of the two proteins, or by otherwise affecting its ability to regulate IMPA1.
Acknowledgments
This work was supported by grants from the National Institute of Neurological Disorders and Stroke and National Ataxia Foundation, USA.
References
- 1.Zoghbi HY, Orr HT. Glutamine repeats and neurodegeneration. Annu Rev Neurosci. 2000;23:217–247. doi: 10.1146/annurev.neuro.23.1.217. [DOI] [PubMed] [Google Scholar]
- 2.Koeppen AH. The pathogenesis of spinocerebellar ataxia. Cerebellum. 2005;4:62–73. doi: 10.1080/14734220510007950. [DOI] [PubMed] [Google Scholar]
- 3.Matilla-Dueñas A, Goold R, Giunti P. Clinical, genetic, molecular, and pathophysiological insights into spinocerebellar ataxia type 1. Cerebellum. 2008;7:106–114. doi: 10.1007/s12311-008-0009-0. [DOI] [PubMed] [Google Scholar]
- 4.Orr HT, Chung M-Y, Banfi S, Kwiatkowski TJ, Jr, Servadio A, Beaudet AL, et al. Expansion of an unstable trinucleotide CAG repeat in spinocerebellar ataxia type 1. Nat Genet. 1993;4:221–226. doi: 10.1038/ng0793-221. [DOI] [PubMed] [Google Scholar]
- 5.Banfi S, Servadio A, Chung MY, Kwiatkowski TJ, Jr, McCall AE, Duvick LA, et al. Identification and characterization of the gene causing type 1 spinocerebellar ataxia. Nat Genet. 1994;7:513–520. doi: 10.1038/ng0894-513. [DOI] [PubMed] [Google Scholar]
- 6.Burright EN, Clark HB, Servadio A, Matilla T, Feddersen RM, Yunis WS, et al. SCA-1 transgenic mice: a model for neurodegeneration caused by an expanded CAG trinucleotide repeat. Cell. 1995;82:937–948. doi: 10.1016/0092-8674(95)90273-2. [DOI] [PubMed] [Google Scholar]
- 7.Skinner PJ, Vierra-Green CA, Clark HB, Zoghbi HY, Orr HT. Altered trafficking of membrane proteins in Purkinje cells of SCA1 transgenic mice. Am J Pathol. 2001;159:905–913. doi: 10.1016/S0002-9440(10)61766-X. [DOI] [PMC free article] [PubMed] [Google Scholar]
- 8.Vig PJS, Lopez ME, Wei J, D’Souza DR, Subramony SH, Henegar J, et al. Glial S100B positive vacuoles in Purkinje cells: earliest morphological abnormality in SCA1 transgenic mice. J Neurol Sci [Turk] 2006;23:166–174. doi: 10.1901/jaba.2006.23-166. [DOI] [PMC free article] [PubMed] [Google Scholar]
- 9.Yamada K, Watanabe M. Cytodifferentiation of Bergmann glia and its relationship with Purkinje cell. Anat Sci Int. 2002;2:94–108. doi: 10.1046/j.0022-7722.2002.00021.x. [DOI] [PubMed] [Google Scholar]
- 10.Pakhotin P, Verkhratsky A. Electrical synapses between Bergmann glial cells and Purkinje neurones in rat cerebellar slices. Mol Cell Neurosci. 2005;28:79–84. doi: 10.1016/j.mcn.2004.08.014. [DOI] [PubMed] [Google Scholar]
- 11.Slemmer JE, De Zeeuw CI, Weber JT. Don’t get too excited: mechanisms of glutamate-mediated Purkinje cell death. Prog Brain Res. 2005;148:367–390. doi: 10.1016/S0079-6123(04)48029-7. [DOI] [PubMed] [Google Scholar]
- 12.Donato R. Perspectives in S-100 protein biology. Cell Calcium. 1991;12:713–726. doi: 10.1016/0143-4160(91)90040-l. [DOI] [PubMed] [Google Scholar]
- 13.Donato R. S100: a multigenic family of calcium-modulated proteins of the EF-hand type with intracellular and extracellular functional roles. Int J Biochem Cell Biol. 2001;33:637–668. doi: 10.1016/s1357-2725(01)00046-2. [DOI] [PubMed] [Google Scholar]
- 14.Zimmer DB, Chaplin J, Baldwin A, Rast M. S100-mediated signal transduction in the nervous system and neurological diseases. Cell Mol Biol. 2005;51:201–214. [PubMed] [Google Scholar]
- 15.Custer SK, Garden GA, Gill N, Rueb U, Libby RT, Schultz C, et al. Bergmann glia expression of polyglutamine-expanded ataxin-7 produces neurodegeneration by impairing glutamate transport. Nat Neurosci. 2006;9:1302–1311. doi: 10.1038/nn1750. [DOI] [PubMed] [Google Scholar]
- 16.Donato R. Functional roles of S100 proteins, calcium-binding proteins of the EF-hand type. Biochim Biophys Acta. 1999;1450:191–231. doi: 10.1016/s0167-4889(99)00058-0. [DOI] [PubMed] [Google Scholar]
- 17.Reeves RH, Yao J, Crowley MR, Buck S, Zhang X, Yarowsky P, et al. Astrocytosis and axonal proliferation in the hippocampus of S100b transgenic mice. Proc Natl Acad Sci U S A. 1994;91:5359–5363. doi: 10.1073/pnas.91.12.5359. [DOI] [PMC free article] [PubMed] [Google Scholar]
- 18.Huttunen HJ, Kuja-Panula J, Sorci G, Agneletti AL, Donato R, Rauvala H, et al. Coregulation of neurite outgrowth and cell survival by amphoterin and S100 proteins through receptor for advanced glycation end products (RAGE) activation. J Biol Chem. 2000;275:40096–40105. doi: 10.1074/jbc.M006993200. [DOI] [PubMed] [Google Scholar]
- 19.Rothermundt M, Peters M, Prehn JH, Arolt V. S100B in brain damage and neurodegeneration. Microsc Res Tech. 2003;60:614–632. doi: 10.1002/jemt.10303. [DOI] [PubMed] [Google Scholar]
- 20.Winningham-Major F, Staecker JL, Barges SW, Coats S, VanElkik J. Neurite extension and neuronal survival activities of recombinant S100β proteins that differ in the content and position of cysteine residues. J Cell Biol. 1989;109:3064–3071. doi: 10.1083/jcb.109.6.3063. [DOI] [PMC free article] [PubMed] [Google Scholar]
- 21.Barger SW, VanEldik LJ, Mattson MP. S100β protects hippocampal neurons from damage induced by glucose deprivation. Brain Res. 1995;677:167–170. doi: 10.1016/0006-8993(95)00160-r. [DOI] [PubMed] [Google Scholar]
- 22.Whitaker-Azmitia PM, Vingate M, Borella A, Gerlai R, Roder J, Azmitia EC. Transgenic mice overexpressing the neuro-trophic factor S-100β show neuronal cytoskeletal and behavioral signs of altered aging processes: implications for Alzheimer’s disease and Down’s syndrome. Brain Res. 1997;776:51–60. doi: 10.1016/s0006-8993(97)01002-0. [DOI] [PubMed] [Google Scholar]
- 23.Griffin WS, Stanley LC, Ling C, White L, MacLeod V, Perrot LJ, et al. Brain interleukin 1 and S-100 immunoreactivity are elevated in Down syndrome and Alzheimer disease. Proc Natl Acad Sci U S A. 1989;86:7611–7615. doi: 10.1073/pnas.86.19.7611. [DOI] [PMC free article] [PubMed] [Google Scholar]
- 24.Kato K, Suzuki F, Kurobe N, Okajima K, Ogasawara N, Nagaya M, et al. Enhancement of S-100β protein in blood of patients with Down’s syndrome. J Mol Neurosci. 1990;2:109–113. doi: 10.1007/BF02876918. [DOI] [PubMed] [Google Scholar]
- 25.McClintock KA, Shaw GS. A logical sequence search for S100B target proteins. Protein Sci. 2000;10:2043–2046. doi: 10.1110/ps.9.10.2043. [DOI] [PMC free article] [PubMed] [Google Scholar]
- 26.Wilder PT, Lin J, Bair CL, Charpentier TH, Yang D, Liriano M, et al. Recognition of the tumor suppressor protein p53 and other protein targets by the calcium-binding protein S100B. Biochim Biophys Acta. 2006;1763:1284–1297. doi: 10.1016/j.bbamcr.2006.08.024. [DOI] [PubMed] [Google Scholar]
- 27.Ohnishi T, Ohba H, Seo KC, Im J, Sato Y, Iwayama Y, et al. Spatial expression patterns and biochemical properties distinguish a second myo-inositol monophosphatase IMPA2 from IMPA1. J Biol Chem. 2007;282:637–646. doi: 10.1074/jbc.M604474200. [DOI] [PubMed] [Google Scholar]
- 28.Schmidt H, Schwaller B, Eilers J. Calbindin D28k targets myo-inositol monophosphatase in spines and dendrites of cerebellar Purkinje neurons. Proc Natl Acad Sci U S A. 2005;120:5850–5855. doi: 10.1073/pnas.0407855102. [DOI] [PMC free article] [PubMed] [Google Scholar]
- 29.Sarkar S, Floto RA, Berger Z, Imarisio S, Cordenier A, Pasco M, et al. Lithium induces autophagy by inhibiting inositol mono-phosphatase. J Cell Biol. 2005;170:1101–1111. doi: 10.1083/jcb.200504035. [DOI] [PMC free article] [PubMed] [Google Scholar]
- 30.Sarkar S, Rubinsztein DC. Inositol and IP3 levels regulate autophagy: biology and therapeutic speculations. Autophagy. 2006;2:132–134. doi: 10.4161/auto.2387. [DOI] [PubMed] [Google Scholar]
- 31.Tomomura M, Rice DS, Morgan JI, Yuzaki M. Purification of Purkinje cells by fluorescence-activated cell sorting from transgenic mice that express green fluorescent protein. Eur J Neurosci. 2001;14:57–63. doi: 10.1046/j.0953-816x.2001.01624.x. [DOI] [PubMed] [Google Scholar]
- 32.Vig PJS, Fratkin JD, Desaiah D, Currier RD, Subramony SH. Decreased parvalbumin immunoreactivity in surviving Purkinje cells of patients with spinocerebellar ataxia-1. Neurology. 1996;47:249–253. doi: 10.1212/wnl.47.1.249. [DOI] [PubMed] [Google Scholar]
- 33.Vig PJS, Subramony SH, Burright EN, Fratkin JD, McDaniel DO, Desaiah D, et al. Reduced immunoreactivity to calcium-binding proteins in Purkinje cells precedes onset of ataxia in spinocerebellar ataxia-1. Neurology. 1998;50:106–113. doi: 10.1212/wnl.50.1.106. [DOI] [PubMed] [Google Scholar]
- 34.Vig PJS, Wei J, Shao Q, Hebert MD, Subramony SH, Sutton LT. Role of tissue transglutaminase type 2 in calbindin-D28k interaction with ataxin-1. Neurosci Lett. 2007;420:53–57. doi: 10.1016/j.neulet.2007.04.005. [DOI] [PMC free article] [PubMed] [Google Scholar]
- 35.Vig PJS, McDaniel DO, Subramony SH, Qin Z. The effects of calbindin D-28k and parvalbumin antisense olivonucleotides on the survival of cultured Purkinje cells. Res Commun Mol Pathol Pharmacol. 1999;103:249–259. [PubMed] [Google Scholar]
- 36.Mizushima N, Yoshimori T. How to interpret LC3 immunoblotting. Autophagy. 2007;3:542–545. doi: 10.4161/auto.4600. [DOI] [PubMed] [Google Scholar]
- 37.Dahl D. The vimentin-GFA protein transition in rat neuroglia cytoskeleton occurs at the time of myelination. J Neurosci Res. 1981;6:741–748. doi: 10.1002/jnr.490060608. [DOI] [PubMed] [Google Scholar]
- 38.Shaw G, Osborn M, Weber K. An immunofluorescence microscopical study of the neurofilament triplet proteins, vimentin and glial fibrillary acidic protein within the adult rat brain. Eur J Cell Biol. 1981;26:68–82. [PubMed] [Google Scholar]
- 39.Galou M, Colucci-Guyon E, Ensergueix D, Ridet JL, Gimenez Y, Ribotta M, et al. Disrupted glial fibrillary acidic protein network in astrocytes from vimentin knockout mice. J Cell Biol. 1996;133:853–863. doi: 10.1083/jcb.133.4.853. [DOI] [PMC free article] [PubMed] [Google Scholar]
- 40.Colucci-Guyon E, Gimenez Y, Ribotta M, Maurice T, Babinet C, Privat A. Cerebellar defect and impaired motor coordination in mice lacking vimentin. Glia. 1999;25:33–43. [PubMed] [Google Scholar]
- 41.Ziegler DR, Innocente CE, Leal RB, Rodnight R, Goncalves CA. The S100B protein inhibits phosphorylation of GFAP and vimentin in a cytoskeletal fraction from immature rat hippocampus. Neurochem Res. 1998;23:1259–1263. doi: 10.1023/a:1020740115790. [DOI] [PubMed] [Google Scholar]
- 42.Sorci G, Agneletti AL, Donato R. Effects of S100A1 and S100B on microtubule stability. An in vitro study using triton-cytoskeletons from astrocyte and myoblast cell lines. Neurosci. 2000;99:773–783. doi: 10.1016/s0306-4522(00)00238-4. [DOI] [PubMed] [Google Scholar]
- 43.Bellamy TC. Interactions between Purkinje neurones and Bergmann glia. Cerebellum. 2006;5:116–126. doi: 10.1080/14734220600724569. [DOI] [PubMed] [Google Scholar]
- 44.Lordkipanidze T, Dunaevsky A. Purkinje cell dendrites grow in alignment with Bergmann glia. Glia. 2005;51:229–234. doi: 10.1002/glia.20200. [DOI] [PubMed] [Google Scholar]
- 45.Gordon GA, Libby RT, Fu Y-H, Kinoshita Y, Huatag J, Possin DE, et al. Polyglutamine-expanded ataxin- promotes non-cell-autonomous Purkinje cell degeneration and displays proteolytic cleavage in ataxic transgenic mice. J Neurosci. 2002;22:4897–4905. doi: 10.1523/JNEUROSCI.22-12-04897.2002. [DOI] [PMC free article] [PubMed] [Google Scholar]
- 46.Berggard T, Szczepankiewicz O, Thulin E, Linse S. Myo-inositol monophosphatase is an activated target of calbindin D28k. J Biol Chem. 2002;277:41954–41959. doi: 10.1074/jbc.M203492200. [DOI] [PubMed] [Google Scholar]
- 47.Lowenstein DH, Miles MF, Hatam F, McCabe T. Up regulation of calbindin-D28K mRNA in the rat hippocampus following focal stimulation of the perforant path. Neuron. 1991;6:627–633. doi: 10.1016/0896-6273(91)90065-8. [DOI] [PubMed] [Google Scholar]
- 48.Lowenstein DH, Gwinn RP, Seren MS, Simon RP, McIntosh TK. Increased expression of mRNA encoding calbindin-D28K, the glucose-regulated proteins, or the 72 kDa heat-shock protein in three models of acute CNS injury. Brain Res Mol Brain Res. 1994;22:299–308. doi: 10.1016/0169-328x(94)90058-2. [DOI] [PubMed] [Google Scholar]
- 49.Vig PJS, Subramony SH, Qin Z, McDaniel DO, Fratkin J. Relationship between ataxin-1 nuclear inclusions and Purkinje cell specific proteins in SCA-1 transgenic mice. J Neurol Sci. 2000;174:100–110. doi: 10.1016/s0022-510x(00)00262-8. [DOI] [PubMed] [Google Scholar]


