

Abstract
The phthalocyanine photosensitizer Pc 4 has been shown to bind preferentially to mitochondrial and endoplasmic reticulum membranes. Upon photoirradiation of Pc 4-loaded cells, membrane components, especially Bcl-2, are photodamaged and apoptosis, as indicated by activation of caspase-3 and cleavage of poly(ADP-ribose) polymerase, is triggered. A series of analogs of Pc 4 were synthesized, and the results demonstrate that Pcs with the aminopropylsiloxy ligand of Pc 4 or a similar one on one side of the Pc ring and a second large axial ligand on the other side of the ring have unexpected properties, including enhanced cell uptake, greater monomerization resulting in greater intracellular fluorescence and three-fold higher affinity constants for liposomes. The hydroxyl-bearing axial ligands tend to reduce aggregation of the Pc and direct it to lysosomes, resulting in four to six times more killing of cells, as defined by loss of clonogenicity, than with Pc 4. Whereas Pc 4-PDT photodamages Bcl-2 and Bcl-xL, Pc 181-PDT causes much less photodamage to Bcl-2 over the same dose–response range relative to cell killing, with earlier cleavage of Bid and slower caspase-3-dependent apoptosis. Therefore, within this series of photosensitizers, these hydroxyl-bearing axial ligands are less aggregated than is Pc 4, tend to localize to lysosomes and are more effective in overall cell killing than is Pc 4, but induce apoptosis more slowly and by a modified pathway.
INTRODUCTION
Photodynamic therapy (PDT), a treatment for cancer and certain noncancerous conditions, involves the systemic, oral, or topical administration of a photosensitizing drug, followed after a suitable time for accumulation of the drug in the target cells or tissue by photoirradiation with light of a wavelength absorbed by the photosensitizer. The photodynamic mechanism results in the generation of singlet oxygen (1O2) and/or other reactive oxygen species (ROS) which oxidize tissue biomolecules, creating an oxidative stress and killing the treated cells.
The subcellular localization of a photosensitizer is believed to be a primary determinant of the site of the initial photodynamic damage during PDT (reviewed in Oleinick et al. [1]), which in turn can determine the early signaling pathways that are activated and the cell killing mechanism. For example, PDT mediated by a mitochondrion/endoplasmic reticulum (ER)-targeted photosensitizer has been shown to dissipate the mitochondrial membrane potential (2,3), while alternatively, PDT with a lysosome-targeted photosensitizer has been shown to cause the release of proteolytic lysosomal enzymes (4). Although it is possible to kill cells with PDT using photosensitizers that localize at any cellular site, in general photosensitizers that target mitochondria are thought to be the most efficient at generating photocytotoxicity, possibly because they directly induce apoptosis (1).
Phthalocyanines (Pcs) have been studied by our group for a number of years, especially Pc 4, which has been brought to clinical trial for several types of skin tumors (5). Pc 4 (Fig. 1) is a silicon Pc bearing a dimethylaminopropylsiloxy ligand on the central silicon. With the goal of understanding structural features of Pc 4 that make it an efficient photosensitizer, over 250 analogs have been synthesized, and some of these have been studied for their photophysical, photobiological and phototherapeutic effects (6–8).
Figure 1.

Structures of the phthalocyanines.
A recent series of analogs has included Pcs bearing two Pc 4-type ligands (Pc 12) or a Pc 4-type ligand and various hydroxylated substituents (Pc 135, Pc 161 and Pc 181; for structures see Fig. 1). Study of these analogs has focused on four properties: their uptake into cells, their sites of localization within the cells, their relative ability to kill cells in a PDT protocol and aspects of the mechanism by which the different Pcs act. Two features are of particular interest: the relatively greater degree of monomerization of those Pcs bearing two axial ligands, and the preferential localization of the Pcs with hydroxylated ligands to lysosomes. Unexpectedly, the lysosome-targeted Pcs were found to be more efficient photosensitizers for cells in vitro than those with preferential binding to mitochondria and ER. Differences in physical, photophysical and biochemical properties of PDT with these photosensitizers provide insight into the reasons for the differential photocytotoxicity observed.
MATERIALS AND METHODS
Synthesis of new phthalocyanines
Syntheses of Pc 4 and Pc 12 have been described previously (6,7). Structures are shown in Fig. 1.
CH3CH2OSi(CH3)2(CH2)3OC(O)CH3, 1
A mixture of dimethylethoxysilane (8.0 g), allyl acetate (2.0 g) and platinum-divinyltetramethyldisiloxane complex (Karstedt’s catalyst, ~2% Pt in xylene solution, Gelest, 0.1 mL) was stirred at room temperature for 24 h. The reaction mixture was purged with Ar, evaporated to an oil by rotary evaporation (<35°C) and weighed (3.8 g, 94%). NMR (CDCl3): δ 4.03 (t, 2H, (CH2)2CH2O), 3.66 (q, 2H, OCH2CH3), 2.05 (s, 3H, C(O)CH3), 1.64 (m, 2H, CH2CH2CH2O), 1.19 (t, 3H, OCH2CH3), 0.60 (m, 2H, CH2(CH2)2O), 0.12 (s, 6H, SiCH3).
1 is a light brown liquid. It is soluble in CH2Cl2, dimethylformamide, toluene and hexanes.
SiPc[OSi(CH3)2(CH2)3N(CH3)2][OSi(CH3)2(CH2)3OC(O)CH3], Pc 134, 2
Under Ar, a mixture of silane 1 (1.42 g), CH3OSi( CH3)2(CH2)3N(CH3)2 (distilled, 852 mg), SiPc(OH)2 (400 mg) and pyridine (200 mL) was slowly distilled (~150 mL distillate) for 3 h, and evaporated to dryness by rotary evaporation (30°C) (6). The solid was dissolved in ethanol (3 mL), recovered by the addition of H2O (3 mL) and filtration, washed (ethanol-H2O solution, 1:1), chromatographed (basic Al2O3 III, CH2Cl2-ethyl acetate solution, 2:1), vacuum dried (room temperature) and weighed (286 mg, 47%). UV–Vis (toluene) λmax, nm (log ε): 668 (5.7). NMR (CDCl3): δ 9.63 (m, 8H, 1,4-Pc H), 8.32 (m, 8H, 2,3-Pc H), 2.64 (t, 2H, C2H4CH2O), 1.69 (s, 3H, C(O)CH3), 1.65 (s, 6H, NCH3), 0.91 (t, 2H, C2H4CH2N), −1.04 (m, 4H, CH2CH2CH2N and CH2CH2CH2O), −2.30 (m, 4H, CH2C2H4N and CH2C2H4O), −2.87 and −2.89 (s, 12H, SiCH3). HRMS-FAB (m/z): [M + H]+ calcd with M as C46H49N9O4Si3, 876.3294; found, 876.3268, 876.3287.
2 is a blue solid. It is soluble in CH2Cl2, dimethylformamide, toluene, and slightly soluble in hexanes.
SiPc[OSi(CH3)2(CH2)3N(CH3)2][OSi(CH3)2(CH2)3OH], Pc 135, 3
A mixture of Pc 2 (266 mg), NaOCH3 (246 mg), CH3OH (25 mL) and tetrahydrofuran (80 mL) was stirred at room temperature for 2 h, concentrated (to ~20 mL) by rotary evaporation (room temperature), treated with H2O (100 mL), and extracted with CH2Cl2 four times (80 mL each time). The extracts were combined, dried (Na2SO4) and evaporated to dryness by rotary evaporation (30°C), and the solid was chromatographed twice (basic Al2O3 III, CH2Cl2-ethyl acetate solution, 1:1), dissolved in CH2Cl2 (2 mL), recovered by the addition of hexanes (8 mL) and filtration, washed (hexanes), vacuum dried (room temperature) and weighed (196 mg, 77%). UV–Vis (toluene) λmax, nm (log ε): 668 (5.4). NMR (CDCl3): δ 9.63 (m, 8H, 1,4-Pc H), 8.32 (m, 8H, 2,3-Pc H), 2.10 (t, 2H, (CH2)2CH2O), 1.62 (s, 6H, NCH3), 0.88 (t, 2H, (CH2)2CH2N), −1.07 (m, 4H, CH2CH2CH2N and CH2CH2CH2O), −2.30 (m, 4H, CH2(CH2)2N and CH2(CH2)2O), −2.87 and −2.88 (s, 12H, SiCH3). HRMS-FAB (m/z): [M + H]+ calcd with M as C44H48N9O3Si3, 834.3189; found, 834.3175, 834.3190.
3 is a blue solid. It is soluble in CH2Cl2, dimethylformamide and toluene, and insoluble in hexanes.
SiPc[OSi(CH3)2(CH2)3OC(O)CH3]2, Pc 269, 4
A mixture of silane 1 (1.00 g), SiPc(OH)2 (120 mg) and pyridine (180 mL) was slowly distilled (~120 mL of distillate) for 30 min, concentrated to a slurry by rotary evaporation (<35°C), diluted with an ethanol-H2O solution (2:1, 30 mL) and filtered. The solid was washed (ethanol-H2O solution, 2:1), chromatographed (neutral Al2O3 III, CH2Cl2-hexanes solution, 2:1), recrystallized (CH2Cl2-hexanes solution, 1:10), washed (hexanes), dried and weighed (73 mg, 39%). UV–Vis (toluene) λmax, nm (log ε): 669 (5.6). NMR (CDCl3): δ 9.65 (m, 8H, 1,4-Pc H), 8.35 (m, 8H, 2,3-Pc H), 2.66 (t, 4H, (CH2)2CH2O), 1.72 (s, 6H, C(O)CH3), −1.02 (m, 4H, CH2CH2CH2O), −2.30 (m, 4H, CH2(CH2)2O), −2.85 (s, 12H, SiCH3).
4 is a blue solid. It is soluble in CH2Cl2, dimethylformamide and toluene, and slightly soluble in hexanes.
SiPc[OSi(CH3)2(CH2)3OH][OSi(CH3)2(CH2)3NH2], Pc 161, 5
A solution of Pc 4 (302 mg) and a solution of trichloroacetic acid in CH2Cl2 (0.0204 M, 75.0 mL) was stirred at room temperature for 5 h, treated with H2O (150 mL) and separated. The aqueous layer was washed (CH2Cl2), and the washings and the organic layer were combined and evaporated to dryness by rotary evaporation (room temperature). Under vacuum, a mixture of the solid and CH3CH2OSi(CH3)2(CH2)3NH2 (350 mg) was warmed (60°C) for 11 h, washed (CH3CN) and air dried. The solid was dissolved in tetrahydrofuran (110 mL), and the solution was treated with a solution of NaOCH3 (250 mg) and CH3OH (20 mL) for 2 h, concentrated to a suspension by rotary evaporation (room temperature) and washed (H2O). The H2O washings were washed (CH2Cl2), and the CH2Cl2 washings and the product were combined and concentrated to a suspension by rotary evaporation (room temperature). The suspension was chromatographed (neutral Al2O3 V, CH2Cl2-toluene-CH3CN solution, 5:5:1), and the solid obtained was washed (CH3CN), vacuum dried (room temperature) and weighed (42 mg, 14%). UV–Vis (toluene) λmax, nm (log ε): 669 (5.4). NMR (CDCl3): δ 9.63 (m, 8H, 1,4-Pc H), 8.34 (m, 8H, 2,3-Pc H), 2.11 (t, 2H, (CH2)2CH2O), 1.17 (t, 2H, (CH2)2CH2N), −1.05 (m, 2H, CH2CH2CH2O), −1.25 (m, 2H, CH2CH2CH2N), −2.30 (t, 2H, CH2(CH2)2O), −2.33 (t, 2H, CH2(CH2)2N), −2.87 and −2.88 (s, 12H, SiCH3). HRMS-FAB m/z: [M+Li]+ calcd with M as C42H43N9O2Si3, 812.2957; found, 812.2925, 812.2938.
5 is a blue solid. It is soluble in CH2Cl2, dimethylformamide and toluene, and insoluble in hexanes.
CH3OSi(CH3)2(CH2)4CH=CH2, 6
A cooled (ice bath) solution of hexynyldimethylchlorosiliane (4.08 g) and hexanes (40 mL, dried with molecular sieves, 4A) was treated dropwise with CH3OH (3.82 g, dried with molecular sieves, 4A), refluxed under N2 for 1 h, cooled, treated with triethylamine (3.49 g) and filtered. The filtrate was concentrated (to ~3 mL) by rotary evaporation (room temperature) and vacuum distilled. A selected fraction (90–105°C, 45 torr) was retained and weighed (2.07 g, 52%). NMR (CDCl3): 5.80 (m, 1H, (CH2)4CHCH2), 4.95 (t, 2H, (CH2)4CHCH2), 3.40 (s, 3H, OCH3), 2.05 (m, 2H, (CH2)3CH2CHCH2), 1.38 (m, 4H, CH2(CH2)2CH2CHCH2), 0.58 (t, 2H,CH2(CH2)3CHCH2), 0.07 (s, 6H, SiCH3).
6 is a colorless liquid. It is soluble in CH2Cl2, dimethylformamide, toluene and hexanes.
SiPc[OSi(CH3)2(CH2)4CH=CH2]2, Pc 270, 7
A mixture of silane 6 (1.93 g), SiPc(OH)2 (843 mg) and pyridine (90 mL) was heated (reflux) for 4 h, filtered and evaporated to dryness by rotary evaporation (40°C). The solid was washed (CH3CN, pentane), vacuum dried (60°C) and weighed (1.16 g, 93%). UV–Vis (toluene) λmax, (log ε), nm: 668 (5.6). NMR (CDCl3): δ 9.64 (m, 8H, 1,4-Pc H), 8.33 (m, 8H, 2,3-Pc H), 5.28 (m, 2H, (CH2)4CHCH2), 4.67 (m, 4H, (CH2)4CHCH2), 1.06 (m, 4H, (CH2)3CH2CHCH2), −0.09 (m, 4H, (CH2)2CH2CH2CHCH2), −1.31 (m, 4H, CH2CH2 (CH2)2CHCH2), −2.27 (m, 4H, SiCH2(CH2)3CHCH2), −2.88 (s, 12H, SiCH3).
7 is a blue solid. It is soluble in CH2Cl2, dimethylformamide and toluene, and insoluble in hexanes.
SiPc[OSi(CH3)2(CH2)3N(CH3)2][OSi(CH3)2(CH2)4CH=CH2], Pc 182, 8
Under N2, a mixture of Pc 7 (1.16 g), CH3OSi( CH3)2(CH2)3N(CH3)2 (741 mg) and pyridine (90 mL, dried by distillation with NaOH) was heated (reflux) for 4 h, filtered and evaporated to dryness by rotary evaporation (40°C). The solid was chromatographed (neutral Al2O3 V, CH2Cl2-ethyl acetate, 50:2), washed (CH3CN, pentane), vacuum dried (60°C) and weighed (275 mg, 23%). UV–Vis (toluene) λmax, nm (log ε): 668 (5.6). NMR (CDCl3): δ 9.65 (m, 8H, 1,4-Pc H), 8.30 (m, 8H, 2,3-Pc H), 5.28 (m, 1H, (CH2)4CHCH2), 4.64 (m, 2H, (CH2)4CHCH2), 1.56 (s, 6H, NCH3), 1.05 (m, 2H, (CH2)3CH2CHCH2), 0.81 (t, 2H, (CH2)2CH2N), −0.10 (m, 2H, (CH2)2CH2CH2CHCH2), −1.13 (m, 2H, CH2CH2CH2N), −1.33 (m, 2H, CH2CH2(CH2)2CHCH2), −2.28 (t, 4H, CH2CH2CH2N and CH2(CH2)3CHCH2), −2.89 (s, 12H, SiCH3). HRMS-FAB (m/z): [M-C7H18ONSi]+ calcd with M as C47H51N9O2− Si3, 697.2316; found, 697.2289.
8 is a blue solid. It is soluble in CH2Cl2, dimethylformamide, toluene, and insoluble in hexanes.
SiPc[OSi(CH3)2(CH2)3N(CH3)2][(OSi(CH3)2(CH2)4CHOHCH2 OH], Pc 181, 9
A mixture of Pc 8 (59 mg), AD-mix-α (contains (DHQ)2PHAL, K3Fe(CN)6, K2CO3, K2OsO4·2H2O, Aldrich, 166 mg), tetrahydrofuran (4 mL) and H2O (4 mL) was stirred for 60 h, treated with Na2SO3 (234 mg), stirred for 1 h, diluted with CH2Cl2 (15 mL) and separated. The organic layer was dried (MgSO4) and evaporated to dryness by rotary evaporation (40°C), and the solid was chromatographed (silica gel, dimethylformamide), rechromatographed (silica gel, CH2Cl2-CH3OH solution, 100:1), washed (CH3CN, pentane), vacuum dried (60°C) and weighed (22 mg, 36%). UV–Vis (toluene) λmax, nm (log ε): 669 (5.3). NMR (CDCl3): δ 9.61 (m, 8H, 1,4-Pc H), 8.35 (m, 8H, 2,3-Pc H), 3.24 (m, 1H, (CH2)4CHCH2), 3.18 (m, 2H, (CH2)4CHCH2), 1.57 (s, 6H, NCH3), 0.81 (t, 2H, (CH2)2CH2N), 0.42 (m, 2H, (CH2)3CH2CHCH2), −0.18 (m, 2H, (CH2)2CH2CH2CHCH2), −1.16 (m, 2H, CH2CH2CH2N), −1.35 (m, 2H, CH2CH2(CH2)2CHCH2), −2.23 (m, 2H, CH2(CH2)3CHCH2), −2.30 (t, 2H, CH2(CH2)2N), −2.88 (s, 12H, SiCH3). HRMS-FAB (m/z): [M+Li]+ calcd with M as C47H53N9O4−Si3, 898.3688; found, 898.3703, 898.3673.
9 is a blue solid. It is soluble in CH2Cl2 and dimethylformamide, slightly soluble in toluene and insoluble in hexanes.
Characterization of the phthalocyanines
The UV–Vis spectra were recorded with a Perkin-Elmer Lambda 25 UV–Vis spectrometer (Perkin-Elmer, Shelton, CT), and the NMR spectra were recorded with Gemini 300 MHz and INOVA 400 MHz spectrometers (Varian, Palo Alto, CA). The mass spectra were determined by an external laboratory (Washington University Resource for Biomedical and Bio-organic Mass Spectrometry, Washington University, St. Louis, MO).
Binding of phthalocyanines to liposomes
Stock solutions of Pcs were prepared in 1:1 THF/EtOH. The solutions were stored at 4°C and protected from ambient light. Large unilamellar vesicles (diameter ≅ 100 nm) were prepared with an Avanti Mini-Extrudor. Typically, an aliquot of lipid solution in absolute ethanol was evaporated under nitrogen to form a thin film of lipid. All excess ethanol was removed during evaporation. PBS (pH = 7.4, 0.1 M NaH2PO4, 0.1 M K2HPO4 and 0.15 M NaCl) was added to hydrate the film. Aliquots of the lipid suspensions were extruded 15 times at 15°C above the lipid transition temperature of DMPE, as the transition temperature of the mixture was estimated to be approximately that of DMPE or lower (Tc = 48°C) (9). The diameter of the unilamellar vesicles was determined on a Brookhaven Instruments Corporation 90 Plus Particle Sizing Analyzer.
Electronic absorption spectra were recorded on a Varian Cary 50 Bio UV–Vis Spectrophotometer. Fluorescence spectra were recorded on a Varian Cary Eclipse Fluorescence Spectrophotometer. Excitation wavelength was 610 nm (Q band), and the emission spectra were recorded between 620 and 800 nm. Measurements on liposomes were performed 15°C above the lipid transition temperature using a controlled temperature cell QS with 10 mm path length.
Binding measurements were made at a fixed Pc concentration of 6 μM and increasing liposome concentration from 0 mM to the concentration at which maximum association was attained. The association constants for the Pcs were calculated using Eq. (1) (10):
| (1) |
where Ka is the equilibrium association constant between the aggregated dye in the aqueous phase and the monomers in the membrane-bound phase, (F − F0)/(F∞ − F0) is the fraction of Pc associated with lipid L as monomer, F is the fluorescence measured after each addition of liposomes, F0 is the fluorescence measured in the absence of lipid, and F∞ is the fluorescence measured at the concentration in which maximum association with lipid is attained and [L] is the lipid concentration. All fluorescence values are those at the peak of the emission spectrum.
Fluorescence quantum yields were measured using the comparative method with Pc (PcH2) (φf = 0.60 in 1-chloronaphthalene [11]) as the reference. The fluorescence quantum yield was calculated using Eq. (2):
| (2) |
where subscripts R and S refer to the reference and sample, respectively, I is the integrated area under the emission spectrum, A is the absorbance of the solution at the excitation wavelength, and (nS/nR)2 is the refractive index correction. The refractive index of liposome in solution was assumed to be equal to that of an aqueous solution due to the low fraction of total volume taken up by lipid (approximately 1%). The absorbance at the excitation wavelength was <0.1 in all cases. The refractive index, n, for 1-chloronaphthalene used was 1.6326 (12).
Cell culture and photodynamic treatment
The MCF-7c3 human breast cancer cell line was used throughout this study. These cells were generated by Dr. Christopher J. Froehlich (Northwestern University, Evanston, IL) by transfection of the human CASP-3 gene into the normally procaspase-3-null MCF-7 cells. MCF-7c3 cells express high levels of procaspase-3 and, unlike the parental or vector-control transfectants, respond to Pc 4-PDT by undergoing efficient caspase-3-dependent apoptosis (13). The cells were grown in RPMI 1640 medium supplemented with 10% fetal bovine serum, 2 mM L-glutamine and 1% penicillin/streptomycin. Cultures were maintained in logarithmic growth in a humidified atmosphere of 5% CO2/95% air in a 37°C incubator. Cells used in experiments were 75–85% confluent.
Stock solutions of photosensitizers were prepared in DMF at 0.5 mM, from which further dilutions into growth medium were made as necessary, such that cells were never exposed to more than 0.1% DMF. The stock solutions were kept in the dark at 4°C and found to be stable for at least 6 months. Cells were exposed to the Pcs in complete growth medium overnight (18–20 h), after which the cultures were irradiated with red light using a light-emitting diode array (EFOS, Mississauga, ON, Canada) at a fluence of 200 mJ cm−2 (λmax = 675 nm; width of output peak at half maximum, 24 nm) at room temperature.
Cellular uptake of phthalocyanines
Cells were plated in normal growth medium in 60 mm tissue culture dishes at 5 × 10⁵ cells per dish and allowed to grow overnight (18–20 h) prior to addition of the Pc. Cells were incubated with the photosensitizer overnight (18–20 h) and harvested the following morning by trypsinization. Flow cytometric analysis was performed at the Case Comprehensive Cancer Center Flow Cytometry Core Facility, with an EPICS Elite flow cytometer. Pcs were excited by a broadband UV laser (335–365 nm) and fluorescence emission was collected with a 650 nm long-pass filter. Relative fluorescence level was used as an indication of the amount of Pc uptake in cells, and autofluorescence from control cells was subtracted. For absolute quantification of cell uptake of Pc 4 and Pc 181, cells were incubated with those Pcs overnight in complete medium, then washed with PBS (1 mL) twice, and lysed in sodium dodecyl sulfate (SDS; 2 mL of 0.5% or 2.0%). The SDS concentrations were above the critical micelle concentration (SDS CMC = 0.24% [14]). Cell lysates were collected, and fluorescence was measured. A titration curve was constructed from cells lysed with each of the SDS concentrations to which known concentrations (0– 250 nM) of Pc 4 or Pc 181 were added.
Subcellular localization of phthalocyanines
Cells were plated in 35 mm glass-bottomed tissue culture dishes (MatTek Corp., Ashland, MA) at 2 × 10⁵ cells per dish. For colocalization of Pcs with an organelle-specific dye, cells were incubated with Pcs at levels yielding similar intracellular Pc content (250 nM for Pc 4 or Pc 12; 40 nM for Pc 135, Pc 161 or Pc 181) and then either MitoTracker Green (M-7514) as a mitochondrial probe or Oregon Green Dextran (D7172) as a lysosomal probe (Invitrogen, Carlsbad, CA). Pc and Oregon Green Dextran were incubated overnight (16–18 h), while MitoTracker incubations were for 30 min. Imaging was done with a 63X N.A. 1.4 oil immersion planapochromat objective on a Zeiss LSM 510 confocal microscope, a part of the Case Comprehensive Cancer Center Confocal Microscopy Core Facility. A helium/neon laser supplied the 633 nm excitation light to excite the Pcs, and a 650 nm long-pass filter was used to collect emission. Oregon Green Dextran and MitoTracker Green were excited with 488 nm light from an argon laser, and emission was collected through a 500–550 nm band-pass filter. The appropriate controls were run to insure that Pc excitation and emission were spectrally distinct from those of the organelle-specific dyes.
Photocytotoxicity of Pc-PDT
Cell viability following PDT was determined by the MTT assay, as described previously (13). Briefly, cells were plated in 96-well flat-bottomed plates at 6 × 10³ cells per well and allowed to grow for 1 day prior to overnight exposure to a Pc followed by irradiation with red light. After 24 h of further incubation, the MTT reagent was added for 4 h at 37°C to allow conversion of MTT to a purple formazan product by active mitochondria. Plates were then centrifuged at 4000 g for 5 min, the medium was removed, and the formazan product was dissolved in DMSO and quantified by absorption spectrophotometry at 540 nm on a microplate reader (Molecular Devices).
A clonogenic assay was used to register both early and late cell death regardless of the mechanism. Following treatment, cells were released from monolayers by trypsinization, counted, diluted and replated in triplicate on 60 mm Petri dishes in sufficient numbers to yield 50–150 colonies per dish. Dishes were incubated for 12–14 days and then stained with 0.1% crystal violet in 20% ethanol and counted by eye under a dissecting microscope. Colonies of greater than 50 cells were scored as survivors. The plating efficiency (PE) of untreated cells ranged from 20% to 30%, and the PE of treated cells was normalized to that of the controls to determine the surviving fraction after each treatment.
Estimation of apoptosis by flow cytometry
Apoptotic cells were quantified by staining of DNA with propidium iodide (PI) and determining the percentage of cells with less than the G1 content of DNA (i.e. sub-G1 DNA content). Cells were collected by trypsinization, fixed in 0.25% formaldehyde for 10 min at 37°C and pelleted (9250 g, 1.5 min). The cells were digested with 5 μg mL−1 RNase for 15 min at 37°C, then chilled on ice for 10 min and stained with 25 μg mL−1 PI. Flow cytometry was carried out as described above, with λex = 488 ± 20 nm; λem = 620 ± 20 nm.
SDS-PAGE and immunoblot analysis
Cell lysates for Western blot analysis were prepared as described previously (13). Briefly, cells were harvested by scraping, washed in PBS, lysed and sonicated in a solution containing 0.5% SDS, 1% Triton X-100, 5 mM EDTA, 10 μg mL−1 leupeptin and 10 μg mL−1 aprotinin in PBS. Equivalent amounts of protein (15–20 μg) of the cell lysates were loaded onto polyacrylamide gels, subjected to electrophoresis and transferred to a PVDF membrane. The membranes were probed with the following antibodies: monoclonal hamster anti-Bcl-2 (1:250 dilution), mouse anti-PARP (1:2000 dilution), rabbit anti-active caspase-3 (1:1000 dilution) and polyclonal rabbit anti-Bid (1:1000 dilution), all from BD Pharmingen (San Diego, CA); anti-procaspase-3 (1:750) from BD Transduction Laboratories (Lexington, KY); and mouse antiactin (1:1000 dilution) from NeoMarkers (Fremont, CA). Immune complexes were detected by the ECL system (Amersham, Arlington Heights, IL).
RESULTS
Synthesis of silicon phthalocyanines
Pc 135, Pc 161 and Pc 182 were made with conventional silicon Pc ligand exchange reactions. Pc 181 was made from Pc 182 with the Sharpless dihydroxylation reagent (15,16). Syntheses are shown in Scheme 1.
Scheme 1.

Spectroscopic properties of the Pcs
The binding of Pcs to liposomes was studied by adding increasing amounts of liposomes (50% DMPC–50% DMPE) to aqueous suspensions of the dye and monitoring the increase in fluorescence (Fig. 2). The peak with a maximum at 676 nm for 0.00 mM lipid becomes sharper and blueshifted with the addition of lipid to the PBS solution, as the Pc monomers become incorporated into the liposomal bilayer. The fluorescence increases with additional liposomes until maximum fluorescence intensity is reached, at which point the Pc is maximally monomerized. The blueshift of the fluorescence spectra for these Pcs is typical of the change in shape of spectra for other Pcs upon addition of lipid (10). Table 1 summarizes the key features of the absorption and fluorescence spectra of four of the Pcs in PBS and in liposomal suspension. The shape of the emission spectra is the same in PBS and liposomal suspension, indicating that the monomer fluorescent species is the same for each dye at all levels of liposomes (data not shown).
Figure 2.

Binding of Pc 181 to liposomes. (A) Increasing amounts of liposomes (DMPC:DMPE::1:1) were added to an aqueous suspension of Pc 181 and the fluorescence spectrum was determined after each addition. (B) The data from the experiment in panel (A) were plotted as the peak of fluorescence vs the amount of added lipid.
Table 1.
Properties of phthalocyanines (Pcs): wavelength maxima and fluorescence quantum yield.
| Dye |
λ maxima in PBS (nm)
|
λ maxima in liposomes (nm)
|
φf | ||
|---|---|---|---|---|---|
| λabs | λfl | λabs | λfl | ||
| Pc 4 | 676 | 681 | 671 | 676 | 0.38 ± 0.01 |
| Pc 181 | 676 | 679 | 673 | 676 | 0.44 ± 0.03 |
| Pc 12 | 677 | 682 | 670 | 678 | 0.15 ± 0.04 |
| Pc 135 | 676 | 683 | 671 | 675 | 0.37 ± 0.03 |
Maxima are shown for the absorption and fluorescence emission spectra for Pcs in PBS and in liposomes (λex = 610 nm). Fluorescence quantum yield was determined in DMSO.
Association constants were calculated according to Eq. (1). All of the binding constants observed for Pc 181, Pc 12 and Pc 135 were greater than those obtained for Pc 4, which reflects their approximately three-fold greater affinity as monomer for lipid (Table 2). The major structural difference between Pc 4 and the other Pcs is the presence of two siloxy ligands extending axially from the Pc plane in the latter cases in contrast to only one such ligand in Pc 4. It has been suggested that substitutions on porphyrin rings can affect the localization of the dye in the liposomal bilayer, although in that case the substitutions were made directly on the porphyrin ring within its plane (17). The increased binding constants for the Pcs bearing two ligands suggests that disaggregation is the most important factor determining the magnitude of the binding affinity of Pcs for lipid in this liposomal system.
Table 2.
Association constants of phthalocyanines (Pcs) to liposomes.
| Pc | ka (103 M−1) |
|---|---|
| Pc 4 | 2.28, 1.95 |
| Pc 181 | 6.13, 6.14 |
| Pc 12 | 7.00, 6.17 |
| Pc 135 | 7.18 |
Association constants were determined as described in Materials and Methods. Results of one or two independent determinations for each Pc are shown.
Because we observed preferential binding of Pc 181 to lysosomes (see below), we further tested its binding to liposomes containing sphingomyelin, a lipid characteristic of those organelles. The Ka value for Pc 181 with liposomes formed from 30% DMPE, 30% DMPC and 40% sphingomyelin was found to be 6.08 and 6.11 × 10³ M−1 in two trials, very close to the value without sphingomyelin (Table 2). This again suggests that disaggregation, rather than lipid composition, is the most important factor in determining the magnitude of the binding affinity of the Pcs for liposomes. The fluorescence quantum yields of these Pcs in DMSO solution are similar to one another except Pc 12 (Table 1), precluding the possibility that they are responsible for the higher intracellular fluorescence values of Pc 181, Pc 12 and Pc 135 compared with Pc 4. Thus, the changes in structure do not appear to change the fundamental photophysical properties of the molecules in organic medium in which aggregation should be minimal. Pc 12 presents a lower unexpected fluorescence quantum yield which we believe is due to an instability issue related to it.
Photobleaching of photosensitizers can affect both fluorescence and photoactivity measurements. Wang et al. found no evidence for photobleaching of Pc 4 in cells after exposure to normal killing fluences of light (e.g. 200 mJ cm−2). In fact, they observed an enhancement of Pc 4 fluorescence after PDT (18). We have monitored the fluorescence of the new Pcs (Fig. 1) in cells before and after an LD90 dose of PDT (data not shown). The fluorescence of Pc 135, Pc 161 and Pc 181 did not change in response to PDT; however, the fluorescence of Pc 12, like that of Pc 4, increased in response to light. The greater initial disaggregation of the former group may preclude their further disaggregation upon photoirradiation and the associated increase in fluorescence.
Cellular localization of photosensitizers
We have previously demonstrated by confocal microscopy that Pc 4 localizes preferentially in mitochondria and ER/Golgi membranes, as judged by partial colocalization with the mitochondrion-specific dye MitoTracker Green (2,19–21). This distribution is confirmed in Fig. 3A, showing that a substantial part of the Pc 4 fluorescence colocalizes with MitoTracker Green fluorescence. To study the localization of the other Pcs, both Oregon Green Dextran and MitoTracker Green were used as specific markers for lysosomes and mitochondria, respectively. In this study, Pc fluorescence and an organelle-specific dye fluorescence are depicted as pseudored and -green, respectively, and merged images appear pseudo-yellow indicating colocalization. Also shown in Fig. 3A are images of Pc 181, Oregon Green Dextran and the merged image, indicating strong colocalization of the two fluorophores. For the other Pc-marker pairs, Fig. 3B,C presents only the merged images. Pc 4 shows no colocalization with Oregon Green Dextran, as revealed by the presence of green dots but no yellow ones (Fig. 3C). Cells incubated with Pc 12 gave localization patterns nearly identical to those of Pc 4 but also with a few red dots characteristic of lysosomes (Fig. 3B), which seem to be substantially colocalized with Oregon Green Dextran (Fig. 3C). In contrast, the fluorescence pattern of cell-bound Pc 135 was primarily punctate and colocalized more with Oregon Green Dextran (yellow dots). This pattern was even more apparent with Pc 161- and Pc 181-loaded cells. The partial colocalization of Pc 181, Pc 135 and Pc 161 fluorescence with that of Oregon Green Dextran confirms the extensive, although not complete, lysosomal localization of these photosensitizers. None of the Pcs appeared to localize to the plasma membrane or nucleus.
Figure 3.

Intracellular distribution/accumulation of phthalocyanines. MCF-7c3 cells were plated at 2 × 10⁵ per 35 mm dish, allowed to attach overnight (16–18 h) and then incubated overnight with 250 nM Pc 4 or Pc 12 or 40 nM Pc 135, Pc 161 or Pc 181. Some cells received Pc alone, while others were coloaded with 2.9 μM Oregon Green Dextran (OGD) overnight. Some cells receiving Pc alone were loaded with 75 nM MitoTracker Green (MG) 30 min before imaging. All cells were washed twice in PBS and re-fed with fresh serum-free growth medium prior to imaging. (A) Colocalization of Pc 4 with MG and Pc 181 with OGD. (B) Merged image of Pc 12, Pc 135, Pc 161 and Pc 181 with MG. (C) Merged image of Pc 4, Pc 12, Pc 135 and Pc 161 with OGD. The scale bar represents 20 μm.
Quantification of uptake of photosensitizers into MCF-7c3 cells
Uptake of each of the photosensitizers into cells was first determined by flow cytometry. Fluorescence per cell was recorded as mean channel fluorescence (MCF) for each Pc. Within the range of Pc concentrations studied (up to 100 nM), the MCF increased with Pc concentration in an approximately linear manner (data not shown), and at all concentrations, the values of MCF were greater for the new Pcs than for Pc 4. As indicated in Fig. 4 and Table 3, the relative MCF values ranged from 2.5 for 50 or 100 nM Pc 12 to 8.0 for 100 nM Pc 181.
Figure 4.

Uptake of phthalocyanines into MCF-7c3 cells. Cells were incubated with the indicated concentrations of the Pc overnight (18–20 h). Following harvest by trypsinization, cells were washed, re-suspended in cold HBSS (without phenol red) and analyzed by flow cytometry. Excitation of Pc was achieved with a 355–365 nm UV laser, and emission was collected with a 650 nm long-pass filter. At each concentration, the MCF of each dye was divided by that of Pc 4 to obtain the relative fluorescence, which is plotted. Absolute values of MCF in cells loaded with 10, 50 and 100 nM Pc 4 were found to be 24 ± 5, 54 ± 12 and 100 ± 22, respectively. Each datum is the mean ± SEM of four independent measurements.
Table 3.
Intracellular uptake of phthalocyanines (Pcs).
| [Pc] nM | Relative fluorescence of cell-bound Pc (by flow cytometry)
|
Relative cell uptake of Pc 181 vs Pc 4 (by extraction)
|
||||
|---|---|---|---|---|---|---|
| 10 | 50 | 100 | 20 | 50 | 100 | |
| Pc 4 | 1 | 1 | 1 | 1 | 1 | 1 |
| Pc 12 | 3.2 ± 0.2 | 2.5 ± 0.47 | 2.5 ± 0.24 | |||
| Pc 135 | 5.3 ± 0.24 | 7.1 ± 0.48 | 7.2 ± 0.51 | |||
| Pc 161 | 4.4 ± 0.4 | 5.3 ± 0.03 | 6.9 ± 0.87 | |||
| Pc 181 | 3.6 ± 0.0 | 6.7 ± 0.8 | 8.0 ± 0.41 | 3.5 ± 2.0 | 2.5 ± 1.2 | 2.5 ± 1.9 |
Cells were incubated with the indicated concentrations of Pc overnight (18–20 h). For measurement of intracellular Pc fluorescence, cells were harvested by trypsinization, washed, resuspended in cold HBSS (without phenol red) and analyzed by flow cytometry. The mean channel fluorescence for each Pc was divided by that for Pc 4. For measurement of cell-bound Pc, cells incubated with either Pc 4 or Pc 181 were extracted, and the Pc fluorescence was determined in a spectrofluorometer. Data are presented as the ratio of Pc fluorescence divided by that for Pc 4. Data are the mean ± SEM of four independent measurements.
Because fluorescence of cell-bound photosensitizers can be greatly influenced by aggregation and by the photosensitizer’s environment, we also compared Pc 181 (as representative of the Pcs with two large axial ligands) and Pc 4 with respect to uptake into cells, as determined by extraction with SDS (0.5% or 2.0%) and measurement of Pc level in SDS, or by extraction with ethyl acetate after SDS lysis and measurement of Pc fluorescence in ethyl acetate. A standard curve was first prepared from increasing concentrations of each Pc added to lysed cells in the same solvents; the fluorescence intensities of the two Pcs were nearly identical at each concentration, indicating that both Pcs were similarly disaggregated in these conditions.
Two different concentrations of SDS were used for cellular extractions to be sure that both Pcs were totally disaggregated by SDS. The same results were obtained with 0.5% and 2.0% SDS, confirming that both Pcs were maximally monomerized and the concentrations were accurately calculated. Therefore, comparison of two Pcs by cellular extraction can be made with confidence that the data represent their relative uptake into the cells. We found (Table 3) that the fluorescence intensity of extracted Pc 181 in 2% SDS ranged from 2.5-fold greater than that of extracted Pc 4 when compared at 50 or 100 nM to 3.5-fold greater when the two photosensitizers were compared at 20 nM. Similar results were found for measurements made in SDS and in ethyl acetate. Furthermore, we considered the possibility that the fluorescence of lysosome-bound Pc 181 might be greater because of the lower pH of those organelles. However, no difference was observed in the fluorescence of Pc 181 when compared in SDS solution at pH 7.4 vs pH 6.5; when the pH was reduced to 5.5, there was a sharp decrease in fluorescence, which was not reversible by raising the pH and which was likely due to acid hydrolysis of the siloxy ligands with subsequent aggregation of the Pc rings. We conclude that Pc 181 is taken up into MCF-7c3 cells more efficiently than is Pc 4, and moreover, that the cell-bound Pc 181 is less aggregated and therefore more fluorescent than is cell-bound Pc 4. These same conclusions can also be drawn for the other hydroxyl-containing Pcs.
Photocytotoxicity of the silicon phthalocyanines against MCF-7c3 cells
Cell death following PDT with each of the Pcs was assessed both by the MTT assay and by the clonogenic assay (Fig. 5). The former provides information on death or inhibition of growth or loss of mitochondrial function that occurs within the first 24 h following PDT, whereas the latter provides an integrated measure of all deaths, both early and late, by any mechanism. Exponentially growing cells were incubated with varying concentrations of each of the Pcs and were then exposed to 200 mJ cm−2 red light. The MTT assay 24 h post-PDT revealed that each Pc caused concentration-dependent cell killing (Fig. 5A). Pc 4 was the least efficient photosensitizer in this assay, with the other four Pcs becoming effective at lower concentrations and not differing substantially from each other. The LD50 dose for Pc 12-mediated PDT was nearly four times lower than that needed to achieve the same killing with Pc 4 (~35 nM vs ~140 nM, respectively). For PDT mediated by Pc 135, Pc 161 or Pc 181, the LD50 dose was ~20 nM, approximately seven to eight times lower than for Pc 4. The increase in PDT efficiency is in alignment with the increased intracellular uptake of each respective Pc, relative to Pc 4 uptake, and their greater affinity for liposomal membranes as monomers because of the greater disaggregation.
Figure 5.

PDT-induced reduction in cell viability and clonogenicity. (A) MTT assay. Cells were plated in a 96-well, flat-bottom dish at 6 × 10³ cells per well and grown for 1 day prior to Pc incubation and subsequent irradiation with red light (200 mJ cm−2). MTT was added to plates 24 h post- PDT, and absorbance of the formazan product was quantified at 540 nm. Values are shown as percent viability, normalized to the viability of the untreated controls and are an average of at least three independent experiments. (B) Clonogenic assay. Cells were plated in 25 cm2 flasks, then incubated overnight with Pc-loaded growth medium at the concentrations shown on the abscissa and irradiated with 200 mJ cm−2 light. Following treatment, cells were released from monolayers by trypsinization and plated on 60 mm Petri dishes in triplicate in sufficient number to yield 50–150 colonies per dish. Plating efficiency of the controls ranged between 20% and 30%. Values are the mean ± SEM of four independent experiments.
As determined by the clonogenic assay (Fig. 5B), the dose– response curve for Pc 4 was similar to ones previously obtained in this cell line, with an LD90 dose of 100–200 nM (13). PDT with Pc 12 elicited a similar response to that of Pc 4, as reported previously (7). In contrast, PDT with Pc 135, Pc 161 or Pc 181 was significantly more efficient, giving LD90 values of ~20 nM. At the 10% survival level, we calculated dose-enhancement ratios for Pc 135-, Pc 161- and Pc 181-PDT to be 5.5–6.0 compared to Pc 4. Thus, the increased uptake of these latter Pcs, as well as their decreased tendency to aggregate, results in greater photocytotoxicity. Because the most efficient photosensitizers in this series preferentially localize in lysosomes, we suspect that other factors, such as different initial targets or different mechanisms of cell death, may also contribute to the observed differences in photodynamic efficiency.
Apoptosis as a mechanism of Pc-PDT-induced cell death
PDT with Pc 4 is an efficient inducer of the intrinsic (mitochondrial) pathway of apoptosis (1). For a lysosome-localized photosensitizer, such as Pc 181, it is expected that apoptosis, if it occurs, will be induced indirectly (4). As an indicator of the extent and timing of apoptosis, we first monitored the appearance of cells or cell fragments containing less than theG1content of DNA at various times after two different doses of each Pc, those that resulted in 90% or 99% loss of clonogenicity (LD90 or LD99, respectively). As shown in Fig. 6, the level of apoptosis increased with time up to 48 h post-PDT for both doses and both Pcs, but the extent of apoptosis increased more rapidly with Pc 4 than with Pc 181 as the photosensitizer at each dose level, and the extent of apoptosis was greater when the cells were treated with the higher of the two doses of each photosensitizer. These results are consistent with a slower induction of apoptosis for Pc 181 at comparable levels of overall cell killing.
Figure 6.

Intracellular DNA content pre/post-PDT. MCF-7c3 cells were plated at 5 × 10⁵ per 60 mm dish and grown for 24 h prior to incubation with a Pc. The concentrations of Pc were chosen to approximate LD90 and LD99 values for each Pc, i.e. 150 and 300 nM Pc 4, and 20 and 40 nM Pc 181, respectively. After 18–20 h incubation with the Pc, cells were irradiated with red light (200 mJ cm−2) and returned to the incubator until collection by trypsinization at the indicated times. Following fixation in formaldehyde, cells were stained with 25 μg mL−1 PI for 30 min on ice, under reduced light. Uptake of PI into cells was determined on an EPICS XL flow cytometer. (A) The two-gate strategy was used to select the population. The upper left panel presents a representative forward angle scatter vs 90-degree scatter dot blot with the employed gating box, while the upper right panel presents the second gate in order to pick only single cells. The bottom panels contain representative histograms of events vs PI fluorescence for populations, as selected in the upper gates, of control cells (left) and cells 8 h after exposure to PDT with 300 nM Pc 4 (right). The bar indicates sub-G1 DNA. (B) Data show percentage of cells with sub-G1 DNA levels ± SD and are averaged from three independent experiments. Paired t-tests were performed to establish statistical significance: *P < 0.05; **P < 0.01; ns, not significant.
Apoptosis was also monitored by the processing of Bid and procaspase-3 and cleavage of the DNA repair enzyme poly(ADP)-ribose polymerase (PARP). Pc 181-PDT was less efficient than an equitoxic dose of Pc 4-PDT in inducing the processing of procaspase-3 to its active form (Fig. 7A), but more efficient in stimulating the production of tBid from Bid (Fig. 7B). Although an increase in the active form of caspase-3 is apparent at 2, 4 and 6 h after PDT with Pc 4, there was little or no loss of the pro-caspase form. In cell lines expressing only endogenous procaspase-3, one would expect a pronounced decrease, but in MCF-7c3 cells, which overexpress procaspase-3, it can take several more hours for the decrease in procaspase-3 to become obvious, because of active and continuous synthesis of the pro-form within the cells until late in apoptosis. In contrast, almost complete loss of the procaspase form is observed when the cells are treated with a supralethal dose of staurosporine.
Figure 7.

Kinetics of apoptosis-related events post-PDT. Cells were treated with Pc 4- or Pc 181-PDT at the concentrations to yield 90% lethality for each. Cells were harvested by scraping at the indicated time postirradiation (200 mJ cm−2). Cell lysates were subjected to electrophoresis on a 12% polyacrylamide gel to monitor pro- and active caspase-3 and Bid or an 8% polyacrylamide gel to determine PARP cleavage with appropriate antibodies. Actin was used as a loading control. As a positive control, some cells were treated with 1 μM staurosporine (STS) for 6 h. Results were similar in two additional independent experiments. (A) Caspase activation. (B) Cleavage of Bid to generate truncated Bid (tBid). For Pc 181, both LD90 and LD99 doses were studied. C, untreated control. (C) PARP cleavage post-PDT.
The normally 116 kDa PARP is cleaved by caspase-3 or -7 during apoptosis at a specific aspartic acid residue, generating an ~90 kDa fragment. The results of Fig. 7C show that an LD90 dose of Pc 4-PDT results in marked cleavage of PARP by 2 h post-PDT and increasing cleavage over the next 4 h. In contrast, an approximately equitoxic level of PDT with Pc 181 was much less efficient in inducing PARP cleavage, with only modest appearance of the cleavage product by 6 h post-PDT. Thus, Pc 181-PDT may induce apoptosis more slowly than does Pc 4-PDT because of its indirect action via the targeting of lysosomes as opposed to mitochondria and the need to produce tBid for activation of mitochondrial apoptosis (4).
PDT-induced Bcl-2 photodamage
PDT with Pc 4 causes extensive photodamage to the anti-apoptotic protein Bcl-2, as observed on Western blots by the immediate dose-dependent loss of the 26 kDa native Bcl-2 band (22). Pc 181-PDT also results in Bcl-2 photodamage but only at doses greater than those of Pc 4, both in terms of the amount of Pc to which the cells were exposed and in terms of the level of toxicity produced (Fig. 8). Whereas loss of Bcl-2 followed a dose dependence approximating loss of clonogenicity after Pc 4-PDT, a greater loss of clonogenicity was required to observe the same loss of Bcl-2 after Pc 181-PDT. Thus, it appears that Bcl-2 is not a primary target of the lysosome-bound Pc 181 as it is for the mitochondrion- and ER-bound Pc 4.
Figure 8.
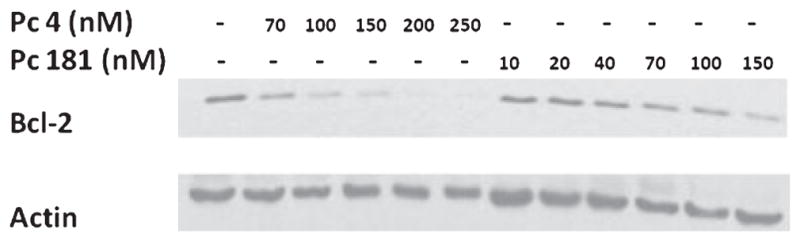
PDT-induced Bcl-2 photodamage. MCF-7c3 cells were treated with Pc 4- or Pc 181-PDT at the indicated doses and harvested 10 min after irradiation (200 mJ cm−2). Cell lysates were subjected to electrophoresis on a 12% polyacrylamide gel. A hamster anti-Bcl-2 antibody was used to detect the native Bcl-2 level in each sample. Actin was used as a loading control. Results were similar in three independent experiments.
DISCUSSION
The primary aim of this study was to explore the mechanisms of PDT with a promising new series of Pcs by studying their photochemical properties, binding to liposomes, cellular uptake, phototoxicity, intracellular targets and mechanism of inducing cell death. The results demonstrate that Pcs with the aminopropylsiloxy ligand of Pc 4 or a similar one on one side of the Pc ring and a second large axial ligand on the other side of the ring have unexpected properties, including enhanced cell uptake (Fig. 4, Table 3), greater monomerization of the Pc (Table 2) resulting in greater intracellular fluorescence (Fig. 4) and greater efficiency in cell killing (Fig. 5). This was especially true of Pcs bearing at least one hydroxyl group in the second axial ligand.
In addition to decreasing the aggregation of the hydrophobic Pc ring system, the presence of a large hydroxylated axial ligand steers the compound to lysosomal membranes, in preference to mitochondrial and ER membranes where Pc 4 localizes (Fig. 3). Thus, we predicted that the mechanism of cell death would differ in some details, as a primary effect on the lysosomes, such as collapse of the pH gradient or physical damage to the membrane, would elicit different signals for cell death. With Pc 181 as a representative of the new Pcs, our results show that induction by PDT of certain hallmarks of the intrinsic pathway of apoptosis (activation of caspase-3, cleavage of PARP and generation of cells with a sub-G1 content of DNA) is considerably less efficient than observed for equitoxic doses of Pc 4-PDT (Figs. 6 and 7). Pc 181-PDT also is less efficient than Pc 4-PDT in causing Bcl-2 photodamage (Fig. 8). Thus, it is likely that Pc 181 produces an initial response in the lysosomes that may subsequently trigger a delayed mitochondrial apoptosis. The nature of that response is the subject of ongoing studies.
The studies show a significant increase in the binding of the OH-bearing Pc 4 analogs to liposomes (Table 2) and in their intracellular uptake (Fig. 4) and photocytotoxic efficiency (Fig. 5) in comparison with Pc 4. It appears that all of these effects can be attributed to the presence of two large axial ligands, as opposed to one in Pc 4, on the central silicon, which reduces the ability of the macrocycle rings to aggregate and increases the population of monomers, which would be expected to be more photoactive with regard to both fluorescence and photodynamic activity. The strong tendency of these new photosensitizers to localize in lysosomes was unexpected (Fig. 3). Because of the high hydrophobicity of the Pc rings, it is likely that the new Pcs bind to the lysosomal membrane rather than the hydrophilic interior. Because the inclusion of sphingomyelin in liposomes did not markedly affect the binding of the new Pcs, we conclude that their affinity for lysosomal membranes in preference to other intracellular membranes may not be due to the high content of sphingomyelin in lysosomes, but to other factors such as unique membrane-embedded proteins.
In comparing PDT sensitized by Pc 181, as representative of the hydroxyl-bearing Pcs, with Pc 4-PDT with regard to the mechanism by which they kill cells, it was important to compare them at equitoxic doses. A comparison based on the addition of equal amounts of each photosensitizer to the culture medium would have resulted in much more extensive killing by Pc 181-PDT (Fig. 5), and it is well known that the mechanism by which the cells die is a function of the overall amount of photodynamic damage (23).
When compared at doses that resulted in 90% or 99% cell death, the amount of immediate photodamage to Bcl-2 was much lower in the case of Pc 181-PDT (Fig. 8), and the rate and extent of the induction of apoptosis by Pc 181-PDT was much lower than for an equitoxic dose of Pc 4-PDT (Figs. 6 and 7). These results are consistent with the localization of Pc 181 in lysosomes, where the initial photodynamic effect must occur. Whereas Pc 4-PDT is a highly efficient inducer of Bcl-2 photodamage and the intrinsic pathway for apoptosis, it appears that Pc 181-PDT induces apoptosis only indirectly (Fig. 7) and less efficiently (Fig. 6), suggesting that other mechanisms of cell death, e.g. autophagy, may be more important in the case of Pc 181 and the other lysosome-targeting Pcs. PDT with another lysosome-bound photosensitizer, NPe6, has been shown to induce apoptosis through the release of lysosomal cathepsins, cleavage of Bid to tBid and the stimulation of mitochondrial apoptosis by tBid (4,24) Our data are consistent with such a mechanism for Pc 181-PDT, but other as-yet-unidentified mechanisms may also contribute.
Pc 12 is the only photosensitizer in the present series that has some properties similar to Pc 4 and others similar to the hydroxyl-containing Pcs. For example, as judged by the MTT assay, Pc 12 showed similar photocytotoxicity as did Pc 4, but it behaved like the hydroxyl-bearing Pcs when judged by the clonogenic assay (Fig. 5). Although the reason for the intermediate response to Pc 12-PDT has not been explored fully, it should be noted that Pc 12 bears two axial ligands, which likely reduce its aggregation and may account for its greater fluorescence in cells than Pc 4 (Table 1), but it appears to bind to mitochondria and ER/Golgi membranes as does Pc 4. One possibility is that Pc 12-PDT is more effective than Pc 4-PDT against MCF-7c3 cells, but a higher fraction of the killed cells may die by a slower mechanism, such as autophagy (25–27), rather than the more rapid cell death that is characteristic of Pc 4-PDT and largely detectable by the MTT assay (13).
Acknowledgments
This research was supported by grants from the US National Cancer Institute, DHHS: P01 CA48735 (to N.L.O.), R01 CA83917 (to N.L.O.), R01 CA119079 (to A.-L.N.) and P30 CA43703. Flow cytometry and confocal microscopy were carried out in the core facilities of the Case Comprehensive Cancer Center. The authors are grateful to Michael Sramkoski for help with the flow cytometry studies.
References
- 1.Oleinick NL, Morris RL, Belichenko I. The role of apoptosis in response to photodynamic therapy: What, where, why, and how. Photochem Photobiol Sci. 2002;1:1–21. doi: 10.1039/b108586g. [DOI] [PubMed] [Google Scholar]
- 2.Lam M, Oleinick NL, Nieminen AL. Photodynamic therapy-induced apoptosis in epidermoid carcinoma cells. Reactive oxygen species and mitochondrial inner membrane permeabilization. J Biol Chem. 2001;276:47379–47386. doi: 10.1074/jbc.M107678200. [DOI] [PubMed] [Google Scholar]
- 3.Chiu SM, Oleinick NL. Dissociation of mitochondrial depolarization from cytochrome c release during apoptosis induced by photodynamic therapy. Br J Cancer. 2001;84:1099–1106. doi: 10.1054/bjoc.2000.1714. [DOI] [PMC free article] [PubMed] [Google Scholar]
- 4.Reiners JJ, Jr, Caruso JA, Mathieu P, Chelladurai B, Yin XM, Kessel D. Release of cytochrome c and activation of pro-caspase-9 following lysosomal photodamage involves Bid cleavage. Cell Death Differ. 2002;9:934–944. doi: 10.1038/sj.cdd.4401048. [DOI] [PMC free article] [PubMed] [Google Scholar]
- 5.Miller JD, Baron ED, Scull H, Hsia A, Berlin JC, McCormick T, Colussi V, Kenney ME, Cooper KD, Oleinick NL. Photodynamic therapy with the phthalocyanine photosensitizer Pc 4: The case experience with preclinical mechanistic and early clinical-translational studies. Toxicol Appl Pharmacol. 2007;224:290–299. doi: 10.1016/j.taap.2007.01.025. [DOI] [PMC free article] [PubMed] [Google Scholar]
- 6.Oleinick NL, Antunez AR, Clay ME, Rihter BD, Kenney ME. New phthalocyanine photosensitizers for photodynamic therapy. Photochem Photobiol. 1993;57:242–247. doi: 10.1111/j.1751-1097.1993.tb02282.x. [DOI] [PubMed] [Google Scholar]
- 7.He J, Larkin E, Li YS, Rihter D, Zaidi SI, Rodgers MA, Mukhtar H, Kenney ME, Oleinick NL. The synthesis, photophysical and photobiological properties and in vitro structure–activity relationships of a set of silicon phthalocyanine PDT photosensitizers. Photochem Photobiol. 1997;65:581–586. doi: 10.1111/j.1751-1097.1997.tb08609.x. [DOI] [PubMed] [Google Scholar]
- 8.Anula HM, Berlin JC, Wu H, Li YS, Peng X, Kenney ME, Rodgers MA. Synthesis and photophysical properties of silicon phthalocyanines with axial siloxy ligands bearing alkylamine termini. J Phys Chem A. 2006;110:5215–5223. doi: 10.1021/jp056279t. [DOI] [PubMed] [Google Scholar]
- 9.Laroche C, Simonin H, Beney L, Gervais P. Phase transitions as a function of osmotic pressure in Saccharomyces cerevisiae whole cells, membrane extracts and phospholipid mixtures. Biochim Biophys Acta. 2005;1669:8–16. doi: 10.1016/j.bbamem.2005.01.007. [DOI] [PubMed] [Google Scholar]
- 10.Rodriguez ME, Awruch J, Dicelio LE. Photophysical properties of zinc(II) phthalocianinates incorporated into liposomes. J Porphyrins Phthalocyanines. 2002;6:122–129. [Google Scholar]
- 11.Seybold PG, Gouterman M. Porphyrins XIII. Fluorescence spectra and quantum yields. J Mol Spectrosc. 1969;31:1–13. [Google Scholar]
- 12.Lide DR. Handbook of Chemistry and Physics. 87. CRC Press, Inc; Boca Raton: 2006. Section 3. [Google Scholar]
- 13.Xue LY, Chiu SM, Oleinick NL. Photodynamic therapy-induced death of MCF-7 human breast cancer cells: A role for caspase-3 in the late steps of apoptosis but not for the critical lethal event. Exp Cell Res. 2001;263:145–155. doi: 10.1006/excr.2000.5108. [DOI] [PubMed] [Google Scholar]
- 14.Kalyanasundaram K. Photochemistry in Microheterogeneous Systems. Academic Press; New York: 1987. [Google Scholar]
- 15.Sharpless KB, Amberg W, Bennani YL, Crispino GA, Hartung J, Jeong KS, Kwong HL, Morikawa K, Wang ZM, Xu D, Zhang XL. The osmium-catalyzed asymmetric dihydroxylation: A new ligand class and a process improvement. J Org Chem. 1992;57:2768–2771. [Google Scholar]
- 16.Mehltretter GM, Bhor S, Klawonn M, Döbler C, Sundermeier U, Eckert M, Militzer HC, Beller MA. New practical method for the osmium-catalyzed dihydroxylation of olefins using bleach as the terminal oxidant. Synthesis. 2003:295–301. [Google Scholar]
- 17.Wiehe A, Simonenko EJ, Senge MO, Roeder B. Hydrophilicity vs hydrophilicy—Varying the amphiphilic structure of porphyrins related to the photosensitizer m–THPC. J Porphyrins Phthalocyanines. 2001;5:758–761. [Google Scholar]
- 18.Wang KK, Wilson JD, Kenney ME, Mitra SM, Foster TH. Irradiation-induced enhancement of Pc 4 fluorescence and changes in light scattering are potential dosimeters for Pc 4-PDT. Photochem Photobiol. 2007;83:1056–1062. doi: 10.1111/j.1751-1097.2007.00128.x. [DOI] [PubMed] [Google Scholar]
- 19.Trivedi NS, Wang HW, Nieminen AL, Oleinick NL, Izatt JA. Quantitative analysis of Pc 4 localization in mouse lymphoma (LY-R) cells via double-label confocal fluorescence microscopy. Photochem Photobiol. 2000;71:634–639. doi: 10.1562/0031-8655(2000)071<0634:qaopli>2.0.co;2. [DOI] [PubMed] [Google Scholar]
- 20.Usuda J, Chiu SM, Murphy ES, Lam M, Nieminen AL, Oleinick NL. Domain-dependent photodamage to Bcl-2. A membrane anchorage region is needed to form the target of phthalocyanine photosensitization. J Biol Chem. 2003;278:2021–2029. doi: 10.1074/jbc.M205219200. [DOI] [PubMed] [Google Scholar]
- 21.Morris RL, Azizuddin K, Lam M, Berlin J, Nieminen AL, Kenney ME, Samia AC, Burda C, Oleinick NL. Fluorescence resonance energy transfer reveals a binding site of a photosensitizer for photodynamic therapy. Cancer Res. 2003;63:5194–5197. [PubMed] [Google Scholar]
- 22.Xue LY, Chiu SM, Oleinick NL. Photochemical destruction of the Bcl-2 oncoprotein during photodynamic therapy with the phthalocyanine photosensitizer Pc 4. Oncogene. 2001;20:3420–3427. doi: 10.1038/sj.onc.1204441. [DOI] [PubMed] [Google Scholar]
- 23.Luo Y, Kessel D. Initiation of apoptosis versus necrosis by photodynamic therapy with chloroaluminum phthalocyanine. Photochem Photobiol. 1997;66:479–483. doi: 10.1111/j.1751-1097.1997.tb03176.x. [DOI] [PubMed] [Google Scholar]
- 24.Caruso JA, Mathieu PA, Joiakim A, Leeson B, Kessel D, Sloane BF, Reiners JJ., Jr Differential susceptibilities of murine hepatoma 1c1c7 and Tao cells to the lysosomal photosensitizer NPe6: Influence of aryl hydrocarbon receptor on lysosomal fragility and protease contents. Mol Pharmacol. 2004;65:1016–1028. doi: 10.1124/mol.65.4.1016. [DOI] [PubMed] [Google Scholar]
- 25.Kessel D, Reiners JJ., Jr Apoptosis and autophagy after mitochondrial or endoplasmic reticulum photodamage. Photochem Photobiol. 2007;83:1024–1028. doi: 10.1111/j.1751-1097.2007.00088.x. [DOI] [PMC free article] [PubMed] [Google Scholar]
- 26.Buytaert E, Callewaert G, Vandenheede JR, Agostinis P. Deficiency in apoptotic effectors Bax and Bak reveals an autophagic cell death pathway initiated by photodamage to the endoplasmic reticulum. Autophagy. 2006;2:238–240. doi: 10.4161/auto.2730. [DOI] [PubMed] [Google Scholar]
- 27.Xue LY, Chiu S, Azizuddin K, Joseph S, Oleinick N. The death of human cancer cells following photodynamic therapy: Apoptosis competence is necessary for Bcl-2 protection but not for induction of autophagy. Photochem Photobiol. 2007;83:1016–1023. doi: 10.1111/j.1751-1097.2007.00159.x. [DOI] [PubMed] [Google Scholar]