


Abstract
Over the last decade, genome-wide association studies (GWAS) have become the standard tool for gene discovery in human disease research. While debate continues about how to get the most out of these studies and on occasion about how much value these studies really provide, it is clear that many of the strongest results have come from large-scale mega-consortia and/or meta-analyses that combine data from up to dozens of studies and tens of thousands of subjects. While such analyses are becoming more and more common, statistical methods have lagged somewhat behind. There are good meta-analysis methods available, but even when they are carefully and optimally applied there remain some unresolved statistical issues. This article systematically reviews the GWAS meta-analysis literature, highlighting methodology and software options and reviewing methods that have been used in real studies. We illustrate differences among methods using a case study. We also discuss some of the unresolved issues and potential future directions.
INTRODUCTION
Genome-wide Association Studies (GWAS) test for statistical association between genotype and phenotype on hundreds of thousands to millions of single nucleotide polymorphisms (SNPs) at a time in order to find genes that contribute to human diseases or non-disease traits. Early in the GWAS era, costs were high and sample sizes were small, but with technological advances prices have come down significantly and typical sample sizes are now in the thousands. Even with those large sample sizes, discoveries have been modest for many or most phenotypes studied because typical effect sizes are quite small, and many results do not appear to replicate in subsequent studies. As a result, most GWAS publications now involve multiple data sets in order to both reduce false positives and increase statistical power to find true positives. Often these multiple data sets are analyzed individually, or some of them are only used for ‘in-silico replication’ (i.e. only top markers from one data set are examined in the remaining data sets). There is growing recognition, however, that the most statistically robust and efficient analysis is a full-genome meta-analysis combining all studies and using all data at every marker. Meta-analysis provides optimum power to find effects that are homogeneous across cohorts, and at the same time can shed light on between-study heterogeneity (1–5). Going even further, many investigators are now forming mega-consortia of a dozen or more studies for increased statistical power. Meta-analysis thus has become a routine part of GWAS, and yet there remain unresolved issues about the most powerful and robust ways to use it. This article attempts to provide a comprehensive review of GWAS meta-analysis methods, practices and problems, with the goal of helping both applied and methodological researchers take the necessary next steps forward. In the next section we provide an overview of GWAS meta-analysis methods, and in ‘Databases and software’ we review databases and software. ‘Literature review’ summarizes the methods used in the literature, and ‘Case study’ presents our case study. Finally, in ‘Complications and open questions’ we discuss important open questions.
GWAS META-ANALYSIS DATA AND METHODS
It is fairly common for an individual investigator to perform GWAS on several different study populations and combine the results into a single report. If the genotyping is done for all studies together, data from the different populations can be directly combined (termed ‘mega-analysis’), and meta-analysis is not necessary. GWAS investigators generally turn to meta-analysis when scans are performed on different chips and/or when results from different investigators need to be combined and raw data cannot be exchanged for reasons of either confidentiality or proprietorship.
There has historically been some concern about the appropriateness of mega-analysis and even meta-analysis given the high level of heterogeneity among GWAS of the same trait. Sources of heterogeneity between studies can include different trait measurements and study designs, different ethnic groups, different environmental exposures, different genotyping chips, etc. For example, if two study populations have significantly different environmental backgrounds (say different diets in an obesity study), different genes may be relevant to the trait in the two populations (i.e. there may be gene × environment interaction). Another important source of heterogeneity is differing linkage disequilibrium patterns in different ethnic groups, so that even if the same variant is causal in both groups, the SNPs that are associated (in linkage disequilibrium) with it may differ from group to group. Recently, Lin et al. allayed some of these concerns. They showed both theoretically and by simulation that meta-analysis and mega-analysis have essentially equal statistical efficiency, and also that the efficiency of both approaches is fairly robust to between-study heterogeneity (6). Heterogeneity remains a concern, however, and we will discuss it further throughout the article (e.g. in the random effects model, case study and open questions).
Most GWAS meta-analysis uses relatively straightforward methods. P-values can be combined either with or without weights, or effect sizes can be combined in either fixed or random effects models. (See the companion paper on microarray meta-analysis for a more detailed exposition of the differences among these methods). Any of those methods can be applied either across all studies at once, or cumulatively as each study is added. Most GWAS meta-analysis takes a frequentist approach, but Bayesian hierarchical models can also be used, and are very well-suited to a cumulative approach (7). Table 1 lists the commonly-used GWAS meta-analysis methods and the source information that is required for each. The methods are described in a bit more detail below.
Table 1.
Sources of information for different methods of meta-analysis
| Fisher's, P | Weighted Z | Fixed effect | Random effect | |
|---|---|---|---|---|
| P-value | X | X | ||
| Effect size | X | X | ||
| Direction of the effect size | X | |||
| Sample size | X | |||
| Heterogeneity estimate | X | |||
| SE of effect size | X | X |
The simplest GWAS meta-analysis approach is to combine P-values using Fisher's method. The formula for the statistic is
 |
where pi is the P-value for the ith study. Under the null hypothesis, X2 follows a chi-squared distribution with 2k degrees of freedom, where k is the number of studies. A major limitation of this method is that all studies are weighted equally, which is likely to be highly suboptimal when combining GWAS studies with different sample sizes. An additional problem is that the direction of effect of each SNP is not considered, so that studies with associations in opposite directions appear to strengthen each other rather than contradicting each other.
A major improvement over Fisher's method is a weighted Z-score method, in which P-values are transformed to Z-scores in a one-to-one transformation. The weighted Z-score method is more powerful and efficient than Fisher's method, and allows different weights for different studies (8). It also takes into account the direction of the effect at each SNP. The software METAL (9) implements the weighted Z-score method using the following formula:
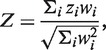 |
where the weight wi = square root of sample size of the ith study,  and pi is the P-value for the ith study. Note that the METAL paper has a typo in this formula but we have confirmed by testing the software that the formula shown above is in fact correctly implemented in the software.
The major alternative to combining P-values and/or Z-scores is to combine effect sizes (estimates). This can be done with either a fixed effects or a random effects model. Combining effect sizes is statistically more powerful than combining Z-scores, but it requires that the trait be measured on exactly the same scale in each study, with the same units, same transformations, etc. This may be achievable in a meta-analysis of a trait with highly standardized measurements, but there are many traits for which it is unlikely to be possible, for example alcohol or tobacco use. The difference between the fixed effects and random effects models is that fixed effects meta-analysis assumes that the genetic effects are the same across the different studies. Fixed effects models provide narrower confidence intervals and significantly lower P-values for the variants than random effects models (1,10–14). Both fixed effects and random effects models are briefly discussed below; details can be found in Nakaoka et al. (2009) (15).
For the fixed effects model, inverse-variance weighting is widely used, although other methods are also available. The weighted average of the effect sizes can be calculated as  and the variance of the weighted average of the effect size is
 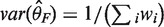 , where
  is the logarithm of the ith case-control study effect,
  is the reciprocal of the estimated variance of the effect size for the ith case-control study.
The random effects model assumes that the mean effect (of each SNP) in each study is different, with those means usually assumed to be chosen from a Gaussian distribution. The variance of that Gaussian distribution, and thus the amount of between-study heterogeneity, is estimated by the model. Thus the random effects model not only does not assume homogeneity of effect but is able to give an estimate of the degree of heterogeneity. The weight of each study incorporates the between-study variance of heterogeneity, which is expressed as  , where
 |
The weight for the random effects model is calculated as 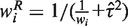 and
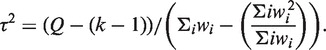
and  , Cochran's test statistic (16) follows a chi-squared distribution with k − 1 degrees of freedom under the assumption of genetic homogeneity. Q is most widely used to check the between-study heterogeneity. But Q is underpowered when the number of studies is small. To overcome this problem, there are some other statistics available, such as H, R and I2, defined as
  ,
,  and
and  , where
  is the genetic effect under the random effects model. H, R and I2 have some desirable characteristics such as being scale and size invariant (10,15). These statistics are calculated separately for each SNP, which leads to the interesting and unsolved question of whether or how one should make a genome-wide determination of heterogeneity.
In addition to these basic methods, almost any meta-analysis method in the statistical literature can be applied to GWAS, and some of the software packages discussed below do so.
DATABASES AND SOFTWARE
Most GWAS meta-analyses are assembled from consortia of investigators working on similar traits, but public databases are also used. The most important GWAS database is the NIH Database of Genotype and Phenotype (dbGaP), which is the repository for both raw data and results from most NIH-funded GWAS. There are also a number of databases that contain selected results from GWAS studies, some of which are suitable for inclusion in meta-analyses of targeted regions. GWAS Central is one of the oldest such databases, which started in 1998 under a different name. On 27 April 2011, it contained 708 studies. The Human Genome Epidemiology Network (HuGE Net) (http://www.hugenet.ca) also has a GWAS integrator webpage and contains a list of publications, hits, variants, disease and trait information etc. Like HuGE Net, The National Human Genome Research Institute (NHGRI) (http://www.genome.gov/gwastudies) maintains a catalog of published GWAS studies (17). Other available databases include the HKSC database with both bone mineral density (BMD) and fracture data (18) and the Millennium Genome Project (MGP) (https://gemdbj.nibio.go.jp/dgdb/), which has a repository of Japanese SNP(JSNP) data (19).
The statistical methods used for GWAS meta-analysis are very straightforward, and it is not difficult to implement them, but there are several software packages available that can make this easier and that integrate useful bioinformatics or visualization functions. The most widely used software is METAL (http://genome.sph.umich.edu/wiki/METAL_Program) (9). METAL implements two strategies, a weighted Z-score method based on sample size, P-value and direction of effect in each study, and an effect-size based method weighted by the study-specific standard error. The other most commonly used package is MetABEL, which is a component of the GenABEL suite in R. MetABEL implements a fixed effects model like METAL, and results can be shown with a visualization tool. A number of other packages are also in use, including META (http://www.stats.ox.ac.uk/~jsliu/meta.html). GWAMA (20) has useful auxiliary features that METAL, MetABEL, and META lack. PLINK (http://pngu.mgh.harvard.edu/~purcell/plink/metaanal.shtml) (21) is a free, open-source software for GWAS analysis, which also has some meta-analysis tools to do fixed effects and random effects meta-analysis. MAGENTA (http://www.broadinstitute.org/mpg/magenta/) (22) can be used to test a specific hypothesis or to generate hypotheses, and it provides gene set enrichment analysis P-values and false discovery rate. Comprehensive Meta-analysis (CMA) (www.Meta-Analysis.com) Software (23) is a commercial package to do meta-analysis which works in a spreadsheet interface and also provides forest plots, which are useful for visualizing between-study heterogeneity (see case study). Review Manager (RevMan) (http://ims.cochrane.org/revman/about-revman-5) (24) is another package that does meta-analysis and provides results in tabular format and graphically. It also provides different kinds of reviews including intervention reviews, diagnostic test accuracy reviews, methodology reviews and overviews of the reviews. There are several STATA modules to perform meta-analysis, such as METAN (25), HETEROGI (25) and more specifically METAGEN (26) (http://bioinformatics.biol.uoa.gr/~pbagos/metagen) for genetic association studies. In R, a few other available packages for meta-analysis are Metafor (http://www.metafor-project.org/) (27), rmeta, and CATMAP. The Metafor package has different functions to calculate fixed, random and mixed effects along with moderator and meta-regression analysis and provides different kinds of graphical displays of results and data. Synthesis-view (https://chgr.mc.vanderbilt.edu/synthesisview) (28) is a visualization tool which can integrate multiple pieces of information across studies, such as P-values, effect sizes, allele frequencies etc. IGG3 (29) can integrate raw GWAS data from multiple chips and provide the input files for different imputation software, which can be used in meta-analysis later. Magi and Morris (2010) made a nice comparison of different features among a number of meta-analysis software packages (20).
One issue that is unique to GWAS meta-analysis is that SNPs may not be coded the same way in different data sets—the so-called ‘strand’ issue. Opposite coding of SNPs in different studies can cause what should be similar effects to look precisely opposite. This often occurs for only a small subset of SNPs (those with minor allele frequencies ∼50%) and so can be very difficult to detect. Most of the meta-analysis software packages discussed above have varying bioinformatics features to resolve this problem, including METAL, MetABEL, META and GWAMA (20).
LITERATURE REVIEW
This review started with a search of GWAS meta-analysis using PubMed on 29 December 2010, which yielded 299 papers. After removing duplicates and irrelevant papers there were 249 GWAS meta-analysis papers (see complete searching and paper collection criteria in the companion paper). Figure 1 summarizes the number of papers by year of publication, illustrating the exponential increase between 2005 and 2010. Figure 2 summarizes the contents of the papers. One hundred and eighty-seven papers (75%) are full GWAS meta-analyses, while 58 papers (23%) are replication analyses on targeted loci (Figure 2A). Figure 2B shows that the majority of reports are biological applications (226 papers; 91%) while 10 papers (4%) are for novel methodology, 4 papers (1%) are databases and software, and 9 papers (4%) are review papers.
Figure 1.

Number of GWAS studies by year of publication. Command used in PubMed search: [‘meta-analysis’(Title/Abstract)] AND [‘genome-wide association’(Title/Abstract)].
Figure 2.

Summary of GWAS meta-analysis review: (A) type of meta-analysis; (B) type of paper; (C) type of meta-analysis method; (D) software used.
Figure 2C and 2D show the methods and software used. One hundred and sixty-four papers (80%) use fixed or random effects models, 28 (14%) combine weighted Z-scores from P-values, 6 (3%) use Fisher's method, and 7 (3%) use direct data merging. For software packages, METAL (41 papers; 45%) and R packages (23 papers; 25%) are the most popular. Other software choices include PLINK (six papers; 7%); GWAMA (three papers; 3%); and GenABEL/MetABEL (five papers; 5%). Detailed information of the paper list and categorization to generate Figure 2 is available in the online Supplementary Data.
CASE STUDY
In this section, we present a simple case study that demonstrates some of the differences among GWAS meta-analysis methods. Two data sets are included in this meta-analysis, which we label here as data set 1 and data set 2. The data sets are from different studies and different populations, but both were genotyped on the Illumina Human660-Quad Beadchip. The phenotype is total meiotic recombination across the genome, which has been of great interest in the genetics literature lately, with many new discoveries especially about the ‘recombination hotspot gene’ PRDM9. Meiotic recombination events for both parents in nuclear families were scored according to Chowdhury et al. (30) The gene RNF212 is well-known to be associated with recombination (30–32), so we report results for four SNPs within this gene. Because the reported associations between RNF212 and recombination differ in males and females, we consider males and females both separately and combined in our case study, which provides an illustration of how the different meta-analysis methods behave in the presence of heterogeneity. All the methods of meta-analysis for our case study were implemented by us in R.
Table 2 shows the results of our case study. The first four rows give the single-study P-values for each SNP in the four data sets (data set 1 male, data set 1 female, data set 2 male, data set 2 female). These are based on standard GWAS methods using linear regression for each SNP under an additive genetic model. No multiple comparisons correction was applied. The notable result is that all P-values are highly significant in the data set 1 males, but not in either set of females. In the data set 2 males, two of the SNPs have P-values of 0.01 and two are on the order of 0.20. Note that the sample size in data set 2 is much smaller than in data set 1, so even if the effects are the same in the two data sets we would expect larger P-values in data set 2.
Table 2.
Case study results
| SNPs in RNF212 |
||||
|---|---|---|---|---|
| rs3796619 | rs4974601 | rs2045065 | rs12645644 | |
| Study analysis | ||||
| Data set 1, P-value | ||||
| Male (n = 736) | 1.4E − 6 | 1.4E − 6 | 1.7E − 6 | 1.8E − 6 |
| Female (n = 736) | 0.76 | 0.76 | 0.19 | 0.25 |
| Data set 2, P-value | ||||
| Male (n = 174) | 0.01 | 0.01 | 0.23 | 0.21 |
| Female (n = 174) | 0.15 | 0.14 | 0.82 | 0.82 |
| Meta-analysis | ||||
| Fisher, P-value | ||||
| Male | 2.7E − 7 | 2.7E − 7 | 6.2E − 6 | 5.9E − 6 |
| Female | 0.36 | 0.35 | 0.45 | 0.52 |
| Combined | 2.6E − 6 | 2.5E − 6 | 5.7E − 5 | 6.7E − 5 |
| Weighted Z, P-value | ||||
| Male | 2.35E − 8 | 2.35E − 8 | 6.87E − 7 | 6.34E − 7 |
| Female | 0.36 | 0.36 | 0.10 | 0.13 |
| Combined | 1.97E − 5 | 1.91E − 5 | 5.96E − 3 | 4.46E − 3 |
| Fixed effect, P-value | ||||
| Male | 1.7E − 8 | 1.7E − 8 | 7.0E − 7 | 6.3E − 7 |
| Female | 0.35 | 0.35 | 0.10 | 0.12 |
| Combined | 2.3E − 7 | 2.2E − 7 | 1.6E − 4 | 1.1E − 4 |
| Random effect, P-value | ||||
| Male | 1.7E − 8 | 1.7E − 8 | 1.7E − 1 | 1.5E − 1 |
| Female | 0.34 | 0.34 | 0.10 | 0.12 |
| Combined | 3.0E − 1 | 3.0E − 1 | 4.5E − 1 | 4.4E − 1 |
When the four meta-analysis methods are used to combine the two male data sets for the first two SNPs, they all perform reasonably well, but there are clear differences. Fisher's method has the lowest power (highest P-values), as would be expected because it is using equal weights for these two very different-sized sets. The highest power is found with both the fixed and random effects models; the similarity of these two methods for these two SNPs indicates that the fixed effects model fits well. For the third and fourth SNPs, the weighted Z-score method and the fixed effects model have better power than Fisher's method. The random effects model estimates a very large random component and gives a very high P-value for the SNP. This is probably an artifact caused by fitting a random effects model to just two data sets. Based on the biology, a fixed effects model is likely to be more or less correct for this phenotype, as long as only a single sex is included in the analysis.
In combining the female data sets, all four meta-analysis methods also behave similarly, reflecting the lack of significant association.
When all four data sets (males and females) are combined, we can clearly see the effect of the heterogeneity on the different meta-analysis methods. In general the fixed effects model retains good power to detect association despite our inclusion of some studies (the females) that have little or no effect, while the random effects model completely loses power because it is fitting an incorrect model of a Gaussian random effect. That is, our male and female effects are not the same, but they are not random either—what we actually have is a mixture of two fixed—effects models. We suggest that the typical situation in a GWAS meta-analysis is likely to be similar to this—a mixture of fixed effects rather than a true random effect—and thus that the random effects model may not be the most appropriate way to deal with heterogeneity in GWAS meta-analysis. This proposition clearly deserves further study, however.
One important way to visualize heterogeneity is with a forest plot, which shows the separate estimates and their confidence intervals for each study, and also shows the combination. Figure 3 is a forest plot for all four SNPs and all four populations in the case study; the overall effect shown in the forest plots is from the fixed-effects model. The R package ‘rmeta’ was used to generate the forest plots. These plots make it very easy to visualize some of the important features that the P-values only hint at, such as the fact that the two male populations are in fact quite consistent with each other despite the differing P-values, and the fact that the female effect is actually in the opposite direction (which is consistent with the recombination literature).
Figure 3.

Forest plot of the selected SNPs.
COMPLICATIONS AND OPEN QUESTIONS
GWAS meta-analysis is now widely used and in general has worked well to discover genetic effects that were not uncovered in individual studies. There are, however, some remaining barriers and open methodological issues.
Genotype data cleaning
Prior to meta-analysis, it is clearly important that all data sets undergo thorough standard GWAS data cleaning, such as filtering out ‘bad’ SNPs and samples using genotype call rates, tests of Hardy–Weinberg equilibrium (HWE), etc (33). What is not entirely clear is how important it is that the data cleaning steps and standards be the same across data sets. For example, can it cause problems if different genotype call rate cutoffs are used in different data sets? This has not been systematically studied to our knowledge. In genetic association studies for targeted SNPs, there have been three ways to deal with HWE: including all studies irrespective of the HWE tests (34), doing sensitivity analysis to verify differential genetic effects in subgroups (15,35–37), and excluding studies with statistically significant deviation from HWE(15,38). More recently, most large consortium meta-analyses have attempted to use consistent HWE cutoffs across studies, which is clearly the safest approach.
It is also not clear whether it is necessary or desirable to implement data cleaning steps that compare data sets to each other. The same SNP assay can behave differently on different chips, or even on the same chip in different batches, and thus it is common to scan data sets for SNPs with widely differing allele frequencies and eliminate them before combining. But if the data sets are from different ethnic groups, there will also be SNPs for which there are ‘true’ differences in allele frequency. It is not clear whether there is a way to distinguish the artifacts from the real differences, and thus it is difficult to recommend an ideal cleaning strategy. Similarly, HWE testing poses issues when data sets are combined (as discussed above), but it is probably clear that HWE tests on combined data sets would be unacceptably conservative. These issues are particularly important in the situation where different studies have different phenotype distributions (or, equivalently, different case : control ratios).
Imputation
When studies are genotyped on different chips, there may be very little overlap in the SNP sets, and thus direct SNP-by-SNP meta-analysis is impossible. For example, the overlap between the Illumina 550K SNP set and the Affymetrix 500K SNP set is only about 100K or 20% of SNPs. The standard solution to this problem is to impute the genotypes of all SNPs in all samples, and a variety of good methods is available for doing so (39). The problem this creates, which has not been carefully addressed in the literature, is that imputed genotypes have slightly higher error rates and variances than non-imputed genotypes. In general, if imputation is done carefully, the error rates are very low. Error rates can be higher, however, for areas of the genome with sparse SNP coverage or for ethnic groups that are not well represented in the data set that is used for imputation reference (usually HapMap or 1000 genomes). As with data cleaning above, this issue can be critical if different studies have different phenotype distributions. If two studies have different case:control ratios and one is genotyped and one imputed for a particular SNP, then there is a resulting difference between case and control variances, which can cause false positive results. Conversely, if one chip has very poor coverage of a region, then imputation will create ‘genotypes’ that actually convey very little information, in which case the meta-analysis can give false negative results because it is averaging in non-informative data sets. Some kind of regionally-smoothed meta-analysis may be the solution to this problem, but such methods have not been developed to our knowledge. In general, it is always advisable to check data quality of replicate results that are based predominantly on imputed data.
Choice of genetic models
In GWAS analysis, the basic association test can be based on an allele frequency comparison or on various statistical contrasts of genotype frequencies, for example an additive model, a dominant model, etc. The same model is used for each SNP, so usually something relatively robust such as the additive model is used (40). It is most desirable in meta-analysis to use the same model in each study, but in post hoc combinations of analyses that might not always be possible. To our knowledge, no one has studied the effect of such variation in association model on meta-analysis. Clearly it causes some level of effect heterogeneity that would, at least formally, violate a fixed effects model, though it would not fit a Gaussian random effects model either. Similar issues arise if different covariates or different methods for controlling for population stratification are used in different studies.
Between-study heterogeneity
As discussed above, between-study heterogeneity should probably be considered the norm in GWAS meta-analysis. Such heterogeneity is important to discover and report, since it can lead to important biological insights, for example differences in the genetic control of male and female recombination. The conventional wisdom in the statistical literature is that when heterogeneity is present or even likely, the random effects model is more appropriate than the fixed effects model. We suggest that this might not be the right approach for GWAS, because (i) the number of studies being combined is often not very large (leading to an imprecise heterogeneity estimate) and (ii) the form of the heterogeneity typically does not fit a Gaussian random effects model. We do suggest that forest plots are an important heuristic method for discovering and understanding heterogeneity, but we also propose that further work on random or mixed-effects models that are a better fit to GWAS data might improve analyses. For example, in our recombination example we know that males and females are likely to be different, so we could fit a model that explicitly has different fixed male and female effects.
CONCLUSION
As the GWAS literature moves away from artificial ‘replication’ and toward the more statistically optimal direct combination of all available data in a meta-analysis framework, it will be critical for investigators to understand the best methods for performing that meta-analysis. While good methods are already in use in most studies, there is room for improvement in many of the details discussed above. Many of the potential improvements are ideally addressed by planning studies in a coordinated manner from the beginning, but that is not always feasible. We still need improved methods for post hoc combinations of studies that may have significant heterogeneity in chip, study population, environmental exposures, association tests, etc. Looking even further ahead, all of the issues addressed above will need to be re-examined for meta-analyses of SNP data derived from sequencing studies, which will undoubtedly be appearing soon in journals throughout the field.
SUPPLEMENTARY DATA
Supplementary Data are available at NAR Online.
FUNDING
National Institutes of Health (NIH) (R01MH077159, RC2HL101715 to G.C.T.); NIH (R01HD38979, R01DE14899 to E.F. and F.B.); NIH (R01GM72007 to D.G.); Huck Institute for Life Sciences (to D.G). Funding for open access charge: University of Pittsburgh.
Conflict of interest statement. None declared.
Supplementary Material
ACKNOWLEDGEMENTS
The authors thank Drs Vivian Cheung and Mary Marazita for the use of their data in the case study. They also thank C Song, X Wang and G Liao for collecting and printing papers.
REFERENCES
- 1.Higgins JP, Thompson SG, Deeks JJ, Altman DG. Measuring inconsistency in meta-analyses. BMJ. 2003;327:557–560. doi: 10.1136/bmj.327.7414.557. [DOI] [PMC free article] [PubMed] [Google Scholar]
- 2.Ioannidis JP. Non-replication and inconsistency in the genome-wide association setting. Hum. Heredity. 2007;64:203–213. doi: 10.1159/000103512. [DOI] [PubMed] [Google Scholar]
- 3.Thompson JR, Attia J, Minelli C. The meta-analysis of genome-wide association studies. Brief. Bioinformatics. 2011;12:259–269. doi: 10.1093/bib/bbr020. [DOI] [PubMed] [Google Scholar]
- 4.Thompson SG. Why sources of heterogeneity in meta-analysis should be investigated. BMJ. 1994;309:1351–1355. doi: 10.1136/bmj.309.6965.1351. [DOI] [PMC free article] [PubMed] [Google Scholar]
- 5.Guerra R, Goldstein DR. Meta-analysis and Combining Information in Genetics and Genomics. Florence, KY: CRC press, Taylor and Francis Group and a Chapman and Hall book; 2010. [Google Scholar]
- 6.Lin DY, Zeng D. Meta-analysis of genome-wide association studies: no efficiency gain in using individual participant data. Genet. Epidemiol. 2010;34:60–66. doi: 10.1002/gepi.20435. [DOI] [PMC free article] [PubMed] [Google Scholar]
- 7.Zeggini E, Ioannidis JP. Meta-analysis in genome-wide association studies. Pharmacogenomics. 2009;10:191–201. doi: 10.2217/14622416.10.2.191. [DOI] [PMC free article] [PubMed] [Google Scholar]
- 8.Whitlock MC. Combining probability from independent tests: the weighted Z-method is superior to Fisher's approach. J. Evol. Biol. 2005;18:1368–1373. doi: 10.1111/j.1420-9101.2005.00917.x. [DOI] [PubMed] [Google Scholar]
- 9.Willer CJ, Li Y, Abecasis GR. METAL: fast and efficient meta-analysis of genomewide association scans. Bioinformatics. 2010;26:2190–2191. doi: 10.1093/bioinformatics/btq340. [DOI] [PMC free article] [PubMed] [Google Scholar]
- 10.Higgins JP, Thompson SG. Quantifying heterogeneity in a meta-analysis. Stat. Med. 2002;21:1539–1558. doi: 10.1002/sim.1186. [DOI] [PubMed] [Google Scholar]
- 11.Ioannidis JPA, Patsopoulos NA, Evangelou E. Heterogeneity in meta-analysis of genome-wide association investigations. PLOS One. 2007:e841. doi: 10.1371/journal.pone.0000841. [DOI] [PMC free article] [PubMed] [Google Scholar]
- 12.Lau J, Ioannidis JP, Schmid CH. Quantitive synthesis in systematic reviews. Ann. Intern. Med. 1997;126:820–826. doi: 10.7326/0003-4819-127-9-199711010-00008. [DOI] [PubMed] [Google Scholar]
- 13.Lau J, Ioannidis JP, Schmid CH. Summing up evidence: one answer is not always enough. Lancet. 1998;351:123–127. doi: 10.1016/S0140-6736(97)08468-7. [DOI] [PubMed] [Google Scholar]
- 14.Sutton AJ, Abraham KR, Jones DR, Sheldon TA, Song F. Methods for Meta-analysis in Medical Research. Hoboken, New Jersey.: John Wiley and Sons; 2000. [Google Scholar]
- 15.Nakaoka H, Inoue I. Meta-analysis of genetic association studies: methodologies, between-study heterogeneity and winner's curse. J. Hum. Genet. 2009;54:615–623. doi: 10.1038/jhg.2009.95. [DOI] [PubMed] [Google Scholar]
- 16.Cochran WG. The combination of estimates from different experiments. Biometrics. 1954;10:101–129. [Google Scholar]
- 17.Kim ST, Cheng Y, Hsu FC, Jin T, Kader AK, Zheng SL, Isaacs WB, Xu J, Sun J. Prostate cancer risk-associated variants reported from genome-wide association studies: meta-analysis and their contribution to genetic variation. The Prostate. 2010;70:1729–1738. doi: 10.1002/pros.21208. [DOI] [PMC free article] [PubMed] [Google Scholar]
- 18.Kung AW, Xiao SM, Cherny S, Li GH, Gao Y, Tso G, Lau KS, Luk KD, Liu JM, Cui B, et al. Association of JAG1 with bone mineral density and osteoporotic fractures: a genome-wide association study and follow-up replication studies. American J. Hum. Genet. 2010;86:229–239. doi: 10.1016/j.ajhg.2009.12.014. [DOI] [PMC free article] [PubMed] [Google Scholar]
- 19.Hirakawa MTT, Hashimoto Y, Kuroda M, Takagi T, Nakamura Y. JSNP: a database of common gene variations in the Japanese population. Nucleic Acids Res. 2002;30:158–162. doi: 10.1093/nar/30.1.158. [DOI] [PMC free article] [PubMed] [Google Scholar]
- 20.Magi R, Morris AP. GWAMA: software for genome-wide association meta-analysis. BMC Bioinformatics. 2010;11:288. doi: 10.1186/1471-2105-11-288. [DOI] [PMC free article] [PubMed] [Google Scholar]
- 21.Purcell S, Neale B, Todd-Brown K, Thomas L, Ferreira MA, Bender D, Maller J, Sklar P, de Bakker PI, Daly MJ, et al. PLINK: a tool set for whole-genome association and population-based linkage analyses. American J. Hum. Genet. 2007;81:559–575. doi: 10.1086/519795. [DOI] [PMC free article] [PubMed] [Google Scholar]
- 22.Segre AV, Groop L, Mootha VK, Daly MJ, Altshuler D. Common inherited variation in mitochondrial genes is not enriched for associations with type 2 diabetes or related glycemic traits. PLoS Genetics. 2010;124:264–268. doi: 10.1371/journal.pgen.1001058. [DOI] [PMC free article] [PubMed] [Google Scholar]
- 23.Qu HQ, Bradfield JP, Li Q, Kim C, Frackelton E, Grant SF, Hakonarson H, Polychronakos C. In silico replication of the genome-wide association results of the Type 1 Diabetes Genetics Consortium. Hum. Mol. Genet. 2010;19:2534–2538. doi: 10.1093/hmg/ddq133. [DOI] [PubMed] [Google Scholar]
- 24.Review Manager (RevMan) [Computer program] Version 5.1. Copenhagen: The Nordic Cochrane Centre, The Cochrane Collaboration; 2011. [Google Scholar]
- 25.Patsopoulos NA, Ioannidis JP. Susceptibility variants for rheumatoid arthritis in the TRAF1-C5 and 6q23 loci: a meta-analysis. Ann. Rheumatic Diseases. 2010;69:561–566. doi: 10.1136/ard.2009.109447. [DOI] [PubMed] [Google Scholar]
- 26.Wu YW, Rong TY, Li HH, Xiao Q, Fei QZ, Tan EK, Ding JQ, Chen SD. Analysis of Lingo1 variant in sporadic and familial essential tremor among Asians. Acta. Neurol. Scand. 2010;6:e1001058. doi: 10.1111/j.1600-0404.2010.01466.x. [DOI] [PubMed] [Google Scholar]
- 27.Viechtbauer W. Conducting meta-analyses in R with the metafor package. J. Stat. Software. 2010;36:1–48. [Google Scholar]
- 28.Pendergrass SA, Dudek SM, Crawford DC, Ritchie MD. Synthesis-View: visualization and interpretation of SNP association results for multi-cohort, multi-phenotype data and meta-analysis. BioData Mining. 2010;3:10. doi: 10.1186/1756-0381-3-10. [DOI] [PMC free article] [PubMed] [Google Scholar]
- 29.Li MX, Jiang L, Kao PY, Sham PC, Song YQ. IGG3: a tool to rapidly integrate large genotype datasets for whole-genome imputation and individual-level meta-analysis. Bioinformatics. 2009;25:1449–1450. doi: 10.1093/bioinformatics/btp183. [DOI] [PubMed] [Google Scholar]
- 30.Chowdhury R, Bois PR, Feingold E, Sherman SL, Cheung VG. Genetic analysis of variation in human meiotic recombination. PLoS Genet. 2009;5:e1000648. doi: 10.1371/journal.pgen.1000648. [DOI] [PMC free article] [PubMed] [Google Scholar]
- 31.Fledel-Alon A, Leffler EM, Guan Y, Stephens M, Coop G, Przeworski M. Variation in human recombination rates and its genetic determinants. PLoS One. 2011;6:e20321. doi: 10.1371/journal.pone.0020321. [DOI] [PMC free article] [PubMed] [Google Scholar]
- 32.Kong A, Thorleifsson G, Stefansson H, Masson G, Helgason A, Gudbjartsson DF, Jonsdottir GM, Gudjonsson SA, Sverrisson S, Thorlacius T, et al. Sequence variants in the RNF212 gene associate with genome-wide recombination rate. Science. 2008;319:1398–1401. doi: 10.1126/science.1152422. [DOI] [PubMed] [Google Scholar]
- 33.Laurie CC, Doheny KF, Mirel DB, Pugh EW, Bierut LJ, Bhangale T, Boehm F, Caporaso NE, Cornelis MC, Edenberg HJ, et al. Quality control and quality assurance in genotypic data for genome-wide association studies. Genet. Epidemiol. 2010;34:591–602. doi: 10.1002/gepi.20516. [DOI] [PMC free article] [PubMed] [Google Scholar]
- 34.Minelli C, Thompson JR, Abrams KR, Thakkinstian A, Attia J. How should we use information about HWE in the meta-analyses of genetic association studies? Int. J. Epidemiol. 2008;37:136–146. doi: 10.1093/ije/dym234. [DOI] [PubMed] [Google Scholar]
- 35.Salanti G, Sanderson S, Higgins JP. Obstacles and opportunities in meta-analysis of genetic association studies. Genet. Med. Official J. Am. College Med. Genet. 2005;7:13–20. doi: 10.1097/01.gim.0000151839.12032.1a. [DOI] [PubMed] [Google Scholar]
- 36.Thakkinstian A, McElduff P, D'Este C, Duffy D, Attia J. A method for meta-analysis of molecular association studies. Stat. Med. 2005;24:1291–1306. doi: 10.1002/sim.2010. [DOI] [PubMed] [Google Scholar]
- 37.Zintzaras E, Lau J. Trends in meta-analysis of genetic association studies. J. Hum. Genet. 2008;53:1–9. doi: 10.1007/s10038-007-0223-5. [DOI] [PubMed] [Google Scholar]
- 38.Munafo MR, Flint J. Meta-analysis of genetic association studies. Trends Genet. 2004;20:439–444. doi: 10.1016/j.tig.2004.06.014. [DOI] [PubMed] [Google Scholar]
- 39.Marchini J, Howie B. Genotype imputation for genome-wide association studies. Nat. Rev. Genet. 2010;11:499–511. doi: 10.1038/nrg2796. [DOI] [PubMed] [Google Scholar]
- 40.Kuo CL, Feingold E. What's the best statistic for a simple test of genetic association in a case-control study? Genet. Epidemiol. 2010;34:246–253. doi: 10.1002/gepi.20455. [DOI] [PubMed] [Google Scholar]
Associated Data
This section collects any data citations, data availability statements, or supplementary materials included in this article.