


Abstract
It has been proposed that certain type II restriction enzymes (REs), such as EcoRV, track the helical pitch of DNA as they diffuse along DNA, a so-called rotation-coupled sliding. As of yet, there is no direct experimental observation of this phenomenon, but mounting indirect evidence gained from single-molecule imaging of RE–DNA complexes support the hypothesis. We address this issue by conjugating fluorescent labels of varying size (organic dyes, proteins and quantum dots) to EcoRV, and by fusing it to the engineered Rop protein scRM6. Single-molecule imaging of these modified EcoRVs sliding along DNA provides us with their linear diffusion constant (D1), revealing a significant size dependency. To account for the dependence of D1 on the size of the EcoRV label, we have developed four theoretical models describing different types of motion along DNA and find that our experimental results are best described by rotation-coupled sliding of the protein. The similarity of EcoRV to other type II REs and DNA binding proteins suggests that this type of motion could be widely preserved in other biological contexts.
INTRODUCTION
Proteins that interact with DNA are essential for maintenance and expression of the genetic information. For some of these proteins, it is crucial to rapidly find a recognition site amidst a large excess of competitor DNA. As direct binding to a recognition site is unlikely, the process of target site location begins with the formation of a non-specific protein–DNA complex, followed by protein translocation along the DNA to the specific binding site. Apart from ATP-dependent directional motion, translocation can be achieved by random mechanisms, so-called facilitated diffusion (1), that include sliding, hopping and/or jumping, and by intersegment transfer (2–4).
In the past few years, high-resolution fluorescence microscopy techniques, down to the single-molecule level, have been developed to directly visualize the mechanisms involved in target site location (5–7). Using these techniques, the facilitated diffusion of a growing number of DNA binding proteins has been characterized, and the 1D diffusion constant (D1) of proteins labeled with organic dyes (8), other proteins or quantum dot nanoparticles (QDs) (9) has been measured.
Restriction enzymes (REs) were among the first proteins whose facilitated diffusion was studied (10). These enzymes are part of restriction-modification systems in bacteria, and mainly defend the host organism against foreign DNA (11–14). EcoRV is one of the best studied RE that belongs to the Type II family, whose members do not require ATP for translocation along DNA (15). EcoRV searches for its target site by random 1D walks along non-specific DNA (sliding) and 3D translocations (hopping or jumping). This is in contrast to directional translocations performed by Type I REs (16) or RNA polymerases (17,18). Due to its important role in the defense of the host, EcoRV must reconcile two objectives: it must find its target site rapidly, but a careful probing of the sequence information presented in the major and minor groove of DNA is necessary to avoid missing the target. One way of accomplishing such a careful search is for EcoRV to follow the helical pitch of the DNA during its diffusion. So far, direct observation of such a rotation-coupled sliding has not been reported, certainly because of the speed and randomness of the subnanometer sized steps of the translocation. Despite lack of hard evidence, several arguments are in favor of this type of motion for EcoRV. A rotation-coupled motion would slow down the effective diffusion of the enzyme, which is consistent with value of D1 observed for EcoRV (8). Indirect evidence that REs do not overlook recognition sites, and that they pause upon encountering ‘star’ sites (i.e. sites that differ in 1 bp from the canonical recognition sequence), also supports rotation-coupled sliding (19), as well as the dependence of D1 on the protein size reported by Blainey et al. (20) who studied the diffusion of various DNA binding proteins and one RE.
Here, we employed a new approach to investigate a potential rotation-coupled motion of EcoRV as it slides along DNA. To modulate the effective size of EcoRV, we conjugated the enzyme to five fluorescent labels ranging from small organic dyes (radius, r ∼ 0.5 nm) to large QDs (r ∼ 15.4 nm) and we produced a variant of EcoRV fused to an engineered fluorescent Rop protein scRM6 (21). Using single-molecule imaging, we measured the diffusion constants of these modified EcoRV sliding on elongated DNA. To understand the observed motion of the enzymes, we compared our experimental results with theoretical diffusion constants predicted by four different models of EcoRV motion. These models consider a purely linear diffusion or a rotation-coupled diffusion of the enzyme with the fluorescent label attached to EcoRV by either a rigid or a flexible linker (22). The comparison between our data and the dependence of D1 on the label size predicted by these models strongly supports a rotation-coupled sliding of EcoRV along the DNA helix.
MATERIALS AND METHODS
EcoRV purification and labeling
A single-cysteine, His6-tagged EcoRV K58C variant was purified as described previously (23). The enzyme was biotinylated at the cysteine residue with a maleimide derivative [Maleimide-PEG2 (or PEG11)-Biotin, Pierce] by incubating it in a 1:1 ratio for 1 h at 4°C in PBS buffer. The biotin molecule was introduced through a flexible polyethylene glycol (PEG) linker of n = 2 or 11 U (PEG2 or PEG11), which provides flexibility between the protein and the label (Supplementary Data). Biotinylated EcoRV was incubated with commercial polymer QD-streptavidin conjugate (Qdot605 Streptavidin, Invitrogen) in a 1:1 ratio for 30 min at 4°C in PBS buffer. Then, a 4-fold excess of biocytin (Sigma Aldrich) was added to the reaction mixture, in order to block the unreacted streptavidin on the QD surface. The labeling of EcoRV with peptide-coated QDEO6 was achieved by interaction of the His6-tag of EcoRV with the surface of QD nanoparticle (24). The enzyme and QDs were incubated at a 1:3 molar ratio for 30 min at 4°C in PBS buffer. The conjugation efficiency and stoichiometry of EcoRV and QDEO6 was confirmed using gel electrophoresis as previously described (24). As with the PEG linkers, the terminal His6-tag provides flexibility (25,26) between the QD label and EcoRV (Supplementary Data).
In experiments using QD655 and savCy3 as fluorescent labels, we used the same K58C EcoRV variant biotinylated with the same Maleimide-PEG2-Biotin (Pierce) derivative.
EcoRV-scRM6 fusion protein purification and labeling
The EcoRV-scRM6 fusion protein was created by fusing the single cysteine (sc) variant scRM6 D54C via its C-terminus to the N-terminus of the cysteine free variant of EcoRV. A modified gene coding for scRM6, in which eight native cysteines had been replaced by alanines (positions 33, 47, 90, 104, 147, 161, 204 and 218), was synthesized by GeneArt, and a single cysteine was introduced at position 54 in the first loop for fluorescent labeling. The genes coding for scRM6 D54C and cysteine-free EcoRV were consecutively introduced into the vector pET28a coding for an N-terminal His6-tag. In this way, two scRM6 proteins were fused to the EcoRV homodimer, each extending the N-terminal α-helix of the EcoRV subunits, thereby forming a rigid connection. A noticeable influence of the scRM6 domain on the activity of EcoRV was not observed, which suggests that the specific binding and cleavage of the fusion construct is only slightly affected compared to wild-type EcoRV.
The single-cysteine EcoRV-scRM6 fusion protein was purified using Ni-NTA Agarose (Qiagen) similarly as described previously (27). The labeling with the Cy3B fluorophore (GE Healthcare) was achieved by incubating the fusion enzyme with Cy3B in a 1:10 molar ratio overnight at 4°C in 1 × PBS buffer. The free fluorophore and impurities from protein purification were removed using a HiTrap Heparin HP column (GE Healthcare) connected to the ÄKTApurifier (GE Healthcare). The fractions containing labeled enzyme were collected and dialyzed overnight against the storage buffer (30 mM K-phosphate pH 7.4, 5 mM DTT, 200 mM NaCl, 1 mM EDTA, 60% glycerol).
DNA preparation and stretching
DNA with biotinylated ends and without any recognition site for EcoRV was prepared as previously described (8). The DNA molecules were stretched to ∼70% of their contour length and attached to a streptavidin functionalized coverslip by their ends, ensuring that most of a stretched DNA molecule was freely accessible in solution. Non-specific interactions between the enzymes, labels and residual streptavidin on the surface were prevented by incubation with casein blocking reagent (Roche Diagnostics) for 15 min. The measurements with EcoRV labeled with different QDs were performed at pH 7.4 using a 20-mM phosphate buffer containing 20 mM NaCl, 2 mM MgCl2, 1 mM DTT and 0.1 mg/ml blocking reagent. The measurements with EcoRV-scRM6 fusion protein were performed at pH 7.4 using 1× KGB buffer (100 mM k-glutamate, 20 mM NaCl, 25 mM Tris–acetate pH 7.4, 10 mM Mg-acetate, 1 mM DTT and 0.1 mg/ml blocking reagent), as the DNA/EcoRV-scRM6 interaction time in phosphate buffer was too short for an accurate measurement of the diffusion constant.
Optical set-up
For detection of individual labeled enzymes, we used a TIRFM setup, previously described in detail (8). Briefly, the stretched DNA molecules were first stained with SybrGold and visualized through a 480DF40 excitation filter and a 505-LP emission filter (Omega Optical) after excitation using a mercury lamp. Once the DNA was located in the field of view, SybrGold was removed using a buffer containing 20 mM MgCl2. The labeled enzymes were then injected into the flow cell, and the flow was stopped. Labeled enzymes were excited using a laser at 532 nm (intensity ∼100 W/cm2), visualized through a bandpass filter appropriate for the label, and imaged on an EMCCD camera (Ixon, Andor Technology) with an exposure time of 20 ms. To locate the proteins on the DNA, the point-spread function of the fluorescent spots was fit using a 2D Gaussian function in each frame of the image sequence, using a home-made software.
Data analysis
The diffusion constant D1 of the labeled enzymes was derived from the mean square displacement (MSD) calculated from enzyme trajectories longer than 20 successive frames (28 trajectories for QD605-PEG2-EcoRV, 24 trajectories for QD605-PEG11-EcoRV, 27 trajectories for QDEO6-EcoRV and 45 trajectories for EcoRV-scRM6). The main error in the estimation of D1 stems from the inaccuracy in determining the position of the DNA ends, and thus the DNA stretch rate. This rate is included in the calculation of the MSD for taking into account the effective translocation of the enzyme along the DNA. Assuming a localization accuracy of ∼120 nm for the end-to-end distance (∼2 µm), we obtained ΔD/D ∼ 0.15, which was translated into error bars on the MSD plots (Figure 3).
Figure 3.

Dependence of the normalized friction coefficient ξ (rl)/ξ (0) of a single-labeled (Models 1–4) or double-labeled (Model 5) EcoRV on the radius rl of the label(s): (1) linear diffusion with a rigid linker, (2) rotational diffusion with a rigid linker, (3) linear diffusion with a flexible linker, (4) rotational diffusion with a flexible linker, (5) rotational diffusion with a rigid linker. EcoRV is presented schematically in magenta, DNA in green and the label in orange. Experimental normalized friction coefficients ξ (in red) are calculated using ξ (rl)/ξ (0) = DCy3B/D1, where DCy3B is the linear diffusion constant of EcoRV labeled with Cy3B, and D1 is the linear diffusion constant of a protein variant with one or two label(s) of radius rl.
RESULTS
First, we conjugated fluorescent labels varying in size by a factor of 30 (Figure 1A) to the K58C variant of EcoRV. We estimated the hydrodynamic radius (rl) of the different labels using fluorescence correlation spectroscopy (FCS) (Supplementary Figure S1, Supplementary Table S1). The organic dye Cy3B (rl ∼ 0.5 nm) was attached to EcoRV via a single cysteine residue. The fluorescent protein streptavidin-Cy3 (savCy3, rl ∼ 2.1 nm), and commercial streptavidin/polymer coated QDs (QD605, rl ∼ 10.0 nm; QD655, rl ∼ 15.4 nm) were attached to EcoRV by biotinylating EcoRV at the same cysteine residue (C58). Smaller QDs (QDEO6, rl ∼ 7.2 nm) than those available commercially were prepared with a coating of short hydrophilic peptides, and EcoRV was directly conjugated through its N-terminal His6-tag to the nanoparticle surface (24).
Figure 1.

(A) A schematic display of different labels attached to EcoRV. The 2D representation of EcoRV and DNA is drawn around the crystal structure of the EcoRV/DNA complex (protein data bank 4rve). The labels are attached to the enzyme via flexible polyethylene glycol linkers (PEG2 or PEG11) at residue 58, or via the N-terminal polyhistidine His6-tag (located in the vicinity of the position 58). Radii of different labels are: Cy3B ∼ 0.5 nm, sav-Cy3 ∼ 2.1 nm, QDEO6 ∼ 7.2 nm, QD605 ∼ 10 nm, QD655 ∼ 15.4 nm. EcoRV and labels are drawn to scale. (B) The longitudinal MSD of EcoRV labeled with QDE06 or QD605 via PEG linkers of different length. The MSD depends linearly on time, which shows that the QD labeled enzyme slides along the DNA. The linear diffusion constant D1 is derived from the slope of the curve (dashed lines: linear fits on the first five points of the MSD) using the relation: slope = 2D.
Next, we fused two engineered Rop proteins (scRM6) to one EcoRV protein, each at the N-terminal α-helix of the two EcoRV subunits, and further labeled this fusion construct with Cy3B (Figure 2A). From the hydrodynamic radius of the fusion construct, measured using FCS (Supplementary Figure S2), we derived an effective radius rl ∼ 3.1 nm for each of the scRM6 proteins.
Figure 2.

(A) One possible model of EcoRV (protein data bank 4rve) fused to scRM6 protein (protein data bank 1qx8), in which the structure of scRM6 protein is aligned with the N-terminal helix of EcoRV. EcoRV is presented in magenta, DNA in green, scRM6 protein in gray and the label in orange. (B) The longitudinal (along the DNA molecule) and transverse (perpendicular to the DNA molecule) MSD of EcoRV fused to the scRM6 protein labeled with Cy3B. The longitudinal MSD depends linearly on time, which shows that the fusion protein slides along the DNA, while, as expected, the transverse MSD is constant over time. The linear diffusion constant D is derived from the slope of the curve (dashed line: linear fit on the first five points of the MSD) using the relation: slope = 2D.
We optimized an optical system to observe individual EcoRV interacting with DNA (8). These experiments were performed on a TIRF microscope with laser excitation, filters for detecting the labels and an EMCCD camera for imaging single-molecule events. The DNA was elongated on the surface of a glass coverslip using a custom flow cell and tethered via the biotin–streptavidin interaction. Based on this setup, we were able to directly observe individual EcoRV molecules sliding along DNA (Supplementary Figure S4). From the reconstructed trajectories of the enzymes, we calculated MSDs and derived D1 for the modified EcoRVs.
From our measurements, we calculated the MSD of EcoRV labeled with QDs (Figure 1B) and fusion protein (Figure 2B). For QDEO6 labeled EcoRV, we derived D1 = (1.08 ± 0.16) × 10−2 µm2 s−1. Similarly, for QD605 labeled EcoRV via the PEG2 linker, we found D1 = (0.48 ± 0.07) × 10−2 µm2 s−1. Substitution of the PEG2 linker with longer PEG11 did not significantly alter the diffusion constant of QD605 labeled EcoRV [D1 = (0.63 ± 0.07) × 10−2 µm2 s−1]. The smallest diffusion constant, in the present series of experiments, was observed for the EcoRV fusion construct, for which we found D1 = (0.24 ± 0.04) × 10−2 µm2 s−1 (Figure 2B).
In previous studies, we determined the diffusion constant for EcoRV labeled with Cy3B (8), savCy3 (22) and QD655 (9). We found that D1 was similar for EcoRV labeled with Cy3B [D1 = (1.1 ± 0.2) × 10−2 µm2 s−1] or savCy3 [D1 = (1.2 ± 0.1) × 10−2 µm2 s−1], but that D1 decreased by a factor of three when EcoRV was labeled with QD655 [D1 = (0.32 ± 0.02) × 10−2 µm2 s−1]. For the QD655 label, the same EcoRV diffusion constant was measured while the DNA was removed from the surface by optical tweezers (9), suggesting that the surface does not impede the protein diffusion.
DISCUSSION
A direct observation of a RE rotating while sliding on DNA is a difficult task. Using even the most sophisticated cameras, a few milliseconds of exposure time is necessary to detect the light emitted by a single fluorophore. During this short time, the length over which a protein slides along the DNA is tens of nm (20 nm for EcoRV, with D1 ∼ 10−2 µm2 s−1 and an exposure time of 20 ms), meaning that the protein may circle around the DNA several times during the acquisition of a single image. This limitation makes directly observing rotational motion unrealistic. So until improvements to instrumentation and methodology allow for acquisitions in the microsecond range, an indirect strategy is necessary to study this phenomenon.
Attaching large labels to a protein sliding along the DNA is one of these strategies. By slowing down, the protein in its course, the label decreases the diffusion constant; this is experimentally accessible, and thus may help to find out if the protein rotates while sliding. To further assist in obtaining accurate diffusion constants, we used conditions of low ionic strength that helped achieve DNA–EcoRV interaction time in the range of a second. Although the ionic strength was lower than the physiological one, we do not expect the diffusion constant to depend on the salt concentration (9,28). In addition, at low salt conditions, hopping does not affect the diffusion constant (8); the effect of small jumps can be seen as an increase of the measured diffusion constant only at high salt conditions (>40 mM).
The interpretation of our experimental data required developing models accounting for different types of motion on the DNA. Here, we considered a framework developed by Bonnet et al. (22). We derive an effective friction coefficient ξ from the linear diffusion constant D1 of the modified EcoRV using the Stokes–Einstein relation: D1 = kBT/ξ, where kB is the Boltzmann constant and T the absolute temperature. Then, normalized friction coefficients for each of the six-labeled EcoRV enzymes are obtained by dividing ξ by the friction coefficient of EcoRV labeled with Cy3B, which is considered as the friction coefficient of an unlabeled enzyme as the radius of Cy3B is small compared to that of EcoRV. This allows us to compare the dependence of ξ on the label radius with the predictions of four different models.
The models we considered were: (i) linear diffusion of EcoRV along DNA, with a rigid linker between the label and the enzyme; (ii) rotational diffusion with a rigid linker; (iii) linear diffusion with a flexible linker between the label and the enzyme and (iv) rotational diffusion with a flexible linker (Figure 3).
In the first two models, the protein label complex is considered as a solid, as the linker is rigid. In this case, the friction coefficient ξ of the complex is given by ξ = f × (ξp +ξl), where ξp and ξl are the 3D friction coefficients of the protein and of the label, respectively, and f > 1 accounts for DNA–protein friction.
In the first model the labeled enzyme diffuses along the DNA without rotating, so ξp and ξl are translational friction coefficients (denoted as  and
and  ). In this model, the friction coefficient
  is given by the Stokes’ law:
where η is the viscosity of the solution, and rp is the hydrodynamic radius of EcoRV. Since ξ(0) =6πηflinrp is the friction coefficient of an unlabeled enzyme, the previous equation becomes:
As the size of the organic dye Cy3B is small compared to the size of EcoRV, ξ(0) is also the friction coefficient of EcoRV labeled with Cy3B. Thus, the numerical value of ξ(0) can be derived from the experimental value of the diffusion constant DCy3B of EcoRV labeled with Cy3B along DNA, using the Stokes–Einstein relation 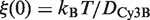 . In the first model, the normalized friction coefficient
 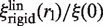 is thus expected to increase linearly with the label radius (Figure 3).
In the second model the EcoRV-label complex rotates while sliding, and the linker is rigid. The friction coefficients ξp and ξl include both translation and rotation. Yet, they can be equated to the rotational friction coefficients (denoted as  and
and  ), as the rotational contribution to friction is much larger than translational (29). The friction coefficient
  is thus given by (22):
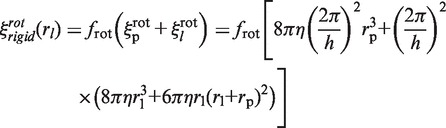 |
with h = 3.4 nm (one helix turn). The term  is proportional to
  as we assume that the protein's center of mass is located on the DNA axis, as suggested by the crystallographic structure of the non-specific DNA–EcoRV complex (22). The term
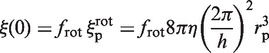
  refers to the rotation-coupled diffusion of the label, the center of mass of which is supposed to be at a distance rp +rl from the DNA axis (22). If ξ(0) is the friction coefficient of the unlabeled enzyme, given by:
 |
then (22):
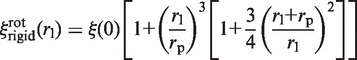 |
and it can be seen that the normalized friction coefficient  of the complex strongly depends on the label radius rl (Figure 3). The value of ξ(0) does not depend on the model, since it represents the friction coefficient of the unlabeled enzyme.
The Models 3 and 4 assume a flexible linker between the protein and the label. The Brownian motion of the label can thus be partially decoupled from that of the protein (22), and the friction coefficient ξ of the protein-label complex is given by ξ = fξp + ξl In this case, only the friction coefficient of the protein is influenced by the additional factor f because of the decoupling of the protein and label motions.
In the case of linear diffusion of the enzyme along DNA (Model 3), the friction coefficient  is given by the Stokes’ law:
with  as in the case of a rigid link.
  differs from
  because of the additional 1/flin factor, which must be evaluated for comparison with experimental data. As flin accounts for the additional friction due to the protein–DNA interaction, it is given by
  , where
  is the 3D diffusion coefficient of EcoRV (22). Assuming rp = 3.9 nm for EcoRV, obtained by FCS (8), and thus Dp = 54 µm2 s−1, one gets flin≈ 5.3 × 10³ (with
  the diffusion constant along DNA of EcoRV labeled with Cy3B). Thus, while
  and
and  both depend linearly on rp, the dependence of
  is much weaker than that of
  (Figure 3).
If the EcoRV-label complex rotates while sliding, assuming a flexible linker (Model 4), the friction coefficient  is given by (22):
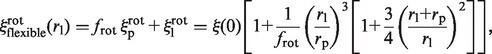 |
with
 |
as in the case of a rigid link. Here again, 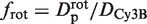 must be evaluated. It differs from flin, as it now accounts for the rotation of the enzyme during sliding, so that
 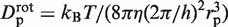 . Assuming rp = 3.9 nm, one gets frot ≈ 74. Since frot is much smaller than flin, the dependence of
  on rl is lower than that of
  , though noticeable (Figure 3).
For the comparison of our experimental data with the predictions of the models, we distinguish between EcoRV labeled with savCy3 and QDs (via a PEG linker or a His6-tag) and EcoRV fused to scRM6. When EcoRV is labeled with savCy3 or QDs, the linker can be considered as flexible (see Supplementary Data), and we expect the diffusion constant to be in agreement with the results predicted by the Model 3 or 4 depending on whether or not EcoRV rotates while sliding. For the fusion protein, the modified EcoRV can be considered as a rigid body: (i) the engineered Rop protein (21) is a homotetramer with a heptad sequence periodicity, and thus forms a stable coiled-coil structure, (ii) the two scRM6 proteins were fused to the EcoRV homodimer, each extending the N-terminal α-helix of the one EcoRV subunit and forming a rigid connection because the hydrogen bonds of the continuous α-helix are formed across the junction of the EcoRV N-terminal helix and the scRM6 helix. Thus, we expect the diffusion constant to be in agreement with the results of the Models 1 or 2, depending on the nature of the motion of the enzyme along DNA. In addition, two scRM6 are attached to a single EcoRV, whereas the models consider a single label attached to the enzyme. The models should therefore be amended accordingly.
Our measurements with EcoRV labeled with savCy3 or QDs are in excellent agreement with a model in which EcoRV rotates while diffusing along DNA (Model 4 in Figure 3). The remaining three models simply cannot account for the experimental data. In the case of EcoRV-QD605, we found that the friction coefficients were similar when the linker was either PEG2 or PEG11. This result confirms that sufficient flexibility for the framework of Bonnet et al. (22) to be valid can be achieved even with a 3 nm contour length linker (see Supplementary Data).
For quantitative interpretation of the experimental value of the diffusion constant of EcoRV fused to scRM6, we considered that the fusion protein can be modeled as EcoRV labeled with two spherical labels of radius rl rigidly attached to the enzyme (Supplementary Figure S3), and we derived rl ∼ 3.1 nm from an FCS measurement of the 3D diffusion coefficient of the EcoRV fusion protein (Supplementary Data). A direct comparison of D1 with the results predicted by the models (Figure 3) cannot be made, as the models consider only one label attached to the enzyme. Yet the value of ξ (2 labels, rl)/ξ(0) for a protein with two identical labels of radius rl can be easily deduced from the value of ξ (1 label, rl)/ξ(0) as derived earlier (Supplementary Data):
Once again, we found that D1 measured for EcoRV fused to scRM6 is in agreement with the model of EcoRV rotating along DNA assuming that scRM6 is rigidly attached to the enzyme (Figure 3), and that the remaining three models cannot account for the experimental data.
Other models could have been considered to account for our experimental data. For instance, it has been proposed that facilitated diffusion could imply a rotation-coupled diffusion alternating with a pure translational diffusion along the DNA (30). At least one additional parameter is needed in this model (e.g. the fraction of time spent sliding without rotating), which is not the case in our approach as adjustable parameters are not necessary to account for the data.
In summary, we used different conjugation strategies to prepare EcoRV REs with fluorescent labels of varying size, with rigid or flexible linkers. This enabled us to compare several models for the motion of EcoRV along DNA with experimental data obtained by single-molecule measurements. Our results show that the behavior of EcoRV can only be predicated by the model in which EcoRV diffuses along DNA following the pitch of the double helix, which provides further evidence for rotation-coupled sliding. We have also shown that not only the size of the label, but the flexibility of the linker must be considered. This may also be relevant when interpreting the diffusion parameters of biomolecules with large labels, like QDs, in other contexts, including the behavior of individual molecular motors or the transport and motion of proteins in living cells.
SUPPLEMENTARY DATA
Supplementary Data are available at NAR Online: Supplementary Table 1; Supplementary Figures 1–4; Supplementary References (8,22,31–39).
FUNDING
Centre National de la Recherche Scientifique; École normale supérieure; Egide; CNano IdF-CNRS; Fondation pour la Recherche Médicale; Deutscher Akademischer Austauschdients and Deutsche Forschungsgemeinschaft (WE2161/2-1). Funding for open access charge: Centre National de la Recherche Scientifique.
Conflict of interest statement. None declared.
Supplementary Material
ACKNOWLEDGEMENTS
The authors thank Valérie Marchi-Artzner for providing QDEO6, Thomas Le Saux for FCS measurements and Maxime Dahan for fruitful discussions.
REFERENCES
- 1.von Hippel PH, Berg OG. Facilitated target location in biological systems. J. Biol. Chem. 1989;264:675–678. [PubMed] [Google Scholar]
- 2.Granéli A, Yeykal CC, Robertson RB, Greene EC. Long-distance lateral diffusion of human Rad51 on double-stranded DNA. Proc. Natl Acad. Sci. USA. 2006;103:1221–1226. doi: 10.1073/pnas.0508366103. [DOI] [PMC free article] [PubMed] [Google Scholar]
- 3.Gowers DM, Wilson GG, Halford SE. Measurement of the contributions of 1D and 3D pathways to the translocation of a protein along DNA. Proc. Natl Acad. Sci. USA. 2005;102:15883–15888. doi: 10.1073/pnas.0505378102. [DOI] [PMC free article] [PubMed] [Google Scholar]
- 4.Berg OG, Winter RB, von Hippel PH. Diffusion-driven mechanisms of protein translocation on nucleic acids. 1. Models and theory. Biochemistry. 1981;20:6929–6948. doi: 10.1021/bi00527a028. [DOI] [PubMed] [Google Scholar]
- 5.Tafvizi A, Huang F, Fersht AR, Mirny LA, van Oijen AM. A single-molecule characterization of p53 search on DNA. Proc. Natl Acad. Sci. USA. 2011;108:563–568. doi: 10.1073/pnas.1016020107. [DOI] [PMC free article] [PubMed] [Google Scholar]
- 6.Gorman J, Greene EC. Visualizing one-dimensional diffusion of proteins along DNA. Nat. Struct. Mol. Biol. 2008;15:768–774. doi: 10.1038/nsmb.1441. [DOI] [PubMed] [Google Scholar]
- 7.Joo C, Balci H, Ishitsuka Y, Buranachai C, Ha T. Advances in single-molecule fluorescence methods for molecular biology. Annu. Rev. Biochem. 2008;77:51–76. doi: 10.1146/annurev.biochem.77.070606.101543. [DOI] [PubMed] [Google Scholar]
- 8.Bonnet I, Biebricher A, Porté P, Loverdo C, Bénichou O, Voituriez R, Escudé C, Wende W, Pingoud A, Desbiolles P. Sliding and jumping of single EcoRV restriction enzymes on non-cognate DNA. Nucleic Acids Res. 2008;36:4118–4127. doi: 10.1093/nar/gkn376. [DOI] [PMC free article] [PubMed] [Google Scholar]
- 9.Biebricher A, Wende W, Escudé C, Pingoud A, Desbiolles P. Tracking of single quantum dot labeled EcoRV sliding along DNA manipulated by double optical tweezers. Biophys. J. 2009;96:L50–2. doi: 10.1016/j.bpj.2009.01.035. [DOI] [PMC free article] [PubMed] [Google Scholar]
- 10.Jack WE, Terry BJ, Modrich P. Involvement of outside DNA sequences in the major kinetic path by which EcoRI endonuclease locates and leaves its recognition sequence. Proc. Natl Acad. Sci. USA. 1982;79:4010–4014. doi: 10.1073/pnas.79.13.4010. [DOI] [PMC free article] [PubMed] [Google Scholar]
- 11.Wilson GG, Murray NE. Restriction and modification systems. Annu. Rev. Genet. 1991;25:585–627. doi: 10.1146/annurev.ge.25.120191.003101. [DOI] [PubMed] [Google Scholar]
- 12.Arber W. Promotion and limitation of genetic exchange. Science. 1979;205:361–365. doi: 10.1126/science.377489. [DOI] [PubMed] [Google Scholar]
- 13.Arber W. In: The Bacteriophage Lambda. Hershey AD, editor. New York: Cold Spring Harbor Lab. Press; 1971. pp. 83–96. [Google Scholar]
- 14.Wood WB. Host specificity of DNA produced by Escherichia coli: bacterial mutations affecting the restriction and modification of DNA. J. Mol. Biol. 1966;16:118–133. doi: 10.1016/s0022-2836(66)80267-x. [DOI] [PubMed] [Google Scholar]
- 15.Pingoud A, Fuxreiter M, Pingoud V, Wende W. Type II restriction endonucleases: structure and mechanism. Cell. Mol. Life Sci. 2005;62:685–707. doi: 10.1007/s00018-004-4513-1. [DOI] [PubMed] [Google Scholar]
- 16.Seidel R, van Noort J, van der Scheer C, Bloom JGP, Dekker NH, Dutta CF, Blundell A, Robinson T, Firman K, Dekker C. Real-time observation of DNA translocation by the type I restriction modification enzyme EcoR124I. Nat. Struct. Mol. Biol. 2004;11:838–843. doi: 10.1038/nsmb816. [DOI] [PubMed] [Google Scholar]
- 17.Platt T. Transcription termination and the regulation of gene expression. Annu. Rev. Biochem. 1986;55:339–372. doi: 10.1146/annurev.bi.55.070186.002011. [DOI] [PubMed] [Google Scholar]
- 18.Travers A. RNA polymerase–promoter interactions: some general principles. Cell. 1974;3:97–104. doi: 10.1016/0092-8674(74)90112-3. [DOI] [PubMed] [Google Scholar]
- 19.Jeltsch A, Alves J, Wolfes H, Maass G, Pingoud A. Pausing of the restriction endonuclease EcoRI during linear diffusion on DNA. Biochemistry. 1994;33:10215–10219. doi: 10.1021/bi00200a001. [DOI] [PubMed] [Google Scholar]
- 20.Blainey PC, Luo G, Kou SC, Mangel WF, Verdine GL, Bagchi B, Xie XS. Nonspecifically bound proteins spin while diffusing along DNA. Nat. Struct. Mol. Biol. 2009;16:1224–1229. doi: 10.1038/nsmb.1716. [DOI] [PMC free article] [PubMed] [Google Scholar]
- 21.Glykos NM, Papanikolau Y, Vlassi M, Kotsifaki D, Cesareni D, Kokkinidis M. Loopless Rop: structure and dynamics of an engineered homotetrameric variant of the repressor of primer protein. Biochemistry. 2006;45:10905–10919. doi: 10.1021/bi060833n. [DOI] [PubMed] [Google Scholar]
- 22.Bonnet I, Desbiolles P. The diffusion constant of a labeled protein sliding along DNA. Eur. Phys. J. E Soft Matter. 2011;34:1–10. doi: 10.1140/epje/i2011-11025-8. [DOI] [PubMed] [Google Scholar]
- 23.Wenz C, Selent U, Wende W, Jeltsch A, Wolfes H, Pingoud A. Protein engineering of the restriction endonuclease EcoRV: replacement of an amino acid residue in the DNA binding site leads to an altered selectivity towards unmodified and modified substrates. Biochim. Biophys. Acta. 1994; 1219:73–80. doi: 10.1016/0167-4781(94)90248-8. [DOI] [PubMed] [Google Scholar]
- 24.Dif A, Boulmedais F, Pinot M, Roullier V, Baudy-Floc'h M, Coquelle FM, Clarke S, Neveu P, Vignaux F, Le Borgne R, et al. Small and stable peptidic PEGylated quantum dots to target polyhistidine-tagged proteins with controlled stoichiometry. J. Am. Chem. Soc. 2009;131:14738–14746. doi: 10.1021/ja902743u. [DOI] [PubMed] [Google Scholar]
- 25.Carson M, Johnson DH, McDonald H, Brouillette C, Delucas LJ. His-tag impact on structure. Acta Crystallogr. D Biol. Crystallogr. 2007;63:295–301. doi: 10.1107/S0907444906052024. [DOI] [PubMed] [Google Scholar]
- 26.Li X, Romero P, Rani M, Dunker A, Obradovic Z. Predicting Protein Disorder for N-, C-, and Internal Regions. Genome Inform. Ser. Workshop Genome Inform. 1999;10:30–40. [PubMed] [Google Scholar]
- 27.Oswald T, Wende W, Pingoud A, Rinas U. Comparison of N-terminal affinity fusion domains: effect on expression level and product heterogeneity of recombinant restriction endonuclease EcoRV. Appl. Microbiol. Biotechnol. 1994; 42:73–77. doi: 10.1007/BF00170227. [DOI] [PubMed] [Google Scholar]
- 28.Blainey PC, van Oijen AM, Banerjee A, Verdine GL, Xie XS. A base-excision DNA-repair protein finds intrahelical lesion bases by fast sliding in contact with DNA. Proc. Natl Acad. Sci. USA. 2006;103:5752–5757. doi: 10.1073/pnas.0509723103. [DOI] [PMC free article] [PubMed] [Google Scholar]
- 29.Bagchi B, Blainey PC, Xie XS. Diffusion constant of a nonspecifically bound protein undergoing curvilinear motion along DNA. J. Phys. Chem. B. 2008;112:6282–6284. doi: 10.1021/jp077568f. [DOI] [PubMed] [Google Scholar]
- 30.Kochaniak AB, Habuchi S, Loparo JJ, Chang DJ, Cimprich KA, Walter JC, van Oijen AM. Proliferating cell nuclear antigen uses two distinct modes to move along DNA. J. Biol. Chem. 2009;284:17700–17710. doi: 10.1074/jbc.M109.008706. [DOI] [PMC free article] [PubMed] [Google Scholar]
- 31.Doi M, Edwards SF. the Theory of Polymer Dynamics. USA: Oxford University Press; 1986. [Google Scholar]
- 32.Flory P. Statistical Mechanics of Chain Molecules. New York: Interscience Publishers; 1969. [Google Scholar]
- 33.Kienberger F, Pastushenko VP, Kada G, Gruber HJ, Riener C, Schindler H, Hinterdorfer P. Single Mol. Vol. 1. Berlin, Germany: Wiley-VCH Verlag; 2000. Static and dynamical properties of single poly(ethylene glycol) molecules investigated by force spectroscopy; pp. 123–128. [Google Scholar]
- 34.Nauli S, Kuhlman B, Le Trong I, Stenkamp RE, Teller D, Baker D. Crystal structures and increased stabilization of the protein G variants with switched folding pathways NuG1 and NuG2. Protein Sci. 2002;11:2924–2931. doi: 10.1110/ps.0216902. [DOI] [PMC free article] [PubMed] [Google Scholar]
- 35.Qian H, Elson EL. Quantitative study of polymer conformation and dynamics by single-particle tracking. Biophys. J. 1999;76:1598–1605. doi: 10.1016/S0006-3495(99)77319-4. [DOI] [PMC free article] [PubMed] [Google Scholar]
- 36.Charier S, Meglio A, Alcor D, Cogné-Laage E, Allemand J, Jullien L, Lemarchand A. Reactant concentrations from fluorescence correlation spectroscopy with tailored fluorescent probes. An example of local calibration-free pH measurement. J. Am. Chem. Soc. 2005;127:15491–15505. doi: 10.1021/ja053909w. [DOI] [PubMed] [Google Scholar]
- 37.Krichevsky O, Bonnet G. Fluorescence correlation spectroscopy: the technique and its applications. Reports Prog. Phys. 2002;65:251. [Google Scholar]
- 38.Schwille P, Haupts U, Maiti S, Webb WW. Molecular dynamics in living cells observed by fluorescence correlation spectroscopy with one- and two-photon excitation. Biophys. J. 1999;77:2251–2265. doi: 10.1016/S0006-3495(99)77065-7. [DOI] [PMC free article] [PubMed] [Google Scholar]
- 39.Culbertson CT, Jacobson SC, Michael Ramsey J. Diffusion coefficient measurements in microfluidic devices. Talanta. 2002;56:365–373. doi: 10.1016/s0039-9140(01)00602-6. [DOI] [PubMed] [Google Scholar]
Associated Data
This section collects any data citations, data availability statements, or supplementary materials included in this article.