

Abstract
A general filtering method, called the singular value filter (SVF), is presented as a framework for principal component analysis (PCA) based filter design in medical ultrasound imaging. The SVF approach operates by projecting the original data onto a new set of bases determined from PCA using singular value decomposition (SVD). The shape of the SVF weighting function, which relates the singular value spectrum of the input data to the filtering coefficients assigned to each basis function, is designed in accordance with a signal model and statistical assumptions regarding the underlying source signals. In this paper, we applied SVF for the specific application of clutter artifact rejection in diagnostic ultrasound imaging. SVF was compared to a conventional PCA-based filtering technique, which we refer to as the blind source separation (BSS) method, as well as a simple frequency-based finite impulse response (FIR) filter used as a baseline for comparison. The performance of each filter was quantified in simulated lesion images as well as experimental cardiac ultrasound data. SVF was demonstrated in both simulation and experimental results, over a wide range of imaging conditions, to outperform the BSS and FIR filtering methods in terms of contrast-to-noise ratio (CNR) and motion tracking performance. In experimental mouse heart data, SVF provided excellent artifact suppression with an average CNR improvement of 1.8 dB (P < 0.05) with over 40% reduction (P < 0.05) in displacement tracking error. It was further demonstrated from simulation and experimental results that SVF provided superior clutter rejection, as reflected in larger CNR values, when filtering was achieved using complex pulse-echo received data and non-binary filter coefficients.
Index Terms: Artifact reduction, cardiac imaging, principal component analysis (PCA), signal separation, singular value decomposition
I. Introduction
The suppression of undesirable source signals from the superposition of a plurality of source signals is a central challenge in essentially all medical imaging modalities including ultrasound, computed tomography (CT), magnetic resonance imaging (MRI), and positron emission tomography (PET). Typical examples of undesirable sources include electronic noise, reverberation artifact (i.e., multi-path reflections), sources of phase aberration, and signal from tissue structures in applications such as perfusion imaging, blood flow estimation, or targeted molecular imaging.
In the application of medical ultrasound, the prevalence of image artifact often provides motivation for the use of other more expensive modalities, such as CT or MRI despite the significant advantages of medical ultrasound that include superior temporal and spatial resolution with none of the risk arising from ionizing radiation. A particularly common and significant source of artifact in medical ultrasound, often referred to as “clutter,” is typically caused by multi-path reverberation or off-axis scattering and appear as quasi-static regions of echo signal that obscure underlying dynamic tissue regions of interest [1], [2]. Clutter artifacts can degrade image performance by reducing contrast or biasing functional image measurements such as myocardium strain in cardiac imaging or displacement estimation in blood flow imaging or elastography.
Clutter from multi-path reverberation occurs when the returning acoustic wave is reflected repeatedly between a reflective tissue structure and the ultrasound transducer face. In echocardiography, the sternum and rib cage are the predominant sources of multi-path reverberation artifacts due to their high reflectivity and proximity to the heart [3]. As a result of these artifacts, portions of the underlying myocardium are obscured by static artifactual reverberation signal, which can preclude accurate diagnosis of cardiac function through visual inspection of the imaging data or motion tracking techniques [4]–[6]. The presence of artifact signal is also detrimental to diagnoses that occur when the physician views the cardiac images absent of displacement and strain data as the actual cardiac tissue of interest is obscured. In order to overcome the presence of reverberation artifacts in echocardiography, tracking results are often compromised in corrupted regions of the heart. For example, previous methods used to mitigate image degradation from reverberation artifacts include interpolation from adjacent artifact-free regions of the heart [7], or probabilistic modeling to infer heart motion in corrupted regions [8]. However, in the case of diseased hearts, abnormal myocardial motion cannot be interpolated using statistical assumptions and models, and it is therefore highly desirable to suppress image artifacts using filtering strategies so that accurate motion tracking measurements can be computed from the entire myocardium.
In medical ultrasound, filtering strategies for suppression of clutter, including reverberation artifacts, have traditionally involved the linear decomposition of received echo signals. The goal of this approach is to re-express the original data along a new coordinate system such that the clutter and signal of interest are separated along different bases. Filtering is then achieved by rejecting the bases describing clutter and retaining the bases describing the signal of interest. These methods can be classified based on the means by which the new bases are determined: a priori or adaptive. Perhaps the most common example of the a priori approach is the discrete Fourier transform (DFT) whereby the bases are defined independent of the data as complex exponentials. DFT-based filtering (i.e., FIR or IIR filters) have been widely used for clutter rejection—especially in application to wall filtering in blood flow imaging [9], [10].
While widely used, DFT-based methods under perform when the frequency characteristics of the clutter and signal of interest overlap. Moreover, the clutter artifact and tissue signal characteristics often change dramatically through space and time due to changes in physiology and varied tissue structures. Thus, an adaptive framework for determining basis functions has been proposed with principal component analysis (PCA), also called the discrete Karhunen–Loeve Transform (KLT), being the most prevalent technique [2], [11]–[24]. In this method, the basis functions are determined adaptively from the covariance properties of the data. In addition to applications for clutter rejection in blood flow estimation [11]–[17], PCA-based techniques have been proposed for many additional applications in medical ultrasound including displacement estimation [18]–[20], displacement profile filtering [14], beamforming [21], tissue characterization [22], [23], and classification of tissue response to acoustic radiation force [24].
In this paper, a general framework for a new PCA-based filtering strategy is derived and applied to simulated and experimental ultrasound data in the context of suppressing clutter artifact. The filtering technique, referred to as the singular value filter (SVF), differs from previous PCA-based approaches by incorporating a weighting function that computes non-binary filter coefficients adaptively from information contained in the singular value spectrum. The performance of SVF, using our proposed weighting function for applications to clutter rejection, is then quantified in simulation across a wide range of imaging parameters, tissue motion characteristics, and clutter motion characteristics. Lastly, SVF is experimentally validated in mouse heart imaging, which is an environment where clutter artifact represents a dominant source of image performance degradation. In both simulation and experimental data, performance of SVF is compared against a simple high-pass FIR filtering technique and a recently suggested PCA-based strategy for clutter rejection [2].
II. Linear Signal Decomposition
The linear decomposition of an observed signal, such as an ensemble of ultrasound echo data, is based on the principle that the signal of interest can be decomposed into a weighted sum of mutually orthogonal basis functions. This process is often referred to as a basis transformation or a basis rotation. In many applications, the goal of signal decomposition is to identify underlying source signals for the purpose of analysis or filtering. The objective is then to estimate a new basis that accurately represents the underlying sources. A filtered output signal can then be formed by retaining the projection of the original signal along a weighted subset of the new basis functions.
The basic principles of linear signal decomposition can be most easily described by first considering an observed signal, represented discretely as row vector x (dim 1 × N), which can be decomposed into a weighted sum of orthonormal basis functions
| (1) |
where γk are weighting coefficients for each of N orthonormal basis functions υk. Coefficients can be expressed as the dot product between the observed signal and each orthonormal basis vector
| (2) |
where is the conjugate transpose of υk. The basis functions υk can be any set of vectors provided that they are mutually orthonormal
| (3) |
The mutually orthonormal basis functions υk used for linear transformation of the data can be determined either a priori or adaptively from the signal itself. The DFT is an example of linear signal decomposition where basis functions are defined a priori such that υk are a set of complex exponentials of different frequencies. This method is efficacious in separating signal components when the underlying sources exhibit distinct frequency characteristics. However, in many applications, including ultrasound clutter filtering, the underlying source signals (e.g., clutter and desirable tissue signal) often overlap significantly in the frequency domain making source separation using the DFT unreliable. Thus, in many instances it is desirable to form the set of basis functions υk adaptively as arbitrary polynomials.
A common method for signal decomposition with adaptive basis selection is PCA. A comparison between basis functions found using the DFT and the PCA methods are illustrated in Table I. Using the PCA method, basis functions are computed as arbitrary polynomials and determined adaptively from the covariance statistics of the original data. Therefore, estimating basis function in PCA requires multiple observations.
TABLE I.
Comparison of DFT- and PCA-Derived Basis Functions
| Discrete Fourier Transform | Principal Component Analysis | |
|---|---|---|
| Basis Functions (a priori/adaptive) | a priori | Adaptive |
| Basis Functions (Real/Complex) | Complex | Real: if input real Complex: if input complex |
| Basis Functions (Type) | Complex Exponentials | Arbitrary Polynomials |
To illustrate the PCA method, consider a matrix X (dim M × N) with M observations, xj (dim 1 × N), arranged as row vectors
| (4) |
The PCA method for computing basis functions υk is based on the desire to find a new coordinate system that accounts for maximum variance in the data, or equivalently, the minimum mean squared error of approximation [25]–[27].
Following the variance framework, a simpler and widely used approach to computing υk involves performing an eigenvalue decomposition (EVD) on the autocorrelation matrix, R, of X
| (5) |
where the matrix Λ is a diagonal matrix with the kth entry being the kth eigenvalue λk. Eigenvalues are positive and real, and they are typically arranged in order of descending value such that λ1 > λ2 > ··· > λN. For each eigenvalue, there is an associated eigenvector, which is contained in the columns of V. These eigenvectors correspond to the PCA basis functions υk.
The kth associated eigenvalue is proportional to the amount of variance accounted for by the kth eigenvector
| (6) |
Therefore, the first eigenvector υ1 explains the most variance in the data and is also associated with the eigenvalue that possesses the greatest value, λ1.
An alternative method to EVD is to perform a singular value decomposition (SVD) on X, which finds the PCA basis functions in V and avoids computation of the autocorrelation matrix R. The SVD of X is
| (7) |
where columns of U are the left singular vectors corresponding to the eigenvectors of and Σ is a diagonal matrix of singular values σk with singular values arranged in order of descending value σ1 > σ2 > ··· > σN. The matrix V is the same as in (5), with columns representing the right singular vectors, or the eigenvectors of X′ X = R.
III. Overview of PCA-Based Filtering in Medical Ultrasound
Following decomposition of the signal x along a new set of basis functions υk, filtering can be achieved by assigning weightings wk to each basis function
| (8) |
where y is the filtered output signal with the same dimensions as x.
In many standard filtering approaches, the filter weightings are chosen a priori based on an assumption of the source signal of interest. In frequency-domain filtering using the DFT, when basis functions υk are composed of complex exponentials, weightings are assigned based on the assumed frequency composition of the source signals. In the application of clutter filtering, signal originating from the desired sources (e.g., blood or myocardium) are assumed to have higher frequency than the more static clutter signal, and therefore a high pass filter is typically used [9], [10].
Similarly, in PCA-based filtering approaches, the weightings can be defined a priori based on the assumed relative amount of variance accounted for by the desired source signal. This procedure entails rejecting a set number of basis functions with the largest eigenvalues based on the assumption that clutter is more energetic than the underlying tissue [15], [16]. While this a priori strategy for defining weighting coefficients parallels standard DFT filtering design, it is generally inadequate in PCA-based methods since PCA basis functions are not known a priori as in the DFT. As a result of adaptively determining the basis functions, the same weighting coefficients at different spatial locations in the image have the potential to filter different source signals. For example, in regions of the ultrasound image where no clutter is present, rejection of the first PCA basis functions will have the unwanted affect of attenuating the desirable source signal of interest (e.g., tissue or blood).
Due to these limitations, different strategies have been proposed for adaptively determining the weighting coefficients. These can be categorized into frequency-based, singular value-based, and manual observation-based methods. Manual observation strategies generally have involved computing one set of basis functions for the entire ultrasound image, inspecting these basis functions, and then setting wk based on the user’s interpretation of these basis functions [2], [14]. While adaptive, this strategy is limited in its inability to be applied in real-time. Moreover, determining a new set of PCA basis functions for every spatial location of the image, instead of a single set of basis functions for the entire image, is advantageous as observations X in better approximate stationarity and basis functions can better adapt to local spatial variations in the ultrasound image.
In the frequency-based approach proposed by Yu and Lovstakken [12], weighting coefficients are determined adaptively from the frequency content of the individual PCA basis functions. The mean frequencies of each basis function are computed using the lag-one autocorrelation estimation, and basis functions are rejected when their mean frequencies are within the assumed bandwidth of clutter. Yu and Lovstakken [12] have also examined adaptive weightings based on the spectrum of eigenvalues (square of singular values). Techniques investigated include thresholding based on a predefined eigenvalue level or thresholding the eigenvalue differences or ratios. However, it was concluded from these studies that the eigenvalue-based algorithms did not provide consistent results.
In this paper, we demonstrate that it is possible to achieve consistent filtering results when weighting coefficients are determined adaptively from the singular values, but superior performance is achieved only when filter coefficients are non-binary and determined as a function of the singular value spectrum of complex echo data. In all current literature on PCA-based filtering in medical ultrasound of which the authors are aware, weightings are restricted to binary numbers such that each basis function is either completely rejected (wk = 0) or completely retained (wk = 1). In contrast, we present a general SVF framework for PCA-based filtering that incorporates a weighting function constructed from statistical assumptions and a signal model, which computes non-binary wk from the singular value spectrum. Non-binary filter coefficients are demonstrated to achieve consistent and superior filtering results as they effectively eliminate the undesirable signal component of interest (i.e., clutter) while avoiding block artifacts that arise from strict thresholding. This technique is shown to achieve superior image quality in terms of image contrast-to-noise ratio (CNR) over strict thresholding of basis functions (i.e., binary wk’s).
IV. Singular Value Filter
The singular value filter operates by decomposing the signal X along the PCA basis functions υk as computed from its SVD. Filtering is then applied by assigning weights to the basis functions to achieve the filtered output y as expressed in (8). A block diagram of the singular value filter is illustrated in Fig. 1.
Fig. 1.

Block diagram of the singular value filter.
The singular value filter is a PCA-based regression filter where X, and therefore υk are complex, and filter coefficients wk are adaptively determined as a function of the singular value spectrum of X
| (9) |
While SVF is referred to as a general filtering approach, which can be applied to a variety of applications, the remaining discussion takes place in the context of clutter artifact rejection in medical ultrasound. In this application, a new matrix X is formed for every ultrasound echo sample where the N/2 entry of row vector xM/2 is the sample of interest. The row vector xM/2 is an ensemble of echo data surrounding the sample of interest and collected through “slow-time” or frame number. The term “slow-time” indicates sampling across successive frame captures for the same pixel location in the image whereas “fast-time” indicates the sampling rate for a single A-line. Fast and slow-time dimensions are indicated in Fig. 2(b). As a result of the orientation of xM/2, the resulting basis functions υk represent principal directions through the slow-time dimension, which contains information about the motion characteristics of the underlying acoustic targets. The additional row entries in matrix X, vectors x1, …, xM/2−1, xM/2+1, …, xM, are formed by taking the M/2 − 1 ensembles adjacent to xM/2 in the axial dimension. By forming X from ensembles in close proximity to one another, an assumption of statistical stationarity is more accurate. The size of M, which is referred to as the PCA kernel length, is typically chosen on the order of several periods of the center frequency. As demonstrated in later sections, a trade-off exists in choosing M to be large as to achieve estimates of υk with low variability but small in order to avoid bias in υk that may result from not meeting the stationarity assumption.
Fig. 2.

(a) An illustration of frames of echo data acquired during ultrasound imaging. Matrix X is formed over small windowed regions of frames of echo data as indicated by the 3D bold outlined pixels. The orientation of matrix X is arranged such that rows, and therefore the principal component basis functions, correspond to trends through slow time. In (b) three examples of echo data corresponding to hypothetical regions of static tissue (top), tissue motion and decorrelation (middle), and random noise (bottom) are illustrated. The corresponding singular value spectra from each of the three examples of X are illustrated in (c). As illustrated, the singular value spectra flatten with increasing motion complexity, and thus statistical dimensionality, in X.
Frames of echo data are filtered using SVF by compiling the resulting filter outputs achieved when each echo sample in the set of image frames is used as the sample of interest. In this way, every echo sample in the data set is assigned a new set of PCA basis functions, singular values, weighting coefficients, and filtered output resulting from (8), which are all adaptive to the local statistical characteristics of the data. The manner by which X is formed from frames of echo data is illustrated in Fig. 2.
Fig. 2 also demonstrates the manner by which the singular value spectra contain information relevant to the statistical characteristics of the signal X. From singular spectrum analysis (SSA), the dimensionality of the data is a function of number of singular values above the singular spectrum noise floor [28], or alternatively the “flatness” of the singular value spectrum. In the top image of Fig. 2(b), signal matrix X represents simulated echo data that contains low dimensionality, which is revealed in the corresponding singular spectrum [top plot of Fig. 2(c)] with a high ratio of the first singular value normalized by the matrix trace of Σ, which is equivalent to the sum of all the singular values. This value is denoted by Σ̃11. In our applications, low dimensionality is often observed in instances of static tissue or clutter artifacts that originate from static tissue, such as rib bones or vessel wall. The Σ̃11value decreases, and the overall flatness of the spectrum increases, with increased dimensionality of X. High dimensionality in an ensemble of echo data in medical ultrasound can occur when echoes are observed from regions of tissue with complex motion and decorrelation [middle plots of Fig. 2(b) and (c)]. The highest dimensionality possible, which achieves a completely flat singular spectrum, is random noise [bottom plots of Fig. 2(b) and (c)].
The singular value spectra illustrated in Fig. 2(c)s are all derived from simulated complex echo data. The significance of complex echo data to inform weighting coefficients in SVF is illustrated in Fig. 3. When X is composed of real echo data, periodic trends (such as those that result from displacement of underlying acoustic targets) are revealed as “pairings” between two consecutive singular values. Pairing is detected when consecutive singular values (e.g., σ1 and σ2) possess similar values and the associated basis functions (e.g., υ1 and υ2) describe highly overlapping frequency content [22], [23]. Since Σ̃11 from complex data is monotonic with decorrelation and axial displacement, this parameter is much better suited for characterization of the motion characteristics of X. In contrast to other common PCA-based filtering approaches for adaptively computing filter coefficients, such as thresholding singular values or thresholding singular values normalized by the maximum, the Σ̃kk values are a reflection of the statistical dimensionality of the data. Thus, using Σ̃kk as the values to dictate filtering coefficients through a weighting function is essential to the efficacy of SVF as it allows for a means to detect regions of clutter artifact (which generally exhibit low dimensionality) with high specificity. Significantly, this results in good artifact rejection as attenuation of signal components is specific to the artifact components only and desirable tissue signal is consistently retained.
Fig. 3.

The first singular value normalized by the sum of singular values, Σ̃11, computed from ensembles of simulated echo data when echo data was (a) complex and (b) real. Simulation parameters are listed in Table II.
Filter design in SVF involves construction of a weighting function that relates the singular value spectrum to the weighting coefficients. This weighting function is dictated by the signal model and assumptions concerning the imaging environment as indicated in the block diagram in Fig. 1. For the application of ultrasound clutter rejection, the signal model for the observed ensemble of echo data x is
| (10) |
where s, c and n are source signals of the same dimensions as x, and represent echoes from desirable tissue, clutter artifact, and white noise, respectively. The first assumption used to construct the weighting function for clutter rejection is that clutter artifact is the dominant signal component. Significantly, this assumption means that attenuation of the first basis functions, describing the largest amount of variability in X, is desired in regions of artifact. Stated differently, attenuation of basis functions with the largest singular values is only desired when the ratio of clutter energy to desirable tissue energy is greater than 0 dB. The second assumption is that echoes from clutter artifact are more static, meaning that X possess lower dimensionality, than echoes from desirable signal of interest. This assumption indicates that when X is located in regions of clutter, then Σ̃11 will be higher than when X is located in regions of desirable tissue signal. Together, the signal model and assumptions indicate that the weighting function used in SVF for clutter suppression should retain all basis functions when X is dominated by desirable tissue and attenuate basis functions associated with the largest singular values when X is dominated by clutter. Using the principle illustrated in Fig. 3, Σ̃11 is used as a measure of motion complexity, and thus a measure of the likelihood that X is taken from a region of clutter versus tissue. Although many different weighting functions can be constructed in accordance with our signal model and assumptions, we used a modified sigmoidal function to determine the weighting coefficients
| (11) |
where τ and α are weighting function parameters that adjust the Σ̃kk cutoff threshold and weighting function roll-off, respectively. Fig. 4 illustrates wk (Σ) for several different values of α. As displayed in Fig. 4, as α → 0, wk (Σ) flattens, indicating that all basis functions are retained at the same level and no filtering is achieved. At the other limit as α → ∞, filtering is achieved through strict thresholding where wk (Σ) are binary. In this instance, basis functions are rejected if their associated singular values have a Σ̃kk value above threshold τ and retained if Σ̃kk is below the threshold. As we demonstrate in simulation and experimental results, the value of α in terms of achieving maximum image CNR is in between the two extremes.
Fig. 4.
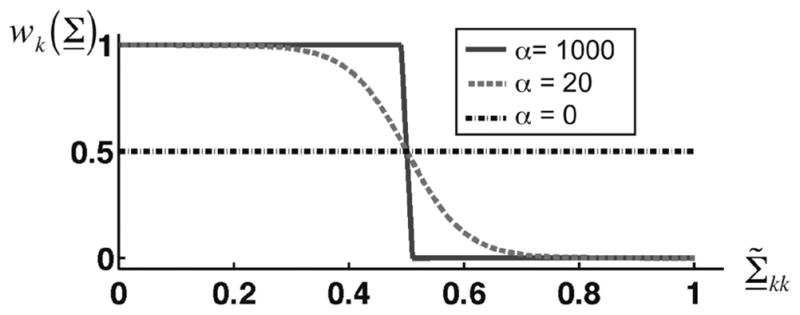
The SVF weighting function from (11) for different weighting function roll-off (α) values. Values for τ are 0.5 for the three instances.
V. Methods
A. The Effects of SVF Weighting Function Parameters, Echo Correlation, Axial Shift, Clutter-to-Tissue Ratio, Electronic SNR, Ensemble Length, and SVF Kernel Length on Clutter Artifact Suppression
A simulation framework was constructed in FIELD II [29] using MATLAB (MathWorks Inc., Natick, MA) to quantify the performance of SVF for rejecting clutter artifact and improving image CNR. Using the calc_scat function in FIELD II, ultrasound ensembles were simulated from a hypoechoic lesion with diameter of approximately 0.5 cm and a ratio of lesion-to-background mean scatterer amplitudes of −20 dB. Echo data was collected across a 20 mm × 10 mm spatial extent to enable reconstruction of ultrasound images for CNR calculations.
A separate set of echoes, simulated across the same spatial extent as the hypoechoic lesion echoes, were simulated from a 0.3 mm × 3.5 mm region of clutter artifact scatterers. These scatterers were located at the center of the hypoechoic lesion and possessed reflection amplitudes approximately 20 dB above the lesion. Hypoechoic lesion scatterers and clutter artifact scatterers were assigned different degrees of axial motion and decorrelation through the slow-time dimension. The final set of echo data over which SVF operated, was achieved by summing the echoes from the hypoechoic lesion and from the simulated clutter artifact. Axial shifts were achieved by first oversampling echoes at 400 MHz and then downsampling at 40 MHz starting with the sample that achieves the desired subsample shift. Echo decorrelation was achieved using the Cholesky factorization method, which simulates echo decorrelation from out-of-beam motion [18]. The default simulation parameters are listed in Table II.
TABLE II.
Default Simulation Parameters
| Simulation Parameters | Default Values |
|---|---|
| Center Frequency | 5 MHz |
| Sampling Frequency | 40 MHz |
| Fractional Bandwidth | 50% |
| Tissue Echo Correlation | 0.98 |
| Artifact Echo Correlation | 1.0 |
| Tissue Displacement | 1 Period per A-line |
| Artifact Displacement | 1/8 Period per A-line |
| Ensemble Length | 9 A-lines |
| SVF Kernel Length | 3 Periods |
| SVF Roll-off (α) Parameter | 30 |
The SVF technique was compared to two additional methods, which have been proposed for clutter rejection, and compared quantitatively in terms of CNR, by Lediju et al. [2]. The first is an FIR clutter rejection filter with coefficients [−11]. This technique represents the most basic form of high-pass filtering and amounts to frame subtraction. The second approach is a conventional PCA-based clutter filtering method, which is referred to in Lediju et al. [2] as the blind source separation (BSS) method. In contrast to SVF, the BSS method operates on real echo data, uses a single set of PCA basis functions per image frame, and performs the filtering calculation using binary filter coefficients. PCA basis functions retained for filtering in the BSS approach were chosen such that the highest CNR measurement was produced in simulation. This strategy typically resulted in the rejection of the first PCA basis function. CNR for each of the three techniques was computed using the following expression:
| (12) |
where μi and μo are the mean envelop-detected quantities in regions inside and outside the hypoechoic lesion respectively and σ0 is standard deviation outside the lesion. An example hypoechoic lesion image is illustrated in Fig. 5, with the white box indicating the region of interest inside the lesion and black boxes indicating regions of interest outside the lesion.
Fig. 5.
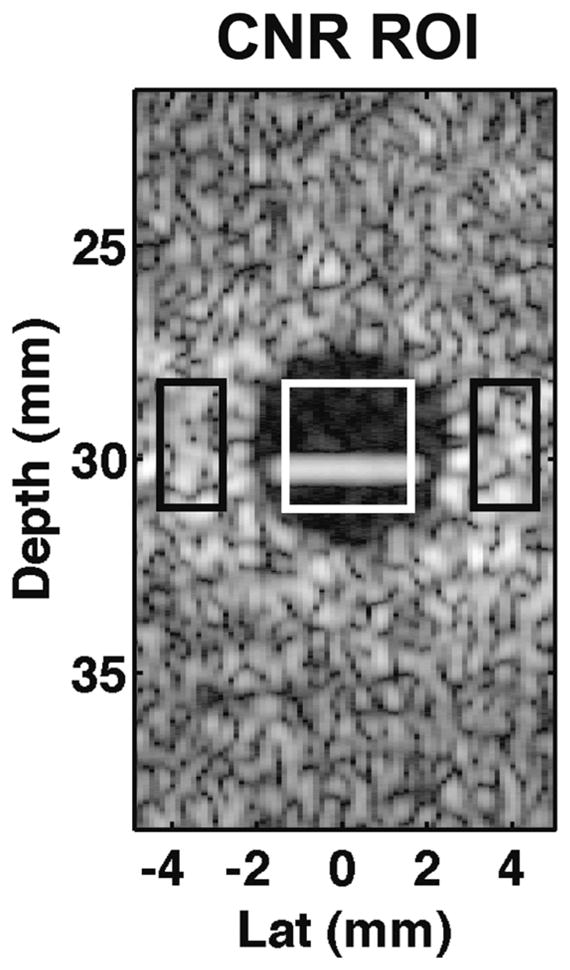
ROI used in hypoechoic lesion simulations to estimate CNR. The white box indicates the ROI inside the lesion and black boxes indicate ROI outside the lesion. The mean and standard deviation of pixel values inside and outside the lesion were used to compute CNR as expressed in (12).
B. Effect of SVF on Mouse Heart Image CNR and Speckle Tracking Performance
SVF was validated experimentally using in vivo mouse heart data. Frames of echo data from the left ventricle short-axis of the mouse heart were acquired using a Vevo 2100 (VisualSonics, Toronto, Canada) scanner operating at 30 MHz. In these experiments, clutter artifact was present due to multi-path reverberations from physiological structures superficial to the mouse heart, such as the mouse sternum. Data were processed for clutter rejection and displacement estimation over one full mouse heart cycle starting from end-diastole, which corresponded to approximately 30–40 image frames. The data was acquired in in-phase and quadrature (IQ) format directly from the Vevo 2100 and processed offline with custom MATLAB software. A total of eight data sets were acquired for these experiments from four different mice. Data sets from the same mouse were taken from different locations of the mouse heart such that speckle and artifact realizations were approximately independent.
Speckle tracking was performed on the envelop-detected echo data before and after clutter artifact filtering using a 2D normalized cross correlation with parabolic-based sub-pixel fitting method. Tracking kernel windows were approximately 0.6 mm × 0.6 mm with 70% overlap. A correlation filter was used as in Patil et al. [30] where displacement estimates with correlation coefficients less than 0.5 were replaced by the median displacement from the surrounding 5 × 5 pixel region. All displacements were then filtered using a 5 × 5 pixel spatial median filter. Tracking performance was quantified in terms of mean displacement and displacement SNR in approximately 1/8 sections of myocardium classified as “artifact region” or “normal region” indicating regions of myocardium where artifact was present or absent. Displacement SNR was quantified as the ratio of mean displacement to standard deviation of displacements. Both CNR and displacement metrics were quantified at end-systole. The regions of interest (ROI) for CNR calculations and displacement quantification are illustrated in Fig. 6(a) and (b), respectively.
Fig. 6.
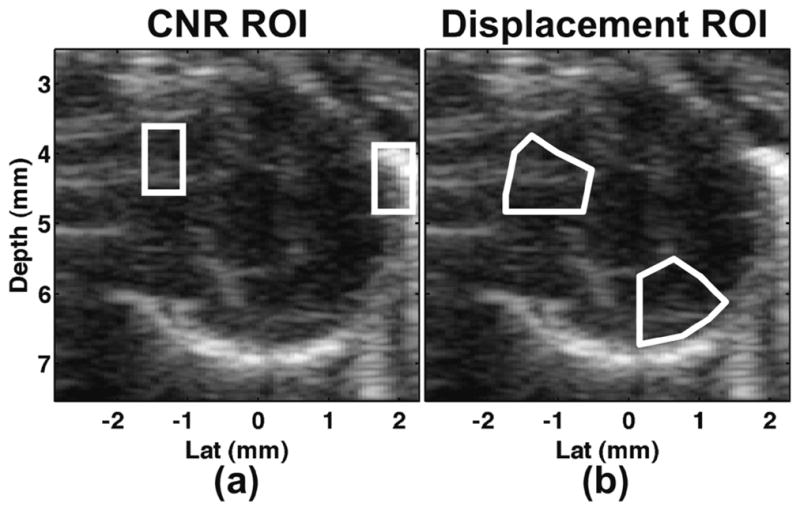
Example ROI from left ventricle short-axis mouse heart images for (a) CNR and (b) displacement performance quantification. In both cases, the left-most ROI corresponds to a region of artifact while the right-most ROI corresponds to a region of normal tissue.
C. The Effect of SVF on Mouse Heart Speckle Tracking Error
In Section V-B, we described methods to quantify tracking performance from cardiac imaging data when artifacts originated from sternum-derived multi-path reverberations. However, these methods do not allow for quantification of motion estimation bias, or “tracking error,” due to a lack of a known true value. Thus, additional experiments were designed with the goal of providing an internal “gold standard” measurement by which motion estimation tracking error could be found.
In these experiments, a lead solder wire was placed externally to the mouse between the skin and transducer surface. This process created multi-path clutter artifacts in the resulting ultrasound images that were subjectively similar to the artifacts that occur in a diagnostic imaging environment. IQ data over a full heart cycle was acquired with the wire, and this data was considered the “artifact-induced” data set. Next, the wire was removed from underneath the transducer without moving the transducer with respect to the mouse heart. A full heart cycle was then acquired without the wire present and thus without artifacts obscuring the myocardium. This data set was considered the “artifact-removed” data set. The tracked displacements when the artifact was removed were considered the “true displacements” by which we compared the displacements computed from the artifact-induced data sets in order to further quantify clutter rejection performance. The tracked displacements from regions of artifact in the artifact-induced data set were identified from approximately 1/8 regions of the myocardium as in Section V-B. The same section was identified in the artifact-removed data set and displacement vectors at end-systole were used to compute a mean displacement error
| (13) |
where N is the number of displacement vectors in the ROI, d̂j are the displacement vectors derived from tracking of the unfiltered echo data in the artifact-induced data set or the filtered data (from SVF, BSS, or FIR) in either the artifact-induced or artifact-removed data sets, and dj are the displacement vectors derived from tracking of the unfiltered echo data in the artifact-removed data set.
VI. Results
A. The Effects of SVF Weighting Function Parameters, Echo Correlation, Axial Shift, Clutter-to-Tissue Ratio, Electronic SNR, Ensemble Length, and SVF Kernel Length on Clutter Artifact Suppression
Fig. 7 illustrates the mean CNR computed when SVF operated on complex and real echo data for different values of the weighting function roll-off (α) parameter. Simulated images after SVF for α at 0, 20, and 1000 are illustrated in Fig. 8(a)–(c). As described in (11), at α = 0, no filtering occurs. At the other limit, when α tends toward infinity, strict thresholding (e.g., binary filter coefficients) is achieved.
Fig. 7.
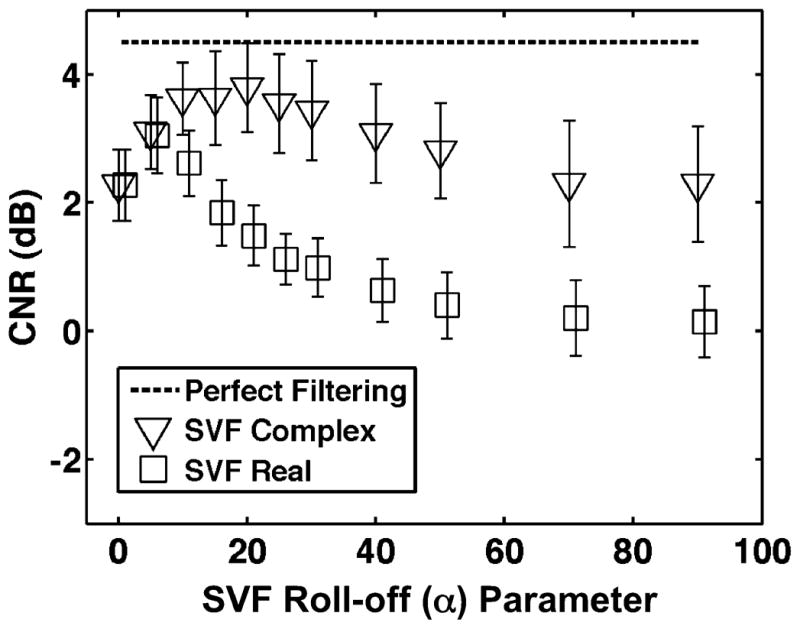
CNR when SVF operated on complex or real echo data for varied values of the SVF weighting function roll-off (α) parameter. Open symbols represent mean and error bars represent standard deviation over 100 trials. Default simulation parameters are listed in Table II.
Fig. 8.

Example simulation images following SVF filtering of complex echo data when the weighting function roll-off (α) parameter was set at (a) 0, (b) 20, and (c) 1000.
Performance of SVF operating on real and complex echo data along with FIR and BSS clutter rejection strategies are quantified in terms of CNR in Fig. 9(a) for varied levels of background echo correlation and Fig. 9(b) for varied levels of background axial motion. The clutter echo correlation and axial shift were held constant at the default simulation values described in Table II. For reference, mean CNR in the absence of clutter artifact is indicated in the dashed line and labeled as “perfect filtering.” The solid line indicates the other extreme where no filtering is conducted. Symbols represent mean CNR while error bars represent standard deviation over 100 trials. Further quanitification of clutter suppression performance is displayed in Fig. 10 over varied levels of (a) electronic SNR, (b) clutter-to-noise ratio, (c) ensemble length, and (d) kernel length.
Fig. 9.

Mean CNR for SVF, BSS, and FIR techniques for varied (a) echo correlation and (b) axial shift of the background (i.e., non-clutter artifact) scatterers. Symbols represent mean CNR and error bars represent standard deviation over 100 trials. The dashed line, labeled “Perfect Filtering,” represents the mean CNR with no filtering when clutter artifact is not present in the simulated data. Data points not shown in (b) possessed mean CNR values below −3 dB. Likewise, the solid line, labeled “unfiltered,” represents the CNR value with no filtering when clutter artifact is present in the simulated data. Default simulation parameters are listed in Table II.
Fig. 10.

Mean CNR for SVF, BSS, and FIR techniques for varied (a) electronic SNR, (b) clutter-to-tissue ratio, (c) ensemble length, and (d) kernel length. Symbols represent mean CNR and error bars represent standard deviation over 100 trials. The dashed line, labeled “perfect filtering,” represents the mean CNR with no filtering when clutter artifact is not present in the simulated data. Likewise, the solid line, labeled “unfiltered,” represents the CNR value with no filtering when clutter artifact is present in the simulated data. Default simulation parameters are listed in Table II.
B. The Effect of SVF on Mouse Heart Image CNR and Speckle Tracking Performance
Mean CNR over 8 short-axis mouse heart data sets as a function of ensemble length, weighting function roll-off parameter (α), and weighting function threshold parameter (τ) are illustrated in Fig. 11. The combination of these parameters yielding the highest mean CNR was found at ensemble length of 15 A-lines, roll-off parameter (α) at 25, and threshold parameter (τ) at 0.3. All further SVF processing of mouse heart data was performed using these values. In Fig. 12, three example images are illustrated before filtering is performed (left column) and after filtering with SVF (right column). Red circles in the unfiltered images indicate regions of clutter artifact. Fig. 13 illustrates the mean CNR improvement of the SVF, BSS, and FIR filtering methods in comparison to the unfiltered data. Error bars represent standard deviation. The symbol above the SVF error bar represents statistical significance P < 0.05 from a one-sample two-tailed t-test.
Fig. 11.

Mean CNR over 8 short-axis mouse heart data sets as a function of SVF parameters (a) weighting function threshold (τ) and weighting function roll-off (α) and (b) ensemble length (A-lines) and weighting function roll-off (α).
Fig. 12.

Three example short-axis mouse heart images are illustrated before (left column) and after (right column) application of SVF. Regions of artifact, which are derived from multi-path reverberation, are indicated in the unfiltered images by a red circle. Images are shown on a log compressed linear gray scale mapping from 0 to 50 dB.
Fig. 13.

Mean CNR gain for the SVF, BSS, and FIR clutter filtering techniques over the unfiltered data. Error bars represent standard deviation over eight data sets. Statistical significance (*P < 0.05) was determined using a one-sample two-tailed t-test against the hypothesis of a zero mean.
In Fig. 14, an example short-axis mouse heart image at end-systole with arrows indicating tracked displacements are illustrated before and after SVF. The green arrows in the top images indicate displacements accumulated from end-diastole to end-systole using a conventional 2D normalized cross-correlation with parabolic fitting strategy. The same displacement information is illustrated on bottom for displacement magnitude around the short-axis myocardium.
Fig. 14.

B-mode images (top) for when echo data is (a) unfiltered and (b) filtered using SVF. Images are overlaid with green arrows indicated tracked displacement from end-diastole to end-systole. Displacement magnitude maps (bottom) resulting from tracked displacement when echo data is (a) unfiltered and (b) filtered using SVF. A supplemental video clip of the corresponding ultrasound B-mode data and displacement vectors is included with this paper. The video displays imaging over a full heart cycle before and after filtering with SVF and is available for download at http://ieeexplore.ieee.org.
A supplementary video clip corresponding to ultrasound B-mode images and displacement vectors in Fig. 14 is included with this paper and is available for download at http://ieeexplore.ieee.org. The video displays imaging over a full heart cycle before and after filtering with SVF.
Displacement tracking performance was quantified over eight data sets in terms of percent increase in displacement estimates and displacement SNR improvement for both artifact and normal regions of the myocardium. Fig. 15 illustrates a summary of results with displacement estimate gain for artifact region [Fig. 15(a)] and normal region [Fig. 15(b)] of the myocardium as well as displacement SNR gain for artifact [Fig. 15(c)] and normal region [Fig. 15(d)]. P values <0.05 using a one-sample two-tailed t-test were considered significant.
Fig. 15.

Displacement tracking performance quantified in terms of (a)–(b) percent increase in displacement estimates and (c–d) displacement signal-to-noise ratio. Performance was quantified for both artifact regions (a), (c) and normal regions (b), (d) of the myocardium. ROI for both artifact and normal regions represented approximately 1/8 sections of the short-axis of the myocardium as illustrated in Fig. 6(b). Statistical significance (*P < 0.05) was determined using a one-sample two-tailed t-test against the hypothesis of a zero mean.
C. The Effect of SVF on Mouse Heart Speckle Tracking Error
Artifacts were induced using a wire over nine mouse heart data sets to quantify tracking error as expressed in (13). Fig. 16 illustrates a summary of results. Tracking error was quantified for unfiltered, SVF, BSS, and FIR when artifact was induced [Fig. 16(a)] and SVF, BSS, FIR after artifact was removed [Fig. 16(b)]. Displacement estimates from unfiltered echo data when the artifact was removed were considered the “true” displacements. Thus, error was considered to be zero and results for this instance are not illustrated in Fig. 16(b). P values <0.05 using a two-sample two-tailed t-test were considered significant. Statistical significance was observed between SVF and unfiltered displacement error in the artifact-induced experiments [Fig. 16(a)] and between SVF and FIR along with SVF and BSS in the artifact-removed experiments [Fig. 16(b)].
Fig. 16.
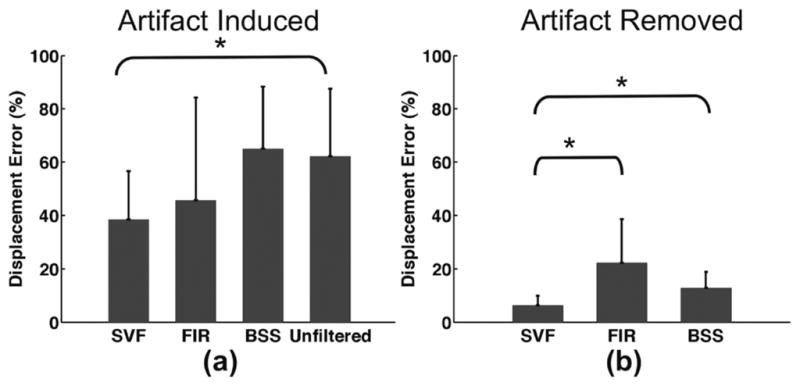
Mean displacement estimation error when (a) artifact was induced in the data and (b) artifact was removed. Error bars represent standard deviation over nine data sets. Statistical significance (*P < 0.05) was determined using a two-sample two-tailed t-test against the hypothesis that the two samples have equal means. Significance was observed in (a) between displacement errors derived from SVF and unfiltered echo data. In (b) significance was observed between SVF and FIR as well as SVF and BSS.
VII. Discussion
A. The Singular Value Filter
We have introduced a new PCA-based signal separation framework whereby basis functions and filter coefficients are determined adaptively from the singular vectors and singular values of local regions of echo data. Fig. 1 illustrates a block diagram of our proposed signal separation framework, which we have termed the singular value filter (SVF). The primary advances to PCA-based signal separation presented in this paper include: 1) the presentation of a general approach for adaptive PCA-based filter design, 2) demonstration of the significance of adaptively defining filter coefficients using the normalized singular spectrum, Σ̃kk, of complex echo data, and 3) demonstration of the significance of non-binary filter weightings determined adaptively from the singular value spectrum. SVF was then demonstrated in application to clutter artifact, a significant source of image degradation in medical ultrasound.
The SVF method presented in this paper is a general approach to PCA-based filtering, which involves the design of a weighting function from a signal model and statistical assumptions regarding the respective source signals. While the SVF technique was validated experimentally in an in vivo mouse cardiac imaging environment, the same filtering scheme is directly transferable to human cardiac imaging where clutter is generally derived from the same source (i.e., rib and sternum) and possesses the same statistical assumptions of greater energy with less motion complexity than underlying cardiac tissue. As anticipated and discussed further below, imaging parameters such as frame rate may effect relative frame-to-frame motion properties of the respective source signals, but this change in imaging conditions will effect optimal filter parameters (e.g., α and τ values) and not the generalized shape of the weighting function. Moreover, the general SVF approach for adaptive PCA-based filtering design can be extended to many different applications beyond clutter filtering in medical ultrasound and filtering can be tuned to the specific application through adjustments to the shape of the weighting function. For example, the inverse of (11) would be ideal in applications where the desirable source signal exhibits the lowest motion complexity, such as in isolating rather than rejecting clutter artifact or stationary tissue signal. Likewise, the weighting function can be easily designed after commonly used filter window functions such as the Gaussian, hamming, or hann window. This strategy may be ideal in applications where the desirable source signal exhibits moderate motion complexity. Another extension of the SVF design strategy would include multiple weighting functions, with each weighting function assigned to a different basis. This may be a particularly useful strategy in applications with a more complex mix of source signals. Finally, a more advanced SVF approach for determination of weighting functions would involve determination of filter coefficients for each basis by minimization or maximization of a cost function. The most straightforward approach consists of finding the coefficients that maximized CNR or minimize displacement error. While this approach may provide superior results, this would come at the expense of an increased computation time.
In addition to the general SVF framework, there are two additional significant insights provided in this paper, which account for enhanced PCA-based filtering performance. The first insight is the significance of adaptively defining filter coefficients using the normalized singular spectrum, Σ̃kk, of complex echo data. The significance of this parameter is most clearly demonstrated in Fig. 3 where it is illustrated that normalized singular values are monotonic with motion only when derived from complex echo data. Because the Σ̃kk parameter is a good measure of the motion characteristics of the underlying data, it can effectively delineate regions containing desirable or undesirable signal components and assign appropriate filter coefficient through the predefined weighting function. The second key insight is the superior performance using PCA-based filtering when filtering coefficients are non-binary. In most applications of PCA-based signal separation of which the authors are aware, filtering is achieved with strict thresholding of basis functions such that signal along these bases are either completely rejected or retained [11]–[19], [21], [24]. In this paper, we have demonstrated that superior performance can be achieved through a different mechanism. Instead of strict thresholding, non-binary coefficients via the weighting function in (11) were shown to result in significantly improved image quality as reflected by higher CNR values. The weighting function used in this paper was constructed such that strict thresholding occurred the weighting function roll-off α → ∞. An example of image degradation from strict thresholding basis functions is illustrated in Fig. 8(c). While the clutter artifact in the middle of the lesion [illustrated in Fig. 8(a)] is adequately suppressed, artifacts are visible in the surrounding background regions of the image. In contrast, a lower α, and thus non-binary filter coefficients, result in good artifact suppression without image degradation in background regions of the image. This effect is reflected in Fig. 7 where CNR is optimized for α of 25 and performance diminished as α → ∞. In agreement with simulation results, the peak mean CNR was achieved in mouse heart experiments with an α value of 25 as illustrated in Fig. 11.
B. SVF Performance for Clutter Suppression in Medical Ultrasound
Simulation and experimental results were provided in order to quantify the performance of the proposed SVF strategy for rejection of clutter artifact in medical ultrasound. For reference, the SVF technique was compared to a simple high-pass FIR filter and a recently proposed PCA-based strategy (BSS method) [2]. Both simulation and experimental data demonstrate superior performance of the SVF approach across a wide range of simulated imaging conditions and across a total of 17 mouse heart data sets.
Several trends may be observed from the CNR simulation results in Figs. 9 and 10. First, absolute performance of SVF diminished as the motion characteristics of the background scatterers approached the motion characteristics of the simulated clutter artifact. This is easily observed in Fig. 9(a) and (b) where the mean CNR of the SVF operating on complex echo data decreased with increasing echo correlation in Fig. 9(a) and decreasing echo shift in Fig. 9(b). The decrease in CNR is due to diminished ability to identify regions of clutter from background scatterers using the normalized singular value spectrum. Results in Fig. 10 demonstrated a decrease in SVF performance with decreased electronic SNR, increased clutter-to-tissue ratio, and with larger ensemble lengths and kernel windows. In Fig. 10(d) a maximum CNR was achieved between kernel lengths of approximately 2 and 4 periods. This point of best performance occurs due to a trade-off in the M dimension of matrix X where larger M provide estimates of PCA basis functions, υk with low variance, but small in order to avoid bias in υk estimates from not meeting stationarity assumptions. There are limitations to the simplified clutter simulation framework used in this paper, which should be recognized when assessing the results in Figs. 9–10. The simulations are not constructed to model the physics of multi-path reverberations from bright specular reflectors. Rather, the simulations are simplified to model only the manifestation of reverberations, which is a superposition of a clutter and underlying tissue component. Likewise, the geometry of the simulated acoustic scatterers is not intended to model human physiology and clutter is placed at the center of the lesion for convenience. Thus, the absolute results of the simulations may not directly translate to in vivo cardiac imaging. Instead, the primary value of the simulation study is to illustrate trends in SVF performance when SVF is constructed to attenuate a clutter signal component from a superposition of clutter and tissue components over a wide range of imaging and signal properties and conditions.
Experimental mouse heart data results demonstrated excellent suppression of clutter artifact using the proposed SVF strategy. In experiments where artifact occurred due to sternum multi-path reverberations (i.e., the non-induced experiments), SVF was demonstrated to provide an average CNR gain of 1.8 dB as reported in Fig. 13. This result was statistically significant at P < 0.05 while statistical significance was not demonstrated for either FIR or BSS methods. The average CNR improvement after FIR and BSS was measured at 0.78 dB and 0.73 dB, respectively. The similar performance of the two methods in terms of CNR agrees well with previously published results for both FIR and BSS techniques where imaging was performed in bladder phantom, in vivo bladder, and in vivo gall bladder environments [2].
After filtering with BSS, FIR, or SVF, 2D speckle tracking was performed on the resulting envelop detected data using a normalized cross-correlation with parabolic sub-sample fitting. Figs. 12 and 14 illustrate example results before and after filtering using SVF. The region of sternum artifact is clearly visible on the left region of myocardium in Fig. 14(a), (top). As a result of the strong clutter artifact, the displacements were estimated from the clutter artifact rather than the underlying tissue. This is shown with the overlying green arrows in Fig. 14(a), (top) and the displacement magnitude map in Fig. 14(a), (bottom) where displacement in the artifact region is near zero. Following signal separation with SVF, the artifacts were clearly reduced or eliminated in the B-mode image from Fig. 14(b), (top) and displacements were therefore estimated from the myocardium rather than the clutter. Significant increases in displacement measured in the artifact regions are observed from the length of the green arrows in Fig. 14(b), (top) versus Fig. 14(a), (top) and in the displacement magnitude maps in Fig. 14(b), (bottom) versus Fig. 14(a), (bottom).
The displacement tracking performance of SVF, BSS, and FIR were quantified in terms of measured increase in displacement estimates and increase in displacement SNR. These results are summarized in Fig. 15 over eight mouse heart data sets for both artifact and normal regions of the mouse heart. Results in Fig. 15(a) demonstrate a statistically significant increase in displacement measured with both the SVF and FIR methods in artifact regions. However, displacement estimates were shown to decrease on average with the FIR method in normal regions as displayed in Fig. 15(b), while measured displacement changes from SVF and BSS in the normal region are much closer to zero on average. Similar trends are observed in Fig. 15(c) and (d) where statistical significance is demonstrated for all three methods in improved displacement SNR for artifact regions but an average decrease in displacement SNR for the FIR and BSS method in normal regions of the myocardium. These results indicate that the SVF, FIR, and BSS filtering methods yield improved tracking in regions of artifact. However, these methods also corrupt normal regions of tissue with SVF corrupting normal regions of tissue the least as reflected in a near-zero change in displacement estimate and smaller standard deviation relative to FIR and BSS.
Additional mouse heart experiments were performed with the goal of quantitatively assessing the displacement tracking error for each filtering method. Therefore, experiments were designed where a removable artifact was induced with a lead wire. Data were acquired over one heart cycle with the artifact induced, and then another heart cycle was acquired after the wire, and thus the artifact, was removed without moving the ultrasound transducer with respect to the mouse. Tracking error was quantified using the expression in (13) where the “true” displacement vectors were defined as the vectors resulting from speckle tracking of unfiltered, envelop-detected echo data in the artifact-removed data set. Results in Fig. 16(a) demonstrate a decrease in displacement error by an average of approximately 40% over the unfiltered data when applying SVF. The SVF technique was the only method that demonstrated statistical significance. Fig. 16(b) shows similar trends to Fig. 15(b) and (d) where SVF demonstrates a much lower effect on regions of the myocardium void of artifact than the FIR and BSS methods. The mean estimated displacement error from SVF in normal regions of the myocardium was shown to be lower, with statistical significance, than both FIR and BSS methods.
Frame rate is an additional imaging parameter that affects SVF performance. Fig. 9 demonstrates the effects of frame rate in simulation where CNR is quantified in terms of echo correlation and axial shift. In the simulation environment, higher echo correlation and lower axial shift values correspond to higher frame rates. Results indicate that SVF provides consistent performance over the entire range illustrated in these simulations. As discussed above, the parameter affecting performance to the greatest extent is the difference in motion characteristics between tissue and artifact. As motion characteristics between tissue and artifact regions become more similar, SVF performance deteriorates. The absolute correlation and shift values, or equivalently the absolute frame rate given the same underlying motion, has the predominant effect of changing the SVF cutoff parameter (τ) used to achieve best performance as quantified by CNR or displacement estimation performance metrics. In experimental mouse heart imaging data, the frame rate was approximately 30–40 frames per heart cycle, and peak mean CNR was achieved with threshold parameter of 0.3 as illustrated in Fig. 11. As heart rate increases, or frame rate decreases, echo correlation between successive A-lines decreases, and thus, as demonstrated in Fig. 3, the normalized singular value parameter, Σ̃11 for image regions of both tissue and artifact will also decrease. The result is a subsequent decrease in the τ parameter used to achieve the best performance, which was observed in simulation. While adaptively adjusting the SVF cutoff parameter for imaging data sets individually, as to adjust for heart rate effects, may provide improvements in filtering performance, this step was not required to achieve good performance. As the results from this paper demonstrate, the SVF cutoff value of 0.3 was used over a wide range of frames per heart cycle (between 30–40) and provided good filtering performance, which indicates that SVF weighting function parameters are robust to frame rate and related imaging parameters and conditions (e.g., heart rate and tissue motion).
The efficacy of the SVF technique, using the weighting function implemented in this paper, is based on the use of normalized singular spectra, Σ̃kk, to delineate regions of clutter and tissue from regions of tissue alone. Moreover, Σ̃kk was used in the weighting function to determine filter coefficients assigned to each PCA basis with the goal of removing the clutter component in regions of clutter and tissue. This use of Σ̃kk is effective as a result of the differences in motion characteristics between clutter and cardiac tissue. Based on observation, in a diagnostic imaging environment, clutter is most often derived from ribs or other anatomy that exhibits less motion than cardiac tissue. This observation is the basis of our assumptions used to construct the weighting function. However, it is conceivable that clutter can also arise from the cardiac tissue itself. In this instance, as well as in additional applications where the undesirable and desirable components possess equivalent motion characteristics, the SVF technique as implemented in this paper is expected to be ineffective.
VIII. Conclusion
A new signal processing technique, referred to as the singular value filter (SVF), has been presented for PCA-based signal separation in medical ultrasound. Significantly, we have demonstrated the importance of complex data and non-binary filter coefficients on the performance of this method in application to ultrasound clutter artifact rejection. Moreover, we have provided a framework for SVF filter design, which involves the use of a signal model and statistical assumptions concerning the respective source signals in order to achieve filtering with both basis functions and filter coefficients determined adaptively from the input data. The singular value spectrum from complex echo data was demonstrated to provide good identification of local regions of clutter artifact and therefore an efficacious means to adaptively determination of filter coefficients via the weighting function. In simulations of a hypoechoic lesion, SVF was shown to possess excellent suppression of clutter artifact with resulting mean CNR within 1 dB of perfect filtering across a wide array of imaging parameters. SVF was shown to outperform a basic high-pass FIR filter and an alternative PCA-based approach (BSS) when operating on simulated and experimental data. In experimental mouse heart data, SVF demonstrated an average increase of 1.8 dB in CNR, 128% increase in estimated displacement, and over 40% decrease in tracking error in regions of clutter artifact. In conclusion, the SVF technique is a general framework for PCA-based filtering with both basis functions and filtering coefficients determined adaptively from input data. The technique is potentially applicable for a wide array of applications in medical imaging and has been rigorously demonstrated in this paper to provide excellent suppression of artifact and improved motion estimation.
Acknowledgments
This work was supported in part by the National Institutes of Health under Grant EB001826.
The authors gratefully acknowledge VisualSonics for technical support.
Contributor Information
F. William Mauldin, Jr., Email: fwm5f@virginia.edu, Department of Biomedical Engineering, University of Virginia, Charlottesville, VA 22908 USA
Dan Lin, Department of Biomedical Engineering, University of Virginia, Charlottesville, VA 22908 USA.
John A. Hossack, Email: hossack@ieee.org, Department of Biomedical Engineering, University of Virginia, Charlottesville, VA 22908 USA
References
- 1.Lediju MA, Pihl MJ, Dahl JJ, Trahey GE. Quantitative assessment of the magnitude, impact, and spatial extent of ultrasonic clutter. Ultrason Imag. 2008;30(3):151–168. doi: 10.1177/016173460803000302. [DOI] [PMC free article] [PubMed] [Google Scholar]
- 2.Lediju MA, Pihl MJ, Hsu SJ, Dahl JJ, Gallippi CM, Trahey GE. A motion-based approach to abdominal clutter reduction. IEEE Trans Ultrason, Ferroelect, Freq Contr. 2009 Nov;56(11):2437–2449. doi: 10.1109/TUFFc.2009.1331. [DOI] [PMC free article] [PubMed] [Google Scholar]
- 3.Zwirn G, Akselrod S. Stationary clutter rejection in echocardiography. Ultrasound Med Biol. 2006;32(1):43–52. doi: 10.1016/j.ultrasmedbio.2005.08.012. [DOI] [PubMed] [Google Scholar]
- 4.French BA, Li Y, Klibanov AL, Yang Z, Hossack JA. 3D perfusion mapping in post-infarct mice using myocardial contrast echocardiograph. Ultrasound Med Biol. 2006;32(6):805–815. doi: 10.1016/j.ultrasmedbio.2006.03.002. [DOI] [PubMed] [Google Scholar]
- 5.Tanabe M, Lamia B, Tanaka H, Schwartzman D, Pinsky MR, Gorcsan J., III Echocardiographic speckle tracking radial strain imaging to assess ventricular dyssynchrony in a pacing model of resynchronization therapy. J Am Soc Echocardio. 2008;12:1382–1388. doi: 10.1016/j.echo.2008.09.012. [DOI] [PMC free article] [PubMed] [Google Scholar]
- 6.Li Y, Garson CD, Xu Y, Beyers RJ, Epstein FH, French BA, Hossack JA. Quatification and MRI validation of regional contractile dysfunction in mice post myocardial infarction using high resolution ultrasound. Ultrasound Med Biol. 2007;33(6):894–904. doi: 10.1016/j.ultrasmedbio.2006.12.008. [DOI] [PMC free article] [PubMed] [Google Scholar]
- 7.Li Y, Garson CD, Xu Y, French BA, Hossack JA. High frequency ultrasound imaging detects cardiac dyssynchrony in noninfarcted regions of the murine left ventricle late after reperfused myocardial infarction. Ultrasound Med Biol. 2008;34(7):1063–1075. doi: 10.1016/j.ultrasmedbio.2007.12.009. [DOI] [PMC free article] [PubMed] [Google Scholar]
- 8.Leung KYE, Danilouchkine MG, van Stralen M, de Jong N, van der Steen AFW, Bosch JG. Probabilistic framework for tracking in artifact-prone 3D echocardiograms. Med Image Anal. 2010;14:750–758. doi: 10.1016/j.media.2010.06.003. [DOI] [PubMed] [Google Scholar]
- 9.Bjaerum S, Torp H, Kristoffersen K. Clutter filter design for ultrasound color flow imaging. IEEE Trans Ultrason, Ferroelect, Freq Contr. 2002 Feb;49(2):204–216. doi: 10.1109/58.985705. [DOI] [PubMed] [Google Scholar]
- 10.Kadi AP, Loupas T. On the performance of regression and step-initialized IIR clutter filters for color doppler systems in diagnostic medical ultrasound. IEEE Trans Ultrason Ferroelect, Freq Contr. 1995 Sep;42(5):927–937. [Google Scholar]
- 11.Kruse DE, Ferrara KW. A new high resolution color flow system using an eigende composition-based adaptive filter for clutter rejection. IEEE Trans Ultrason Ferroelect, Freq Contr. 2002 Dec;49(12):1739–1754. doi: 10.1109/tuffc.2002.1159852. [DOI] [PubMed] [Google Scholar]
- 12.Yu ACH, Lovstakken L. Eigen-based clutter filter design for ultrasound color flow imaging: A review. IEEE Trans Ultrason Ferroelect, Freq Contr. 2010 May;57(5):1096–1111. doi: 10.1109/TUFFC.2010.1521. [DOI] [PubMed] [Google Scholar]
- 13.Yu ACH, Cobbold RSC. Single-ensemble-based eigen-processing methods for color flow imaging—Part I. The Hankel-SVD filter. IEEE Trans Ultrason Ferroelect, Freq Contr. 2008 Mar;55(3):559–572. doi: 10.1109/TUFFC.2008.682. [DOI] [PubMed] [Google Scholar]
- 14.Gallippi CM, Nightingale KR, Trahey GE. BSS-based filtering of physiological and ARFI-induced tissue and blood motion. Ultrasound Med Biol. 2003;29(11):1583–1592. doi: 10.1016/j.ultrasmedbio.2003.07.002. [DOI] [PubMed] [Google Scholar]
- 15.Ledoux LAF, Brands PJ, Hoeks APG. Reduction of the clutter component in doppler ultrasound signals based on singular value decomposition: A simulation study. Ultrason Imaging. 1997;19(1):1–18. doi: 10.1177/016173469701900101. [DOI] [PubMed] [Google Scholar]
- 16.Bjaerum S, Torp H, Kristoffersen K. Clutter filters adapted to tissue motion in ultrasound color flow imaging. IEEE Trans Ultrason Ferroelect, Freq Contr. 2002 Jun;49(6):693–704. doi: 10.1109/tuffc.2002.1009328. [DOI] [PubMed] [Google Scholar]
- 17.Gallippi CM, Trahey GE. Adaptive clutter filtering via blind source separation for two-dimensional ultrasonic blood velocity measurement. Ultrason Imag. 2002;24(4):193–214. doi: 10.1177/016173460202400401. [DOI] [PubMed] [Google Scholar]
- 18.Mauldin FW, Jr, Viola F, Walker WF. Complex principal components for robust motion estimation. IEEE Trans Ultrason Ferroelect, Freq Contr. 2010 Nov;57(11):2437–2449. doi: 10.1109/TUFFC.2010.1710. [DOI] [PMC free article] [PubMed] [Google Scholar]
- 19.Yu ACH, Cobbold RSC. Single-ensemble-based eigen-processing methods for color flow imaging—Part II. The matrix pencil estimator. IEEE Trans Ultrason Ferroelect, Freq Contr. 2008 Mar;55(3):573–587. doi: 10.1109/TUFFC.2008.683. [DOI] [PubMed] [Google Scholar]
- 20.Gallippi CM, Trahey GE. Blind source separation-based velocity estimation (BSSVE): Simulation and clinical results. IEEE Symp Ultrason. 2003 Oct 5–8;1:855–860. [Google Scholar]
- 21.Li M. Adaptive imaging using principal-component-synthesized aperture data. IEEE Symp Ultrason. 2008;1:1076–1079. [Google Scholar]
- 22.Pereira WCA, Maciel CD. Performance of ultrasound echo decomposition using singular spectrum analysis. Ultrasound Med Biol. 2001;27(9):1231–1238. doi: 10.1016/s0301-5629(01)00423-9. [DOI] [PubMed] [Google Scholar]
- 23.Machado CB, Pereira MCA, Meziri M, Laugier P. Characterization of in vitro healthy and pathological human liver tissue periodicity using backscattered ultrasound signals. Ultrasound Med Biol. 2006;32(5):649–657. doi: 10.1016/j.ultrasmedbio.2006.01.009. [DOI] [PubMed] [Google Scholar]
- 24.Mauldin FW, Jr, Zhu H, Behler RH, Gallippi CM. Robust principal component analysis and clustering methods for automated classification of tissue response to ARFI excitation. Ultrasound Med Biol. 2008;34(2):309–325. doi: 10.1016/j.ultrasmedbio.2007.07.019. [DOI] [PMC free article] [PubMed] [Google Scholar]
- 25.Jolliffe IT. Springer Series in Statistics. 2. New York: Springer; 2002. Principal Component Analysis. [Google Scholar]
- 26.Hotelling H. Analysis of a complex of statistical variables into principal components. J Edu Psychol. 1933;24:417–441. [Google Scholar]
- 27.Miranda AA, Borgne Y, Bontempi G. New routes from minimal approximation error to principal components. Neural Process Lett. 2008;27(3):197–207. [Google Scholar]
- 28.Vautard R, Ghil M. Singular spectrum analysis in nonlinear dynamics, with applications to paleoclimatic time series. Physica D. 1989;35:395–424. [Google Scholar]
- 29.Jensen JA, Svendsen NB. Calculation of pressure fields from arbitrary shaped, apodized, and excited ultrasound transducers. IEEE Trans Ultrason Ferroelect, Freq Contr. 1992 Mar;39:262–267. doi: 10.1109/58.139123. [DOI] [PubMed] [Google Scholar]
- 30.Patil AV, Garson CD, Hossack JA. 3D prostate elastography: Algorithm, simulations, and experiments. Phys Med Biol. 2007;52(12):3643–3663. doi: 10.1088/0031-9155/52/12/019. [DOI] [PubMed] [Google Scholar]