

Abstract
Although inducible nitric oxide synthase (iNOS) is known to play significant roles in the kidney, its renal localization has long been controversial. To resolve this issue, the authors identified iNOS-positive cell types in rat kidneys using double immunohistochemistry and confirmed iNOS positivity using enzyme histochemistry with NADPH-diaphorase (NADPH-d) and in situ RT-PCR. Adult male Sprague-Dawley rats were injected intraperitoneally with lipopolysaccharide (LPS) or saline as a control and sacrificed at various time intervals after injection. Quantitative real-time reverse transcriptase polymerase chain reaction showed that iNOS was not expressed in control kidneys but was induced in LPS-treated kidneys. iNOS immunostaining was strongest 6 to 18 hr after injection and decreased gradually to control levels by day 7. Double immunohistochemistry and NADPH-d revealed that iNOS expression was induced in the interstitial cells, glomerular parietal epithelial cells, the proximal part of the short-looped descending thin limb, the upper and middle papillary parts of the long-looped descending thin limb, some inner medullary collecting duct cells, and almost all calyceal and papillary epithelial cells. The present study determines the precise localization of iNOS in LPS-treated rat kidneys and provides an important morphological basis for examining the roles of iNOS in sepsis-induced acute kidney injury.
Keywords: inducible nitric oxide synthase, kidney, lipopolysaccharide, rat, immunohistochemistry, enzyme histochemistry, in situ reverse transcriptase polymerase chain reaction, transmission electron microscopy
Lipopolysaccharide (LPS) is a product of the cell walls of gram-negative bacteria and one of the major causes of septic shock in humans. Sepsis readily causes nitric oxide (NO) overproduction, which subsequently initiates a cascade of inflammatory responses leading to tissue injury and, eventually, dysfunction of multiple organs, including the kidney (Wolkow 1998; Schrier and Wang 2004).
NO is synthesized by NO synthase (NOS), which has isoforms that have been classified into three types (Forstermann et al. 1994): neuronal NOS (nNOS), inducible NOS (iNOS), and endothelial NOS (eNOS); recently, a fourth type, mitochondrial NOS (mtNOS), has been reported (Bates et al. 1996; Ghafourifar and Richter 1997). In contrast to the constitutively expressed NOS isoforms (nNOS, eNOS, and mtNOS), iNOS is normally undetectable under physiological conditions but can be induced de novo under experimental or pathological conditions. Mass production of NO and NO-derived peroxynitrate in disease states is mainly ascribed to excessive induction of iNOS, and these products exert various systemic and local effects on the kidneys as well as in other organs. Therefore, many previous investigations of selective modulation of iNOS expression in the kidney have been carried out (for review, see Heemskerk et al. 2009). Because local NO production in the kidney may play an important role in renal function in an autocrine/paracrine manner (Johnson and Freeman 1994; Lancaster 1994; Lau et al. 1995; Kipari et al. 2006), determining the cellular localization of iNOS is critical in clarifying the mechanisms involved in NO-related renal function. Although renal iNOS expression has been extensively examined, its expression and cellular localization remain controversial. Some investigators have reported constitutive iNOS protein in several different renal structures in normal/control kidneys; others have failed to detect it (Table 1). Furthermore, even with agreement on an increase in renal iNOS expression under experimental/pathological conditions, its cellular localization has been reported very differently by various investigators. These discrepancies may be due to differences in the species studied, experimental models, pathological states, methods of experimental procedures, and so forth. However, there were also distinct differences reported in the constitutive expression and cellular localization of iNOS among the studies using an LPS-treated (LPS-t) rat model (Table 1), one of the most common animal models for investigating sepsis-induced acute kidney injury (Doi et al. 2009).
Table 1.
Immunohistochemical Localization of Renal iNOS from Sham (Control)/Diseased (Experimental) Animals
| Localization | Species | References |
|---|---|---|
| T/T | White rabbit | J Anesth. 24:73–80 (2010) |
| −/G, T | SD rat | Am J Nephrol. 29:274–282 (2009) |
| −/G | SD rat | J Nephrol. 22:800–808 (2009) |
| −/CPEc, GPEc, ISc, VE | Wistar rata | Nephrol Dial Transplant. 24: 2338–2349 (2009) |
| −/DT, PT | SD rat | Urol Res. 37:159–164 (2009) |
| CCD, DT, MCD, PT/CCD, DT, MCD, PT | Female Dss rat | Gend Med. 5–147 (2008) |
| −/PT | SD rat | Toxicol Pathol. 36:397–409 (2008) |
| −/PT | Wistar rata | Pflugers Arch. 454:321–334 (2007) |
| −/CPEc, ISc, T | Female C57BL/6 mouse | FASEB J. 20:E1619–E1627 (2006) |
| T/T | Wistar rat | Free Radic Biol Med. 40:992–1003 (2006) |
| PT/PT | SD rat | BJU Int. 98:680–686 (2006) |
| T/T | Wistar rata | J Invest Surg. 19:19–30 (2006) |
| −/DT, PT, TL, VE | Wistar rat | J Histochem Cytochem. 53:1459–1468 (2005) |
| PT/PT | SD rat | APMIS. 112:358–68 (2004) |
| −/MD, T, VE | SD rata | Exp Physiol. 87–153 (2002) |
| –, or T/ISc, or T | Wistar rat | J Am Soc Nephrol. 13:2278–2287 (2002) |
| CPEc, G, VE/CPEc, G, VE | Wistar-albino rat | Pharmacol Res. 46: N0.4 (2002) |
| −/G | SD rata | Am J Physiol Renal Physiol. 281:293–299 (2001) |
| CD, DT/CD, DT | SD rat | Hypertension. 37:1164–1170 (2001) |
| G, T/G, T | MRL/lpr mouse | J Lab Clin Med. 138:69–77 (2001) |
| −/VE | Female mongrel dog | J Urol. 166–1524 (2001) |
| T/CPEc, ISc, T | C3H/HeN mice | Kidney Int. 59:893 (2001) |
| −/G, PT | Female Wistar rat | BJU Int. 85:1007–1013 (2000) |
| −/G, T | Wistar rata | J Lab Clin Med. 134:471–477 (1999) |
CCD, cortical collecting ducts; CPEc, calyceal and papillary epithelial cells; DT, distal tubules; G, glomerulus; GPEc, glomerular parietal epithelial cells; ISc, interstitial cells; MCD, medullary collecting ducts; MD, macular densa; PT, proximal tubules; SD, Sprague-Dawley; T, tubular cells; TL, thin limb; VE, vascular endothelium; –, negative.
Lipopolysaccharide-treated rat model.
Fujihara et al. (2002) reported that the localization of iNOS may vary according to the type of antibody used. Although their result may partly account for discrepancies in the localization of renal iNOS among previous immunohistochemical studies, the question of which immunoreactivity result is correct remains unclear.
Enzyme histochemistry with NADPH-diaphorase (NADPH-d) has been widely used to identify specific populations of cells. Once NADPH-d was determined to be a component of NOS and a histochemical maker for cells producing NO (Hope et al. 1991; Young et al. 1992), many investigators have used NADPH-d to examine the expression and activity of NOS (Gabbott and Bacon 1993; Spessert and Layes 1994). This method, however, does not allow distinction among isoforms of NOS, and diaphorase activity unrelated to NOS may arise (Spessert and Claassen 1998). Nevertheless, all isoforms of NOS are detected (Tracey et al. 1993), and the subcellular localization of NOS can be clearly identified using enzyme electron microscopy (Qi and Guy 1996; Uckert et al. 2003). We used NADPH-d together with in situ reverse transcriptase polymerase chain reaction (RT-PCR) to localize iNOS mRNA and confirm the true positivity of iNOS immunostaining. Thus, we have definitively established the presence and localization of iNOS in the kidneys of control and LPS-t rats.
Materials and Methods
Animals and Tissue Preparation
This study was approved by the Animal Care Committee of the Catholic University of Korea. In all experiments, adult male Sprague-Dawley rats (Orient Bio, Inc., Seongnam, Korea) of ~230 g body weight were used. LPS injection was administered as reported previously (Madsen et al. 1997). Two different types of LPS were used: LPS from Escherichia coli (026:B6 [L3755; Sigma-Aldrich, St. Louis, MO]), 10 mg/kg body wt, or LPS from Klebsiella pneumoniae (L1519; Sigma), 20 mg/kg body wt. Because there were no differences in response to the two types of LPS, all animals injected with LPS were analyzed as one group.
Animals were single-injected intraperitoneally with sterile saline (control, n=3 per group) or LPS (LPS-t, n=6 per group). Animals were sacrificed at 1, 3, 6, 8, 12, and 18 hr and 1, 3, and 7 days after injection. Under anesthesia, blood was collected via the abdominal aorta. The rats were then briefly perfused with phosphate-buffered saline (PBS) to remove the blood. Blood urea nitrogen (BUN) levels were measured using the i-STAT System (Abbott Laboratories; Abbott Park, IL). One kidney was excised and used for quantitative RT-PCR. The other kidney and liver were perfused with 4% paraformaldehyde for 10 min, removed, and postfixed for 3 hr in the same fixative at 4C. After fixation, 50-µm-thick vibratome sections were cut and processed for immunohistochemistry and NADPH-d. Some sections were equilibrated with 30% (w/v) sucrose in 0.1 M PB and frozen until used.
Antibodies
For iNOS immunohistochemistry, five different antibodies were used: rabbit anti-iNOS2 antibody (06–573, 1:500; Millipore, Temecula, CA), rabbit anti-NOS2 (SC-650, 1:1000; Santa Cruz Biotechnology, Santa Cruz, CA), rabbit anti-iNOS2 (610332, 1:300), mouse anti-iNOS2 (610431, 1:200), and mouse anti-iNOS2 (610328, 1:200) from BD Transduction Laboratories (Lexington, KY).
To identify iNOS-positive cell types, the following cell-specific antibodies were used: rabbit anti-aquaporin-1 (AQP1) (AB3065, 1:500; Chemicon, Temecula, CA) for the descending thin limb (DTL) of Henle’s long loop and the endothelium of the descending vasa recta, rabbit anti-aquaporin-2 (AQP2) (AB3274, 1:200; Millipore) for collecting duct cells, rabbit anti–urea transporter (UT-A2) (1:100; courtesy of Dr. Jeff M. Sands, Emory University, Atlanta, GA) for the DTL of Henle’s short loop, rabbit anti–chloride channel (CLC-K) (AB5392, 1:100; Chemicon) for the ascending thin limb of Henle’s loop, and mouse anti-ED-1 (MCA341GA, 1:100; Serotec, Oxford, UK) for macrophages.
Peroxidase-conjugated donkey anti-rabbit or mouse IgG Fab fragments (1:100; Jackson ImmunoResearch Laboratories, West Grove, PA) were used as secondary antibodies.
Quantitative RT-PCR
Total RNA was extracted from the renal cortex, outer medulla, and inner medulla with TRIzol reagent (Invitrogen, Carlsbad, CA), and the purity and yield of the RNA were determined spectrophotometrically. One microgram of total RNA from each sample was transcribed into first-strand cDNA using reverse transcriptase M-MLV (Takara Korea Biomedical, Inc., Seoul, Korea) in a total volume of 20 µl according to the manufacturer’s instructions. Equal amounts (1 µl) of cDNA were real-time amplified in a Rotor-Gene RG-6000 (Corbett Research, Mortlake, Australia) using the SYBR Premix EX Taq kit (RR420A, Takara Korea Biomedical, Inc.). The primers were designed at the Internet site provided by Integrated DNA Technologies, Inc. (Coralville, IA; http://eu.idtdna.com/Scitools/Applications/RealTimePCR/). The sequences of the primers used were as follows: iNOS, accession number NM_012611, forward GACCAGAAACTGTCTCACCTG and reverse CGAACATCGAACGTCTCACA; Monocyte chemoattractant protein-1 (MCP-1), accession number NM_031530, forward GGTCTCTGTCACGCTTCTG and reverse TTCTCCAGCCGACTCATTG; regulated upon activation, normal T cell expressed and secreted (RANTES), accession number NM_031116, forward CACCTGCCTC-CCCATATG and reverse TTCCTTCGAGTGACAAAGACG; GAPDH, accession number NM_017008, forward GGAT-GGAATTGTGAGGGAGA and reverse GTGGACCTCA-TGGCCTACAT. The primers were verified to generate a single PCR product using gel electrophoresis after conventional PCR. The PCR conditions were as follows: incubation for 10 min at 95C, followed by 45 cycles of denaturation at 95C for 10 sec, annealing at 60C for 15 sec, and extension at 72C for 20 sec. A reaction mixture lacking cDNA was used as the negative control. The data were analyzed using Rotor-Gene 6000 Series software (version 1.7.75; Corbett Research). The expression level of iNOS was calculated using the comparative threshold cycle method (2–ΔΔCt) with GAPDH as the control gene.
iNOS Immunohistochemistry
For iNOS immunohistochemistry, the vibratome sections were processed using a previously reported preembedding immunoperoxidase method with 3,3′-diaminobenzidine (DAB) as the chromogen (Cha et al. 2001). Some of the immunostained vibratome sections were used for transmission electron microscopic observation to examine subcellular immunolocalization. Negative controls were analyzed following the same procedures without primary antisera and showed no positive reactivity (data not shown).
Double Immunohistochemistry
After the iNOS-immunostained vibratome sections were embedded in resin, double immunohistochemistry was performed using antibodies against AQP1, AQP2, UT-A, and CLC-K to identify iNOS-positive cells. Semithin sections (1.5 µm thick) were cut and treated for 30 min with a saturated solution of sodium hydroxide diluted 1:1 in absolute ethanol to remove the resin. To elute the antibodies from the first round of immunostaining, we used a heat-mediated antibody stripping method (Lan et al. 1995). Briefly, section slides were submerged in a staining jar with 10 mM citrate buffer (pH 6.0) and microwaved at 800 W to the boiling point for 2 to 3 min at 100% power and then heated for an additional 5 min at 50% power. The slides were allowed to cool for 30 min at room temperature followed by a second round of immunostaining. After rinsing in tap water, the tissue sections were incubated for 15 min in 1.4% methanolic H2O2 solution. The sections were incubated with normal donkey serum followed by incubation overnight at 4C with AQP1, AQP2, UT-A2, or CLC-K antibodies. After several washes in PBS, the tissue sections were incubated for 2 hr with horseradish peroxidase–conjugated donkey anti-rabbit IgG Fab fragments. For detection, Vector SG (Vector Laboratories, Burlingame, CA) was used to produce a blue color that is easily distinguishable from the brown staining produced by diaminobenzidine used for detection of iNOS.
NADPH-d Enzyme Histochemistry
For NADPH-d enzyme histochemistry, the vibratome sections were pretreated with Tris-HCl buffer (TB, pH 8.0) and incubated for 1 hr at 37C in TB containing 0.2% Triton X-100, 0.2 mM nitro blue tetrazolium, and 1 mM β-NADPH. The stained sections were postfixed with 2.5% glutaraldehyde and 1% OsO4 (in 0.1 M phosphate buffer, pH 7.4), dehydrated, and embedded in poly/Bed 812 resin. Semithin sections were prepared for light microscopy, and ultrathin sections were photographed using a JEM-1010 transmission electron microscope (JEOL, Tokyo, Japan). All chemicals for NADPH-d enzyme histochemistry were purchased from Sigma-Aldrich.
In Situ RT-PCR
To determine iNOS mRNA localization, frozen vibratome sections were processed using a modification of the whole-mount method (Abdel-latief et al. 2008) and one-step in situ RT-PCR (Sato et al. 2011). Vibratome sections were immersion-fixed in 4% paraformaldehyde (in PBS buffer; pH 7.2) for 30 min at room temperature. After fixation, the sections were washed three times in PBS for 20 min. To enhance the penetration of RT-PCR enzymes, the sections were dehydrated and rehydrated in an ethanol series of 30%, 50%, 70%, 90%, and 100% (vol/vol) ethanol/water (5 min each step), then treated with 0.5% Triton-X100 solution (in PBS buffer; pH 7.2) for 30 min. After washing the sections in nuclease-free water, one-step in situ RT-PCR was performed in a PTC-100 thermal cycler (Bio-Rad Laboratories, Hercules, CA) using RT-PCR Quick Master Mix (Toyobo, Osaka, Japan) containing Thermus thermophilus (Tth) DNA polymerase, which combines cDNA synthesis and PCR amplification in a single reaction mixture. The reaction mixture (50 µl/tube/section) contained 25 µl 2× Quick Master Mix, 18 µl nuclease-free water, 2.5 µl 50 mM Mn(OAc)2, 2 µl each primer (stock: 10 pmol/µl), and 0.5 µl 25 nM digoxigenin-11-dUTP (Roche, Mannheim, Germany). The cDNA was synthesized at 60C for 50 min. The PCR conditions were as follows: incubation for 5 min at 94C, followed by 25 cycles of denaturation at 94C for 70 sec, annealing at 60C for 70 sec, extension at 72C for 60 sec, and termination with a final extension at 72C for 8 min. Five sets of primers (iNOS, accession number NM_012611) were used as follows: (1) forward GTGCTAATGCGG-AAGGTCAT and reverse CATGGTGAACACGTTCTTGG (627 bp), (2) forward GCAAACACCTTGGAAGAGGA and reverse AACATCGAACGTCTCACAGG (330 bp), (3) forward TCCTCTTTGCTACTGAGACAGG and reverse GTGAGACAGTTTCTGGTCGATG (320 bp), (4) forward TCAACACCAAGGTTGTCTGC and reverse GTCAT-GAGCAAAGGCACAGA (227 bp), and (5) forward TTCAGATCCCGAAACGCTAC and reverse TGATGTC-CAGGAAGTAGGTGAG (429 bp). Each primer pair was tested to ensure generation of single RT-PCR products using one-step in situ RT-PCR Quick Master Mix with total RNA samples from 8-hr LPS-t rat kidney. After RT-PCR, the sections were fixed in 2.5% glutaraldehyde in PBS for 30 min at room temperature and washed twice in 0.1× SSC (standard saline citrate) for 20 min at 45C and in PBS for 10 min. After a blocking step, the sections were incubated with anti-digoxigenin antiserum conjugated with alkaline phosphatase at 4C overnight. Histochemical detection was then performed using the 4–nitroblue tetrazolium chloride/5-bromo-4-chloro-3-indolyl-phosphate mixture (Roche). After histochemical detection, sections were embedded in resin, and semithin sections were cut and examined with an Olympus photomicroscope (Tokyo, Japan) equipped with differential-interference contrast. Some semithin sections were double immunostained using antibodies against AQP1 and UT-A to identify cell types by double immunohistochemistry (see below) with DAB as a chromogen.
For positive control of in situ RT-PCR, the same procedure was performed in liver sections. Negative controls were analyzed by following the same procedures with a primer-free reaction mixture and showed no positive reactivity (data not shown). All solutions for in situ RT-PCR were treated with diethylpyrocarbonate (DEPC) before use.
Statistics
Data are expressed as means ± standard deviation (SD). Statistically significant differences between two groups were determined using an unpaired Student’s t-test. p<0.01 was considered significant.
Results
LPS-induced Renal Failure
The BUN levels of the LPS-t rats significantly increased beginning 1 hr after injection and reached a maximum at 8 hr. Thereafter, BUN levels declined gradually, remained relatively high at 1 day, and returned to the control level after 3 days (Fig. 1). MCP-1 and RANTES expression significantly increased in LPS-t rats beginning 1 hr after injection. MCP-1 levels reached a maximum at 8 hr and then abruptly decreased. RANTES was expressed at high levels from 6 to 8 hr and decreased gradually (Suppl. Figs. S1 and S2). To examine infiltrating macrophages, as is generally performed in histological evaluations of renal injury, ED-1 immunohistochemistry was performed. In the control kidney, very small numbers of ED-1-positive cells were found, especially around the glomeruli. After LPS-t, ED-1 immunoreactivity increased in intensity and number, reached a maximum at 12 hr, and increased levels continued to 3-day LPS-t (Suppl. Figs. S3 and S4). At 8-hr LPS-t, when iNOS expression was at an immunohistochemical maximum, almost all the ED-1-positive cells coexpressed iNOS (Suppl. Fig. S5). Time- and region-dependent ED-1-positive cell numbers are summarized in Supplemental Table S1. These data were similar to other reports in LPS-t models (Meyer-Schwesinger et al. 2009) and indicate that septic renal failure was successfully induced.
Figure 1.

Changes in serum blood urea nitrogen (BUN) levels in control and lipopolysaccharide-treated (LPS-t) rats. *p<0.01 versus control.
Expression of iNOS mRNA
In the control group, the expression level of iNOS mRNA was very low (mean Ct = 27.15, 25.47, and 26.06 in the cortex, outer medulla, and inner medulla, respectively). Induction of iNOS mRNA was evident as early as 1 hr after LPS injection, was highest at 6 to 8 hr, and then decreased rapidly. The expression patterns of iNOS mRNA for the cortex and outer and inner medulla were similar (Fig. 2).
Figure 2.

Real-time PCR analysis of inducible nitric oxide synthase (iNOS) in control and lipopolysaccharide-treated (LPS-t) rat kidneys. The expression level of iNOS was calculated using the comparative threshold cycle method (2–ΔΔCt) with GAPDH as the control gene. The expression level of iNOS in the control was set to 1. co, cortex; im, inner medulla; om, outer medulla. *p<0.01; #p<0.05 versus control.
Localization and Identification of iNOS-producing Cells by Immunohistochemistry
For iNOS immunohistochemistry, five different antibodies were tested. One of the antibodies, mouse anti-iNOS2 (610431; BD Transduction Laboratories), produced immunostaining results similar to those of the other antibodies, except that it immunostained the macula densa in both the control and LPS-t groups (Fig. 3A,B) where only nNOS, not iNOS, is known to be localized. The other antibodies did not immunostain the macula densa (Fig. 3C). For this reason, all of the data using this mouse anti-iNOS2 antibody (610431) were excluded from the final results.
Figure 3.

Vibratome sections (50 µm thick) of the renal cortex from the control (A) and 8-hr lipopolysaccharide-treated (LPS-t) rat kidney (B,C) groups immunostained using mouse inducible nitric oxide synthase (iNOS) antibody (610431) (A,B) and rabbit iNOS antibody (610332) purchased from BD Transduction Laboratories (C). For the 610431 antibody immunohistochemistry, no immunostained structure except the macula densa (double arrow in inset of A) was detected in control rat kidneys (A). Note that the immunostaining result using the 610431 antibody is very similar to that using the 610332 antibody except for the macula densa staining (double arrow in inset of B). Arrows in insets of B and C indicate immunostained glomerular parietal epithelial cells. Scale bars = 50 (inset), 500 µm.
We also tested a number of modifications of immunohistochemical procedures and found that a change in antibody dilution may produce different immunostaining. At a lower dilution (1:100) of the antibody purchased from Santa Cruz Biotechnology, the cortical and some medullary tubules from both control and LPS-t rat kidneys were iNOS immunostained, whereas iNOS was negative in these tubular structures at a higher dilution (1:1000) (Fig. 4A,B). Transmission electron microscopy showed that these immunoreactivities in the tubular structures were localized mainly in the mitochondria (Fig. 4C,D), but immunoreactivities in interstitial cells (ISc), inner medullary collecting duct cells (IMCDc), glomerular parietal epithelial cells (GPEc), and calyceal and papillary epithelial cells (CPEc) were localized in the cytoplasm (Fig. 4C,E). The intertubular vascular endothelium was iNOS negative (Fig. 4C). The other iNOS antibodies used in the present study showed no marked change in immunolocalization with dilution.
Figure 4.

Light (A,B) and transmission electron (C–E) micrographs for the 8-hr lipopolysaccharide-treated (LPS-t) rat kidney group immunostained using rabbit anti-NOS2 purchased from Santa Cruz Biotechnology. (A) Using a higher dilution (1:1000), proximal (PT) and distal tubules (DT) were completely immunonegative. (B) The PT and DT immunostained with a lower dilution of the antibody (1:100). (A,B) Note the inducible nitric oxide synthase (iNOS)–positive glomerular parietal epithelial cells (arrows), the wandering cells in the glomerular capillary lumen (open arrows), and the iNOS-negative glomerular tufts. (C) An interstitial cell (I2) and PT are densely stained with a lower dilution of the antibody. Note that another interstitial cell (I1) and intertubular vascular endothelia (arrows) are iNOS negative. (D) Magnification of the boxed area in C. Immunoreactivity in the proximal tubule was localized mainly in mitochondria (Mt). (E) In the inner medullary collecting duct (IMCD), an iNOS-positive cell (arrow) is observed. Scale bars = 30 (A, B), 2 (C, E), 0.2 (D) µm.
Control kidneys were nearly negative for iNOS. There was no immunoreactivity in renal tubular structures other than very small numbers of iNOS-positive ISc (data not shown).
In contrast, iNOS was expressed in LPS-t kidneys in several types of cells: ISc, most but not all GPEc, the DTLs of the short and long loop of Henle, IMCDc, and CPEc. No iNOS immunoreactivity was detected in the proximal and distal tubules, thick ascending limb, or cortical or outer medullary collecting ducts in any experimental group. Glomerular and intertubular capillary endothelia were also iNOS negative.
Temporal expression patterns of iNOS-positive structures were similar, except that iNOS induction in the DTL of the inner medulla and CPEc was a little later and remained elevated a little longer than in the other structures. One hour after LPS injection, only a small increase in iNOS-positive ISc was observed. Induction of iNOS protein in several types of cells was observed 3 hr after injection, remained high over 6 to 18 hr, and decreased gradually to the control level by day 7.
Unlike ISc, GPEc, IMCDc, and CPEc which can all be easily distinguished using light and electron microscopy by their location and morphological characteristics (Figs. 3–5), the medullary thin tubular structures showing iNOS immunoreactivity were distinguished by the double immunostaining method with cell-specific markers using the antibody elution method. These results demonstrate that the antibody elution procedure used in the present study enables performance of the secondary round of immunostaining successfully without cross-reactivity and without loss of tissue antigenicity (Fig. 5).
Figure 5.

Semithin sections (1.5 µm thick) from the 8-hr lipopolysaccharide-treated (LPS-t) group kidneys double-immunostained for inducible nitric oxide synthase (iNOS) (brown; A–I) and AQP1 (blue; A,C,D,F,G), AQP2 (blue; B,I), CLC-K (blue; H), and UT-A2 (blue; E). (A) iNOS-positive thin tubular structures (asterisks) were observed in the outer and middle layers of the vascular bundle (descending vasa recta; double arrows). The long-looped descending thin limb (DLT) cells (arrows) were located in the interbundle region. (B) Outer medullary collecting duct cells (stars) and the thick ascending limb (asterisks) were iNOS negative. Arrows indicate iNOS positivity in the thin limb, which continues up to the S3 segment of the proximal tubule (arrowhead). (C–E) The short-looped DTL (asterisks), identified by UT-A2 immunolabeling (arrowheads) in the distal portion, was AQP1 negative and iNOS positive. In the long-looped DTL (stars) of the outer medulla, only a few cells expressed iNOS (arrows). The descending (double arrows) and ascending (open arrows) vasa recta were iNOS negative. (F) iNOS-positive epithelia lining the forniceal area (arrowheads). Below this level, AQP1 positivity was lost, but iNOS immunoreactivity was observed in the shorter long-looped DTL (DTL-L1; stars). (G) Intermittent expression of iNOS (arrows) in the AQP1-positive longer long-looped DTL (DTL-L2; arrowheads) at the upper papillary region. In contrast, most cells expressed iNOS in the AQP1-negative DTL-L1 (star). The descending (double arrows) and ascending vasa recta (open arrows) were iNOS negative. (H) In the ascending thin limb (asterisks), no iNOS was detected. In contrast, iNOS was detected in the two types of DTLs (stars). (I) Some inner medullary collecting duct cells (arrows) coexpressed both AQP2 and iNOS. The arrowhead indicates an AQP2-negative intercalated cell. Scale bars = 50 µm.
The outer medulla, collecting duct, and thick ascending limb were iNOS negative (Fig. 5B). iNOS-positive (AQP1-negative) thin tubular structures were observed in the outer and middle layers of the vascular bundle (descending vasa recta; weak AQP1 positive) (Fig. 5A). These iNOS-positive thin tubular structures were identified as short-looped DTL (DTL-S) by UT-A2 immunolabeling in their distal portion. Almost all of the cells of the proximal part of the DTL-S were iNOS positive. A few cells in the DTL-S coexpressed iNOS and UT-A2 (Fig. 5E). Strongly AQP1-positive long-looped DTL cells were located in the interbundle region (Fig. 5A). In the proximal parts of the long-looped DTL, only a few cells showed weak iNOS reactivity (Fig. 5C). Two subtypes were distinguished in the long-looped DTL following Pannabecker et al. (2004): the shorter long-looped DTL (DTL-L1) and the longer long-looped DTL (DTL-L2). In the upper third portion of the inner medulla, the DTL-L1 was AQP1 negative but iNOS positive (Fig. 5F–H). In the DTL-L2, iNOS was expressed intermittently in the upper and middle papillary regions (Fig. 5G,H).
iNOS-positive collecting duct cells were observed only in the inner medulla, not in either the cortex or outer medulla. In the inner medullary collecting duct, AQP-2-negative intercalated cells were iNOS negative, and iNOS-positive IMCDc were generally scattered singly throughout the inner medulla (Fig. 5I).
The ascending thin limb of Henle’s loop was identified by CLC-K immunostaining (Fig. 5H), and the descending and ascending vasa recta were identified by weak AQP1 positivity and negativity, respectively, and sometimes by red blood cells in their lumen (Fig. 5A,C,D,G). These three thin tubular structures were iNOS negative.
Subcellular Localization of iNOS by NADPH-d Enzyme Histochemistry
Light microscopy showed that the NADPH-d reaction product was intensely deposited in the cortex, moderately in the outer medulla, and weakly in the inner medulla of the control kidneys. In the LPS-t kidneys, no marked differences were observed except that some structures, such as ISc, GPEc, CPEc, and scattered IMCDc, which can all be distinguished by their location and morphological characteristics, showed strong NADPH-d activity.
In the semithin sections, NADPH-d reaction products in the proximal and distal tubules, cortical and outer medullary collecting ducts, and thick ascending limb exhibited punctuate patterns in the cytoplasm (Fig. 6). Electron microscopy revealed that the reaction products were localized to the mitochondria (Fig. 7A–D). In contrast, cytosolic distribution of NADPH-d reaction products was observed in ISc, GPEc, CPEc, and some IMCDc of the LPS-t kidneys (Fig. 7C,E–H). Cytosolic expression was also observed in macula densa cells from both control and LPS-t kidneys (Fig. 7E,F). NADPH-d reaction products were also observed in the endothelial cells and thin tubular cells, but it was difficult to confirm whether the reaction products were localized in the cytosol due to their thin cytoplasmic structures.
Figure 6.

Semithin sections (1.5 µm thick) of NADPH-diaphorase (NADPH-d) enzyme histochemistry for the 8-hr lipopolysaccharide-treated (LPS-t) group kidneys. The reaction particles exhibited punctuated patterns in the cytoplasm of the proximal (PT) and distal (DT) tubules in cortex (A), as well as the collecting ducts (CD) and the thick ascending limb (TAL) in the outer medulla (B). The arrow in A indicates the macula densa. Scale bar = 30 µm.
Figure 7.

Electron micrographs of NADPH-diaphorase (NADPH-d) enzyme histochemistry for the 8-hr lipopolysaccharide-treated (LPS-t) group kidneys. B, D, F, and H are magnification images of the boxed areas in A, C, E, and G, respectively. In the proximal tubular cell (PT) and thick ascending limb cell (TAL), the reaction products were located exclusively in the mitochondria. In the macular densa (MD), glomerular parietal epithelial cells (GPEc), interstitial cells (ISc), and inner medullary collecting duct cells (IMCDc), the reaction products were diffusely distributed in the cytoplasm. Scale bars = 2 µm.
Localization of iNOS-mRNA-producing Cells by In Situ RT-PCR
For in situ RT-PCR, five primer pairs were tested. From conventional RT-PCR using the one-step in situ RT-PCR Quick Master Mix with total RNA samples from 8-hr LPS-t rat kidney, all primer pairs were verified to generate single RT-PCR bands (Fig. 8). However, only two primer pairs showed good in situ RT-PCR reactivity; none of the other pairs functioned with in situ RT-PCR. We used the liver as a control tissue because hepatic and Kupffer cells (hepatic macrophages) are known to express iNOS in response to LPS treatment (Taylor et al. 1998). No iNOS immunoreactivity or in situ signals were detected in control rat liver (data not shown). In contrast, strong iNOS immunoreactivity and in situ signals were found in Kupffer cells; various intensities of iNOS immunoreactivity and in situ signals were observed in hepatic cells from LPS-t rat liver (Fig. 9A,B). In situ RT-PCR signals were detected in the cytoplasm but not in the nucleus of both liver and kidney tissues (Fig. 9). We consider this a validation that our modification of in situ RT-PCR using the one-step RT-PCR kit worked well in vibratome sections. Control kidneys were nearly negative for iNOS in situ RT-PCR. In contrast, iNOS in situ signals were detected in LPS-t kidneys in several cell types: ISc, most but not all GPEc, the DTLs of the short and long loop of Henle, IMCDc, and CPEc (Fig. 9C–F). Most antigenicity was reduced after in situ RT-PCR, especially related to UT-A (Fig. 9D). However, the DTLs of the short and long loop of Henle exhibited an iNOS in situ signal that could be identified using antibodies against AQP1 and UT-A after double immunohistochemistry. No iNOS in situ signal was observed in the proximal and distal tubules, thick ascending limb, or cortical or outer medullary collecting ducts in any experimental group.
Figure 8.
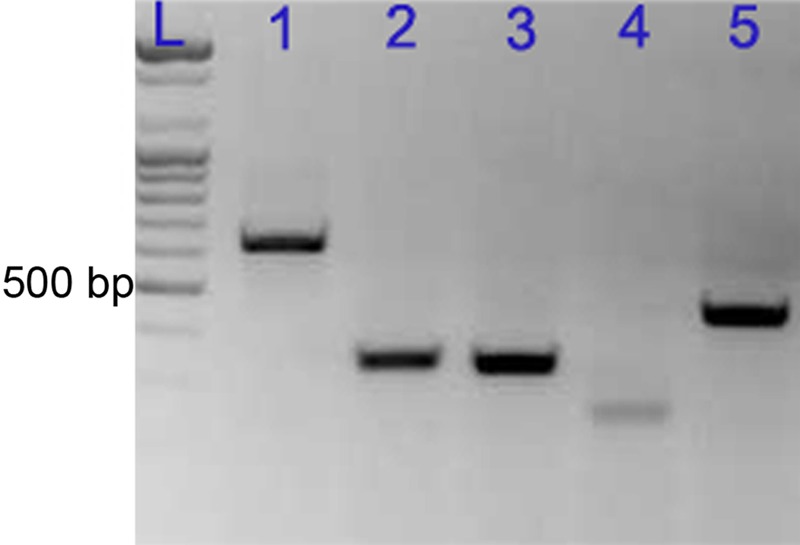
Reverse transcription (RT)–PCR analysis of five inducible nitric oxide synthase (iNOS) primer sets using total RNA from 8-hr lipopolysaccharide-treated (LPS-t) rat kidney. Lanes: L, ladder; 1, 627 bp; 2, 330 bp; 3, 320 bp; 4, 227 bp; 5, 429 bp.
Figure 9.

Vibratome sections (50 µm thick) from 8-hr lipopolysaccharide-treated (LPS-t) rat liver immunostained for inducible nitric oxide synthase (iNOS) (A), as well as semithin sections (1.5 µm thick) performed with iNOS in situ RT-PCR (blue) from the 8-hr LPS-t rat liver (B) and kidney (C–F). (A, B) Note strong iNOS immunoreactivity and in situ signals in Kupffer cells (arrow). Various intensities of iNOS in situ signals are shown in hepatic cells (asterisk). (C) Note the iNOS-positive glomerular parietal epithelial cells (arrows), interstitial cells (open arrows), and the iNOS-negative glomerular tufts. (D) The short looped-descending thin limb showing iNOS in situ signal was identified using UT-A2 immunolabeling in the distal portion. In comparison to Figure 6E, UT-A antigenicity was much reduced, and nonspecific staining was increased (stars). The vasa recta (double arrow) showed no iNOS in situ signal. (E, F) Note the papilla epithelial cells (arrowheads) with iNOS signal. The long-looped DTL (DTL-L) (asterisk) of the inner medulla is identified by AQP1 positivity (brown) Bar = 40 um.
Discussion
The quantitative data in the present study for time-dependent expression of iNOS were very similar to previous reports in LPS-t rat models that administered various serotypes of LPS to Wistar rats (Sade et al. 1999; Lortie et al. 2000; Yamaguchi et al. 2006). The induction of iNOS mRNA was evident as early as 1 hr after LPS injection, continued at a high level at 6 to 8 hr, and then decreased rapidly. Taken together, including our results using two different LPS administered to SD rats, these findings suggest that the induction pattern of iNOS in the LPS-t rat model may be relatively constant regardless of rat strain or LPS type and that induced iNOS protein in the LPS-t rat model may also be consistently localized. However, iNOS localization obtained in the present study from iNOS immunohistochemistry (Fig. 10) differs substantially from both other morphological studies using various experimental conditions and models and those of other reports using the LPS-t rat model (Table 1), in which iNOS was induced in the cortical and/or outer medullary tubules, glomerular mesangial cells, macula densa, GPEc, ISc, CPEc, and/or vascular endothelium.
Figure 10.

Diagram illustrating the cellular localization of inducible nitric oxide synthase (iNOS) in lipopolysaccharide-treated (LPS-t) rat kidneys. Co, Cotex; DTL-L1, shorter long-looped DTL; DTL-L2, longer long-looped DTL; DTL-S, short-looped DTL; IM, inner medulla; ISc, interstitial cells; OMi, inner stripe of outer medulla; OMo, outer stripe of outer medulla.
In immunohistochemical studies, differing results are occasionally obtained due to the type of antibody or immunohistochemical procedure used. This difference is caused by defects in immunohistochemical methods, resulting in false positives and false negatives. Among the five antibodies used in the present study, mouse anti-iNOS2 (610431; BD Transduction Laboratories), in contrast to another mouse monoclonal antibody (610328) from the same company, immunostained the macula densa in both the control and LPS-t groups. We considered the results from this antibody false positives due to incomplete antigen specificity, because the macula densa is known to contain nNOS, not iNOS, especially in control kidneys (Tojo et al. 1994).
In the present study, no iNOS immunoreactivity was detected in the proximal and distal tubules, thick ascending limb, or cortical or outer medullary collecting ducts in any experimental group. The glomerular and intertubular capillary endothelia were also iNOS negative. However, many previous reports, even those using the LPS-t rat model (Table 1), have reported iNOS expression in these areas in control and/or experimental rats, particularly in the cortical tubules. To examine this difference, we tested various steps of the immunohistochemical procedure and found that the antibody dilution may affect the immunohistochemical results. For the antibody purchased from Santa Cruz Biotechnology, the cortical tubules were iNOS immunostained only at a lower antibody dilution (1:100) but not at a higher antibody dilution (1:1000) at which other structures were strongly immunostained, similar to the other four antibodies. However, electron microscopy demonstrated that the immunoreactivities in the cortical tubules were localized mainly in mitochondria. This result is consistent with another report that iNOS staining was mainly distributed in the basal part of the tubular cells where numerous mitochondria are distributed, using the same antibody from Santa Cruz Biotechnology at a lower dilution (Buffoli et al. 2005). Several investigators have reported that mtNOS was detected using the iNOS antibody and was identified as a splice variant of nNOS (Tatoyan and Giulivi 1998; Elfering et al. 2002; Fellet et al. 2006). Therefore, iNOS immunostaining in the mitochondria at lower antibody dilutions, as with immunostaining in the macula densa, may be due to cross-reactivity of the iNOS antibody with nNOS. However, because many investigators have reported iNOS reactivity in the renal glomerulus and/or cortical tubules of various renal injury models, it is possible that the discrepancy between our results and these reports may originate with differences in the renal injuries or from different doses of LPS. For example, we injected sublethal doses of LPS, whereas other groups used lethal doses that may induce a more fulminant inflammatory reaction that could also affect glomerular and cortical tubular cells. We plan to examine the expression pattern of renal iNOS in specific glomerular or tubulointerstitial injury models.
To confirm our immunohistochemical results, we conducted NADPH-d enzyme electron microscopy. In the proximal and distal tubules, cortical and outer medullary collecting ducts, and thick ascending limb of control and LPS-t kidneys, NADPH-d reaction products were found exclusively in mitochondria (not in the cytosol). Because iNOS was localized in the cytosol rather than in mitochondria (Vodovotz et al. 1995), we conclude that formation of the reaction product in mitochondria of these cells may be due either to NOS-unrelated diaphorase activity or mtNOS and that therefore iNOS was not expressed in these tubules. In macula densa cells, ISc, GPEc, CPEc, and some IMCDc of the LPS-t kidneys, cytosolic NADPH-d reaction products were observed. Such products of macula densa cells may be derived from nNOS, whereas those in all of the other cells confirm that iNOS immunostaining in these cells in the present study is truly positive.
To identify iNOS-positive thin tubular structures in the medulla, we used double immunohistochemistry. We were able to identify the thin tubular structures easily by their morphological characteristics, such as epithelial type, relative position, luminal contents, and immunoreactivity against a specific marker (Pannabecker et al. 2004; Zhai et al. 2007). We found that iNOS was expressed in the proximal part of the DTL-S and in a portion of the long-looped DTL but not in the vascular endothelium or the ascending thin limb. In contrast to the present findings, numerous reports have described expression of renal iNOS in the vascular endothelium (Table 1). However, no report has described renal iNOS expression in Henle’s thin loop, except one study that described iNOS immunostaining along with the vasa recta (Buffoli et al. 2005). The thin loop of Henle and the vasa recta are adjacent, and both are morphologically of the simple squamous epithelial type (Zhai et al. 2006). Therefore, we hypothesize that Henle’s thin loop may have been confused with the vasa recta. To our knowledge, no investigations reporting renal iNOS localization to the vascular endothelium have confirmed its expression using additional methods (e.g., double immunohistochemistry).
Constitutive expression of iNOS in normal/control kidneys is also controversial. Some investigators have reported constitutive expression of iNOS in normal/control kidneys, but others have found none. In the present study, only a very small quantity of iNOS mRNA was present in the control kidneys. We suggest that such a small quantity of iNOS mRNA may originate from a very small number of iNOS-immunoreactive ISc in control kidneys. On the basis of the results of the present study, we conclude that iNOS may not be expressed constitutively in any normal renal tubules, corroborated by the lack of detected cytosolic NADPH-d reaction product in control renal tubular cells.
Only two studies have used in situ hybridization to address renal iNOS mRNA localization in septic animal models. However, their results for iNOS mRNA localization differ. Ahn et al. (1994) reported that many tubular structures were labeled in normal rats and that LPS-t rats exhibited a similar labeling pattern but with increased staining of some cells. The results of Holmqvist et al. (2005) and their LPS-t mice model were similar to our results. They reported that no iNOS mRNA labeling was detected in untreated animals and that after LPS administration, strong iNOS mRNA labeling was present in GPEc, cortical and medulla tubules (unidentified), CPEc, and a few putative mesangial cells of the glomeruli. The results of our in situ RT-PCR experiment were consistent with the immunohistochemistry results and verified the results obtained with antibodies.
It is uncertain whether the present results can be directly applied to other experiments using different animal species or experimental/pathological conditions. To date, numerous studies on the role of iNOS in renal injury, including the LPS-t septic model, often have been performed under the hypothesis that iNOS is expressed constitutively or induced in renal tubules or the vascular endothelium (for review, see Heemskerk et al. 2009). We suggest that the validity of this hypothesis may not have been adequately evaluated because iNOS in the ISc and tubular mtNOS can affect tubular function (Kipari et al. 2006; Ghafourifar et al. 1999), and iNOS in GPEc and DTL may have a paracrine effect on juxtaposed vascular structures.
In conclusion, the present study clarified the exact localization of iNOS in LPS-t rat kidneys. These findings provide an important basis for examining the roles of iNOS in the kidney. Identification of the exact site of pathologic processing is of little interest and could be regarded as having little clinical importance, but the ability to evaluate specific cellular sites in pathologic processing could help us better understand the mechanisms of pathogenesis and to evaluate therapeutic modalities. Furthermore, if any new iNOS-blocking drug could have selective specificity for cellular proteins in specific renal cell types, just as diuretics influence specific ion channels, the drug could have high clinical efficacy at a minimal dose of LPS to avoid iNOS tubular damage. Studies on the roles of iNOS induction in the DTL, GPEc, CPEc, and some IMCDc are lacking; thus, further studies are required to evaluate the role of iNOS in renal injury.
Footnotes
The authors declared no potential conflicts of interest with respect to the authorship and/or publication of this article.
The authors disclosed receipt of the following financial support for the research and/or authorship of this article: Financial support provided by the Catholic Medical Center Research Foundation in 2009.
Supplementary material for this article is available on the Journal of Histochemistry & Cytochemistry Web site at http://jhc.sagepub.com/supplemental.
References
- Abdel-latief M, Garbe LA, Koch M, Ruther J. 2008. An epoxide hydrolase involved in the biosynthesis of an insect sex attractant and its use to localize the production site. Proc Natl Acad Sci U S A. 105:8914–8919 [DOI] [PMC free article] [PubMed] [Google Scholar]
- Ahn KY, Mohaupt MG, Madsen KM, Kone BC. 1994. In situ hybridization localization of mRNA encoding inducible nitric oxide synthase in rat kidney. Am J Physiol. 267:F748-F757 [DOI] [PubMed] [Google Scholar]
- Bates TE, Loesch A, Burnstock G, Clark JB. 1996. Mitochondrial nitric oxide synthase: a ubiquitous regulator of oxidative phosphorylation? Biochem Biophys Res Commun. 218:40–44 [DOI] [PubMed] [Google Scholar]
- Buffoli B, Pechánová O, Kojsová S, Andriantsitohaina R, Giugno L, Bianchi R, Rezzani R. 2005. Provinol prevents CsA-induced nephrotoxicity by reducing reactive oxygen species, iNOS, and NF-κB expression. J Histochem Cytochem. 53:1459–1468 [DOI] [PMC free article] [PubMed] [Google Scholar]
- Cha JH, Woo SK, Han KH, Kim YH, Handler JS, Kim J, Kwon HM. 2001. Hydration status affects nuclear distribution of transcription factor tonicity responsive enhancer binding protein in rat kidney. J Am Soc Nephrol. 12:2221–2230 [DOI] [PubMed] [Google Scholar]
- Doi K, Leelahavanichkul A, Yuen PS, Star RA. 2009. Animal models of sepsis and sepsis-induced kidney injury. J Clin Invest. 119:2868–2878 [DOI] [PMC free article] [PubMed] [Google Scholar]
- Elfering SL, Sarkela TM, Giulivi C. 2002. Biochemistry of mitochondrial nitric-oxide synthase. J Biol Chem. 277:38079–38086 [DOI] [PubMed] [Google Scholar]
- Fellet AL, Balaszczuk AM, Arranz C, López-Costa JJ, Boveris A, Bustamante J. 2006. Autonomic regulation of pacemaker activity: role of heart nitric oxide synthases. Am J Physiol Heart Circ Physiol. 291:H1246–H1254 [DOI] [PubMed] [Google Scholar]
- Forstermann U, Closs EI, Pollock JS, Nakane M, Schwarz P, Gath I, Kleinert H. 1994. Nitric oxide synthase isozymes characterization, purification, molecular cloning, and functions. Hypertension. 23:1121–1131 [DOI] [PubMed] [Google Scholar]
- Fujihara CK, Mattar AL, Vieira JM, Jr, Malheiros DMAC, Noronha IDL, Goncalves ARR, Nucci GD, Zatz R. 2002. Evidence for the existence of two distinct functions for the inducible NO synthase in the rat kidney: effect of aminoguanidine in rats with 5/6 ablation. J Am Soc Nephrol. 13:2278–2287 [DOI] [PubMed] [Google Scholar]
- Gabbott PL, Bacon SJ. 1993. Histochemical localization of NADPH-dependent diaphorase (nitric oxide synthase) activity in vascular endothelial cells in the rat brain. Neuroscience. 57:79–95 [DOI] [PubMed] [Google Scholar]
- Ghafourifar P, Richter C. 1997. Nitric oxide synthase activity in mitochondria. FEBS Lett. 418:291–296 [DOI] [PubMed] [Google Scholar]
- Ghafourifar P, Schenk U, Klein SD, Richter C. 1999. Mitochondrial nitric-oxide synthase stimulation causes cytochrome c release from isolated mitochondria: evidence for intramitochondrial peroxynitrite formation. J Biol Chem. 274:31185–1188 [DOI] [PubMed] [Google Scholar]
- Heemskerk S, Masereeuw R, Russel FGM, Pickkers P. 2009. Selective iNOS inhibition for the treatment of sepsis-induced acute kidney injury. Nat Rev Nephrol. 5:629–640 [DOI] [PubMed] [Google Scholar]
- Holmqvist B, Olsson CF, Svensson M-L, Svanborg C, Forsell J, Alm P. 2005. Expression of nitric oxide synthase isoforms in the mouse kidney: cellular localization and influence by lipopolysaccharide and Toll-like receptor 4. J Mol Hist. 36:499–516 [DOI] [PubMed] [Google Scholar]
- Hope BT, Michael GJ, Knigge KM, Vincent SR. 1991. Neuronal NADPH diaphorase is a nitric oxide synthase. Proc Natl Acad Sci U S A. 88:2811–2814 [DOI] [PMC free article] [PubMed] [Google Scholar]
- Johnson RA, Freeman RH. 1994. Renin release in rats during blockade of nitric oxide synthesis. Am J Physiol. 266: R1723–R1729 [DOI] [PubMed] [Google Scholar]
- Kipari T, Cailhier JF, Ferenbach D, Watson S, Houlberg K, Walbaum D, Clay S, Savill J, Hughes J. 2006. Nitric oxide is an important mediator of renal tubular epithelial cell death in vitro and in murine experimental hydronephrosis. Am J Pathol. 169:388–399 [DOI] [PMC free article] [PubMed] [Google Scholar]
- Lan HY, Mu W, Nikolic-Paterson DJ, Atkins RC. 1995. A novel, simple, reliable, and sensitive method for multiple immunoenzyme staining: use of microwave oven heating to block antibody crossreactivity and retrieve antigens. J Histochem Cytochem. 43:97–102 [DOI] [PubMed] [Google Scholar]
- Lancaster JR., Jr. 1994. Simulation of the diffusion and reaction of endogenously produced nitric oxide. Proc Natl Acad Sci U S A. 91:8137–8141 [DOI] [PMC free article] [PubMed] [Google Scholar]
- Lau KS, Nakashima O, Aalund GR, Hogarth L, Ujiie K, Yuen J, Star RA. 1995. TNF-alpha and IFN-gamma induce expression of nitric oxide synthase in cultured rat medullary interstitial cells. Am J Physiol. 269:F212-F217 [DOI] [PubMed] [Google Scholar]
- Lortie MJ, Ishizuka S, Schwartz D, Blantz RC. 2000. Bioactive products of arginine in sepsis: tissue and plasma composition after LPS and iNOS blockade. Am J Physiol Cell Physiol. 278:C1191–C1199 [DOI] [PubMed] [Google Scholar]
- Madsen KM, Zhang L, Shamat A-RA, Siegfried S, Cha JH. 1997. Ultrastructural localization of osteopontin in the kidney: induction by lipopolysaccharide. J Am Soc Nephrol. 8:1043–1053 [DOI] [PubMed] [Google Scholar]
- Meyer-Schwesinger C, Dehde S, von Ruffer C, Gatzemeier S, Klug P, Wenzel UO, Stahl RAK, Thaiss F, Meyer TN. 2009. Rho kinase inhibition attenuates LPS-induced renal failure in mice in part by attenuation of NF-κB p65 signaling. Am J Physiol Renal Physiol. 296:F1088–F1099 [DOI] [PubMed] [Google Scholar]
- Pannabecker TL, Abbott DE, Dantzler WH. 2004. Three-dimensional functional reconstruction of inner medullary thin limbs of Henle’s loop. Am J Physiol Renal Physiol. 286:F38–F45 [DOI] [PubMed] [Google Scholar]
- Qi X, Guy J. 1996. Localization of NADPH diaphorase/nitric oxide synthase in the optic nerve of the normal guinea pig: a light and electron microscopic study. J Comp Neurol. 370:396–404 [DOI] [PubMed] [Google Scholar]
- Sade K, Schwartz D, Wolman Y, Schwartz I, Chernichovski T, Blum M, Brazowski E, Keynan S, Raz I, Blantz RC, et al. 1999. Time course of lipopolysaccharide-induced nitric oxide synthase mRNA expression in rat glomeruli. J Lab Clin Med. 134:471–477 [DOI] [PubMed] [Google Scholar]
- Sato M, Nakakura T, Ogushi Y, Akabane G, Kurabuchi S, Suzuki M, Tanaka S. 2011. Expression of a mammalian aquaporin 3 homolog in the anterior pituitary gonadotrophs of the tree frog, Hyla japonica. Cell Tissue Res. 343:595–603 [DOI] [PubMed] [Google Scholar]
- Schrier RW, Wang W. 2004. Acute renal failure and sepsis. N Engl J Med. 351:159–169 [DOI] [PubMed] [Google Scholar]
- Spessert R, Claassen M. 1998. Histochemical differentiation between nitric oxide synthase–related and –unrelated diaphorase activity in the rat olfactory bulb. Histochem J. 30:41–50 [DOI] [PubMed] [Google Scholar]
- Spessert R, Layes E. 1994. Fixation conditions affect the intensity but not the pattern of NADPH-diaphorase staining as a marker for neuronal nitric oxide synthase in rat olfactory bulb. J Histochem Cytochem. 42:1309–1315 [DOI] [PubMed] [Google Scholar]
- Tatoyan A, Giulivi C. 1998. Purification and characterization of a nitric-oxide synthase from rat liver mitochondria. J Biol Chem. 273:11044–11048 [DOI] [PubMed] [Google Scholar]
- Taylor BS, Alarcon LH, Billiar TR. 1998. Inducible nitric oxide synthase in the liver: regulation and function. Biochemistry (Mosc). 63:766–781 [PubMed] [Google Scholar]
- Tojo A, Gross SS, Zhang L, Tisher CC, Schmidt HH, Wilcox CS, Madsen KM. 1994. Immunocytochemical localization of distinct isoforms of nitric oxide synthase in the juxtaglomerular apparatus of normal rat kidney. J Am Soc Nephrol. 4:1438–1447 [DOI] [PubMed] [Google Scholar]
- Tracey WR, Nakane M, Pollock JS, Förstermann U. 1993. Nitric oxide synthases in neuronal cells, macrophages and endothelium are NADPH diaphorases, but represent only a fraction of total cellular NADPH diaphorase activity. Biochem Biophys Res Commun. 195:1035–1040 [DOI] [PubMed] [Google Scholar]
- Uckert S, Stanarius A, Stief CG, Wolf G, Jonas U, Machtens S. 2003. Immunocytochemical distribution of nitric oxide synthase in the human seminal vesicle: a light and electron microscopical study. Urol Res. 31:262–266 [DOI] [PubMed] [Google Scholar]
- Vodovotz Y, Russell D, Xie QW, Bogdan C, Nathan C. 1995. Vesicle membrane association of nitric oxide synthase in primary mouse macrophages. J Immunol. 154:2914–2925 [PubMed] [Google Scholar]
- Wolkow PP. 1998. Involvement and dual effects of nitric oxide in septic shock. Inflamm Res. 47:152–166 [DOI] [PubMed] [Google Scholar]
- Yamaguchi N, Jesmin S, Zaedi S, Shimojo N, Maeda S, Gando S, Koyama A, Miyauchi T. 2006. Time-dependent expression of renal vaso-regulatory molecules in LPS-induced endotoxemia in rat. Peptides. 27:2258–2270 [DOI] [PubMed] [Google Scholar]
- Young HM, Furness JB, Shuttleworth CW, Bredt DS, Snyder SH. 1992. Co-localization of nitric oxide synthase immunoreactivity and NADPH diaphorase staining in neurons of the guineapig intestine. Histochemistry. 97:375–378 [DOI] [PubMed] [Google Scholar]
- Zhai X-Y, Fenton RA, Andreasen A, Thomsen JS, Christensen EI. 2007. Aquaporin-1 is not expressed in descending thin limbs of short-loop nephrons. J Am Soc Nephrol. 18:2937–2944 [DOI] [PubMed] [Google Scholar]
- Zhai X-Y, Thomsen JS, Birn H, Kristoffersen IB, Andreasen A, Christensen EI. 2006. Three-dimensional reconstruction of the mouse nephron. J Am Soc Nephrol. 17:77–88 [DOI] [PubMed] [Google Scholar]