

Abstract
There is need for a valid and reliable biomarker for HIV Associated Neurocognitive Disorder (HAND). The purpose of the present study was to provide preliminary evidence of the potential utility of neuronal functional connectivity measures obtained using magnetoencephalography (MEG) to identify HIV-associated changes in brain function. Resting state, eyes closed, MEG data from 10 HIV-infected individuals and 8 seronegative controls were analyzed using mutual information (MI) between all pairs of MEG sensors to determine whether there were functional brain networks that distinguished between subject groups based on cognition (global and learning) or on serostatus.
Three networks were identified across all subjects, but after permutation testing (at α < .005) only the one related to HIV serostatus was significant. The network included MEG sensors (planar gradiometers) above the right anterior region connecting to sensors above the left posterior region. A mean MI value was calculated across all connections from the anterior to the posterior groupings; that score distinguished between the serostatus groups with only one error (sensitivity = 1.00, specificity = .88 (X2 = 15.4, df = 1, p < .01, Relative Risk = .11). There were no significant associations between the MI value and the neuropsychological Global Impairment rating, substance abuse, mood disorder, age, education, CD4+ cell counts or HIV viral load.
We conclude that using a measure of functional connectivity, it may be possible to distinguish between HIV-infected and uninfected individuals, suggesting that MEG may have the potential to serve as a sensitive, non-invasive biomarker for HAND.
Keywords: HIV Disease, Cognition, Magnetoencephalography, Functional Connectivity
Introduction
HIV-Associated Neurocognitive Disorder (HAND) affects the management, survival, and quality of life of affected patients and their families (Bridge 1988). Although the incidence of HIV-associated dementia (HAD) is falling, the prevalence of the milder forms of HIV-related cognitive disorders, such as Mild Neurocognitive Disorder (MNCD) is rising (Sacktor et al. 2001; Sacktor et al. 2002; Cysique et al. 2004). One major weakness in the field of NeuroAIDS is the lack of a useful neuroimaging biomarker for HAD and MNCD (Antinori et al. 2005); these are clinical syndromes, and laboratory tests and standard clinical neuroimaging are used largely to exclude alternative causes rather than directly establishing a diagnosis (Navia and Rostasy 2005). A biomarker would also be important to determine whether the CNS processes are pathologically active (for example, as found by magnetic resonance spectroscopy (Chang et al. 2003; Chang et al. 2004b; Paul et al. 2007)) prior to clinical onset (i.e., Asymptomatic Neurocognitive Impairment). Further, because the effectiveness of treatment on CNS structure/function is sometimes uncertain, a biomarker that more objectively assesses treatment outcomes is needed (See Price, et al. (Price et al. 2007), for a review).
One technology that has not been applied to HIV disease is magnetoencephalography (MEG), a non-invasive technique for monitoring neuronal activity in the brain that is based on recording magnetic fields induced by synchronized intracellular currents in populations of neurons. Under ideal conditions, MEG can measure the activity of synchronously firing neurons with a spatial resolution of a few millimeters and a submillisecond temporal resolution. Thus, MEG provides “a more direct index of sensory, motor, and cognitive task-specific activation compared with methods that rely on hemodynamic measures” ((Papanicolaou et al. 2004), page 869).
The high temporal resolution of MEG allows fine-grained analysis of functional connectivity through the measurement of the dynamics of the oscillatory activity, and establishing the functional interaction between brain regions in specific frequency bands (e.g., (Stam et al. 2006)). The statistical correlation between any two magnetic time series can be measured through linear and nonlinear methods including spectral coherence, phase synchronization, or generalized synchronization. Long-range synchronization between signals originating in relatively distant neuronal populations is one potential mechanism for communication and integration of information in the brain (Varela et al. 2001; Fries 2005; Engel et al. 2001). Studies of elderly individuals with mild cognitive impairment have shown that alterations in functional connectivity precede the development of clinical dementia and are related to the time to develop dementia (Bajo et al. 2011; Bajo et al. 2010). The purpose of this pilot study is to analyze MEG data from a group of patients with HIV disease and risk-group appropriate controls to determine the extent to which measures of functional connectivity could serve as a useful CNS biomarker of HIV infection.
Methods
Subjects
10 HIV-infected and 8 seronegative controls participated in this research. All subjects were 40-65 years old, and all but one of the participants was male. The risks for HIV infection included having unprotected sex with men (among the men only) and using illicit injection drugs. Were not able to confirm infection with Hepatitis C in these subjects. This sample of convenience was drawn from existing, ongoing studies of HIV Disease, cognition and the brain.
All of the subjects were right-handed (Oldfield 1971), and native English speakers. None had histories of ADD/ADHD or other developmental disabilities (by self report). The subjects did not have active drug/alcohol abuse or dependence, current major depression, or a history of neurological disease, CNS Opportunistic Infections, CNS tumors, or clinical stroke. There were no significant differences between the groups in terms of age, education, or estimated reading skill (grade level equivalent). With the exception of executive functions, there were no differences between groups in terms of the Domain Impairment ratings (See Table 1).
Table 1.
Characteristics of Study Participants as a Function of Serostatus (Mean ± S.D.)
| Seronegative | Seropositive | Statistics1 | |
|---|---|---|---|
| Number | 8 | 10 | |
| Age | 53.0 (6.5) | 50.5 (4.8) | .96, .23 |
| Education | 14.4 (1.7) | 14.4 (2.0) | −.34, .08 |
| CD4+ Cell Count | n/a | 776.0 (268) | n/a |
| Viral Load (log10) | n/a | 583.4 (1297) | n/a |
| Mood Disorder2 | 75 (6) | 6 (50) | .09, −.07 |
|
Substance Abuse
Disorder 2 |
75 (6) | 5 (50) | .54, −.17 |
|
Grade Level
Reading 2 |
12.4 (1.3) | 11.6 (2.3) | .85, .20 |
| Cognitive Functions | |||
| Executive | 1.56 (1.0) | 2.90 (1.4) | −2.4, .50* |
| Fluency | 2.25 (1.3) | 2.80 (1.5) | −.90, .21 |
| Attention | 1.50 (.53) | 1.80 (.63) | −.91, .22 |
| Speed | 1.88 (1.1) | 2.90 (2.2) | −1.2, .29 |
| Learning | 3.00 (3.6) | 3.40 (2.7) | .18, .04 |
| Memory | 3.00 (3.5) | 4.10 (2.6) | −.31, .08 |
| Motor | 1.13 (.44) | 2.10 (2.1) | −1.2, .28 |
| Spatial | 1.13 (.71) | 2.20 (1.8) | −1.3, .31 |
| Global | 3.38 (3.4) | 4.20 (2.3) | −.15, .04 |
|
Global Impairment
N(%) Abnormal |
50 (4) | 60 (6) | .46, .16 |
|
Learning
Impairment N(%) Abnormal |
38 (3) | 40 (4) | .09, .07 |
All of the HIV-infected patients were on combination anti-retroviral therapy at the time of the study. Only one had a current CD4+ cell count of less than 500 (spec., 422). With one exception (spec., 3520 copies), all of these participants had current viral loads less than 300 (and 4 were undetectable).
Procedures
Neuropsychological Studies
A detailed neuropsychological examination was completed at study entry and after 24 weeks. The evaluation included measures from multiple cognitive domains including Memory, Language, Visual-Construction, Psychomotor Speed, Motor and Executive functions, and provided the necessary information to complete the diagnostic adjudication using the HAND Consensus Diagnostic criteria (Antinori et al. 2007). These scores ranged from Normal [1-3], through Borderline [4], to five grades of impaired performance [5-9].
Psychosocial Evaluation
Each participant underwent a semi-structured diagnostic interview, and completed questionnaires concerning psychiatric symptomatology. The components of the evaluation were: i) a modified Structured Clinical Interview for DSM-III-R (Spitzer et al. 1990); ii) the Brief Symptom Inventory (Derogatis and Spencer 1982) and the Neuropsychiatric Inventory (Cummings et al. 1994) to assess subclinical psychiatric symptoms, and iii) Heaton’s Patient Assessment of Own Functioning questionnaire (Heaton and Pendelton 1981) and the Modified Instrumental Activities of Daily Living scale (Lawton and Brody 1969) to provide information about the specific symptoms of cognitive decline, and their impact on activities of daily living. For the purpose of this pilot study, these data were used only as part of the process of determining the presence of HAND and relevant comorbidities.
Structural MR Study
Each subject had an MRI exam of the brain for use with the MEG data, and for an analysis of brain structural integrity. The scans were completed on a Siemens 3T TIM Trio using a protocol that was modified from that of the Alzheimer’s Disease Neuroimaging Initiative (Mueller et al. 2005). The sagittal Magnetization Prepared Rapid Acquisition Gradient Echo (MP-RAGE) sequence was: FOV = 256 mm; slices = 160; TR = 2300 ms; TE = 2.91 ms; TI = 900 ms; Flip angle = 9 degrees; slice thickness = 1.2 mm.
MEG Data collection
The Elekta Neuromag® (Elekta Oy, Helsinki, Finland) MEG system was used for all MEG recordings. The system has 102 magnetometers and 204 planar gradiometers in a helmet-shaped array covering the entire scalp. The magnetometers measure the overall magnitude of the magnetic field component approximately normal to the head surface; the gradiometers measure the difference of that field component at two adjacent locations. Eye movements were monitored by simultaneously recording an electrooculogram. The MEG sensor unit, the floor-mounted gantry, the movable subject chair, together with the patient audio-visual monitoring and stimulus delivery systems, were all contained in a magnetically shielded room (Imedco AG, Hägendorf, Switzerland).
The participants were seated with their head in the MEG sensor helmet that covered the entire head except the face. Four head position indicator coils (HPI) were placed on the scalp, appropriately spaced in the region covered by the MEG helmet. The locations of the nasion, two preauricular points, and the four HPI coils were digitized prior to each MEG study using a 3D-digitizer (ISOTRAK; Polhemus, Inc., Colchester, VT) to define the subject-specific Cartesian head coordinate system. An additional 30-50 anatomical points were digitized on the head surface to provide for a more accurate co-registration of the MEG data with the reconstructed volumetric MR image. Once a subject was comfortably positioned in the MEG machine, short electrical signals were sent to the HPI coils to localize them with respect to the MEG sensor array. The data from the HPI coils were used to correct for within-session head movement by each study participant.
MEG data were acquired at a sampling rate of 1 kHz, with on-line filtering of 0.10 - 330 Hz. Acquisition occurred in a single session comprising two runs separated by approximately a 10-minute break. The first run included two memory tasks, while the second run included the same two memory tasks, as well as 10 minutes of “resting state” data; 5 minutes with eyes open followed by 5 minutes with eyes closed. Only the resting state data were analyzed for this report, and because “global” artifacts such as eye blinks easily confound many of the functional connectivity measures, only the eyes-closed data were used.
MEG Connectivity Analysis
All of the MEG data were de-identified and sent to the Laboratory of Cognitive and Computational Neuroscience, and Center for Biomedical Technology at the Complutense and Technical Universities of Madrid (RB, PC, FM) for connectivity analysis. The neuropsychological Domain scores and the Global Impairment Rating were dichotomized as Normal/Borderline vs. Impaired (See Woods and colleagues (Woods et al. 2004) for details). The binary scores for the Learning Domain and for Global Impairment, as well as a variable indicating subject serostatus were renamed (e.g., VAR001) and also sent to the team in Madrid. The MI analysis was tested relative to each of these three grouping variables (500 permutations each, see below); the data analysts were unaware of the meaning of the three classification variables (i.e., blind analysis).
The MEG data were visually inspected by an experienced investigator (RB) prior to analysis. Traces with artifacts due to eye movements or muscular artifacts were rejected before computing the connectivity analysis. We calculated Mutual Information (MI) using in-house Fortran code was used to implement the MI algorithm as described by Hlaváčá-Schindler and colleagues (Hlaváčá-Schindler et al. 2007). The MI calculations were done separately for the 102 magnetometers units and the two sets of 102 gradiometers units. This gave us three symmetric and weighted correlation matrices of 102 ×102 elements per analysis. The values in the matrix ranged from ~0.05 to ~0.50. Because the MI values were always greater than zero, there was some degree of dependence between all the nodes. The initial analysis was run with all sensors, but we report here only the results from the planar gradiometers.
To compare the MI between the 2 groups, a Kruskal-Wallis test was calculated for each channel pair. Nonparametric permutation tests (M. D. Ernst 2004; Nichols and Holmes 2002; Holmes et al. 1996) were used to find those channel pairs with significant differences between groups. This was done by randomly dividing the 18 participants into 2 groups to match the size of the original groups (based on the cognitive and serostatus classification variables). Then we repeated the two-sample Kruskal-Wallis test between these two new groups for each channel pair. This was repeated 500 times and the p value from each test for each channel pair was retained in order to obtain a distribution of p values for each channel pair. We then identified the 5th percentile of each distribution, and only the p values below that threshold were accepted.
Results
The connectivity analyses using the binary scores for Learning Domain and Global Impairment variables as grouping factors were only significant at p < .05, and therefore were not considered reliable. By contrast, the solution using the serostatus variable was significant at p < .005 (using 500 permutations to establish the null distribution). Figure 1 shows the pairs of sensors that showed significant (i.e., below the 5th percentile of the distribution) MI and that distinguished the seropositive from the seronegative subjects.
Figure 1.
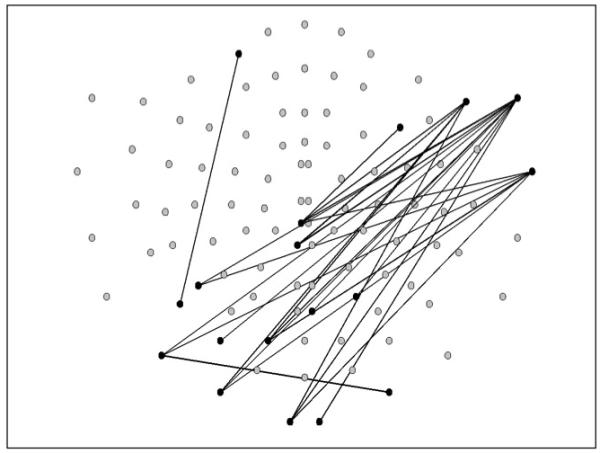
The pairs of sensors that showed significant Mutual Information (i.e., below the 5th percentile of the distribution) that distinguished the seropositive from the seronegative subjects. The top of the sensor map is the front of the head, and the right side of the map corresponds to the right side of the head.
We computed a variable that reflected the extent of the MI in each individual subject by selecting the two groups of gradiometers where we found significant statistical differences (See Figure 2a). We calculated the mean MI between each of the three sensors in the right anterior region, and each of the five sensors in the left posterior region. This mean MI value was able to distinguish between the two subject groups at a cut-off value of 0.075 with only one error, yielding a sensitivity of 1.00 and a specificity of .88 (See Figure 2b) (X2 = 15.4, df = 1, p < .01, Relative Risk = .11 (95% confidence interval .02 - .71)(See Figures 2b and 3). With the exception of the Executive Domain Rating (t(17)= −2.31, p=.03), there were no significant associations between the mean MI value and any of the cognitive Domain ratings, the Global Impairment rating, or a history of substance abuse or mood disorder (See Table 2). There was no significant association between the MI value and the current CD4+ cell count (r = -.11) or log10 viral load (r = − .11) among the HIV-infected subjects.
Figure 2.
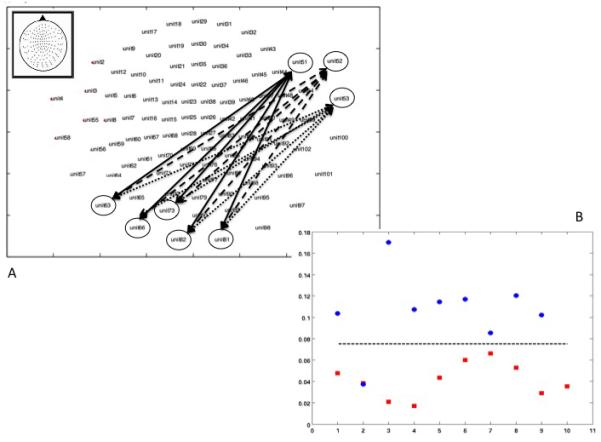
The upper graphic (A) shows the map of the pairs of sensors that were used to create the Mutual Information score. The lower graphic (B) shows the Mutual Information scores for each individual participant as a function of serostatus (red=HIV+, blue=HIV-).
Figure 3.
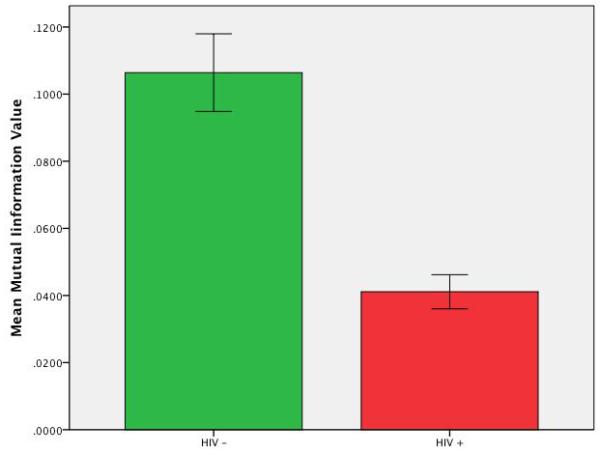
The mean Mutual Information score for the HIV-infected subjects and the seronegative controls (+ 1 s.d. unit).
Table 2.
Characteristics of Study Participants as a Function of MI Classification (Mean ± S.D.)
| MI Group 1 | MI Group 2 | Statistics1 | |
|---|---|---|---|
| Number | 8 | 11 | |
| Mean MI Value | .115 (.02) | .040 (.02) | 8.1, .89 ** |
| Age | 53.5 (6.7) | 50.4 (4.6) | 1.2, .28 |
| Education | 13.9 (1.6) | 14.6 (2.0) | −.78, .19 |
| Mood Disorder 2 | 5 (63) | 7 (63) | .003, .012 |
|
Substance Abuse
Disorder 2 |
6 (75) | 5 (46) | 1.66, −.30 |
| HIV Seropositive 3 | 0 (0) | 91 (10) | 15.4, .90 ** |
|
Grade Level
Reading |
12.3 (1.4) | 11.7 (2.2) | .63, .15 |
| Cognitive Functions | |||
| Executive | 1.50 (1.1) | 2.82 (1.3) | −2.31, .48* |
| Fluency | 2.38 (1.3) | 2.64 (1.5) | −.40, .10 |
| Attention | 1.50 (.54) | 1.82 (.60) | −1.19, .28 |
| Speed | 2.00 (1.1) | 2.73 (2.2) | −.86, .20 |
| Learning | 4.00 (3.7) | 3.18 (2.7) | .11, .14 |
| Memory | 4.00 (3.6) | 3.82 (2.6) | .13, .03 |
| Motor | 1.25 (.46) | 2.00 (2.1) | −1.00, .24 |
| Spatial | 1.38 (.74) | 2.09 (1.8) | −1.01, .25 |
| Global | 4.38 (3.5) | 3.91 (2.4) | .35, .08 |
| Global Impairment | 38 (3) | 36 (4) | .003, −.01 |
t and r, or X2 and Phi for serostatus, and impairment
N (%) meeting criteria for history of disorder
N (%) HIV infected
p < .05
p < .001
Discussion
Brain function is commonly studied from the standpoint of functional segregation or specialization by localizing cognitive functions in specific brain regions (see (Friston 1994; Friston et al. 1993; Buechel and Friston 1997) for discussion). However, advanced statistical analysis techniques allow us to study the relationships among brain regions and how they affect behavior (McIntosh et al. 1994); that is, functional integration studied with functional connectivity (Herbster et al. 1996), typically defined as a statistical interdependence between neurophysiological data that are recorded simultaneously from several brain regions.
Our data show that alterations in functional connectivity as revealed by the mean MI values distinguish between HIV infected patients and uninfected controls. This measure of MI was unrelated to measures of cognitive function (except executive function), mood state or measures of clinical status. One hypothesis arising from these data is that the altered connectivity reflects HIV-related functional and possibly structural changes in the brain that occurred during the time when viral replication was not well controlled. This hypothesis is consistent with our prior observation that neuropsychological test performance is related to the time since infection, independent of age (e.g., (Becker et al. 2011)). This idea is also supported by our failing to find a link between the MI value and current CD4+ cell counts or viral load; we did not have nadir CD4+ or peak viral load data available for analysis.
An alternative hypothesis is that our observations reflect the effects of a chronic, low-grade process related to HIV infection that persists even in the presence of good virological control (Chang et al. 2003; Chang et al. 2004a; Chang et al. 2002; T. Ernst et al. 2002). In a future study, this hypothesis could be tested by examining metabolic markers such as n-acetyl aspartame and myoinositol, reflecting neuronal integrity and glial activity, using magnetic resonance spectroscopy and correlating the levels of these markers with the MI values obtained with MEG.
Another way to distinguish between these two hypotheses would be to study patients during the acute recovery from HAD using HAART. We would predict that during the time that the patients had HAD, they would show the abnormal MI level. To the extent that the altered connectivity reflects the effects of the initial insult, then we would predict recovery of function with therapy to be accompanied by recovery of the MI value to normal levels. This would follow because the time of uncontrolled viral replication would be relatively short. On the other hand, to the extent that there is an ongoing, chronic, low-grade process secondary to the infection, then we would predict that the MI levels would not recover to normal, as these processes would be unaffected by HAART.
A recent study by Wang and colleagues (Wang et al. 2011) is directly relevant to our results. They identified eight functional networks during eyes-open rest using an independent components analysis of whole brain BOLD images. Of these networks, they found that one involving the lateral occipital cortex was under-expressed in their HIV-infected subjects (n=15) compared to the uninfected controls (n=15). Perhaps most interesting was that they found that the locus of the difference was in the left inferior parietal cortex within the LOC network, which would generally correspond to the posterior regions that we found with our analysis. These results complement our findings - we report a long distance functional abnormality between right anterior and left posterior sensors, and Wang and colleagues report a local functional abnormality in the left posterior region (see their Figure 2C). One critical implication of their data is the importance of moving our MI analysis into source space, and directly comparing those findings to BOLD fMRI, while building further on the superior temporal resolution of MEG.
One strength of our study is that we did not specific a priori a specific network to be evaluated. That is, we allowed the data to tell us whether or not it was possible to differentiate the groups of patients based on a pattern of functional connectivity rather than testing whether a specific network was altered in the patient groups. This has the advantage of not restricting the network that might be identified (much like brain-wide, voxel-level analyses permit the identification of unexpected patterns of brain atrophy). However, one potential weakness of this analytic strategy is that we necessarily completed a very large number of comparisons to calculate the MI maps. We took several steps to minimize the effects of multiple comparisons and the risk of Type I error. First, we used the non-parametric Kruskal-Wallis test, which is reliable and relatively conservative. Second, we employed permutation analysis at the subject level; we tested whether the between-group differences found in the data were significantly larger than those in the random permutations along the spatial/temporal axis. This analysis creates new distributions of the subject’s sensor space data to evaluate whether the differences obtained by the original distribution are stronger than those obtained by the 500 artificial ones. We obtained a Monte Carlo p-value that takes into account the p-values obtained from the 500 permutations. Third, we chose a conservative significance threshold (α=.005) for accepting a network as reliable. Finally, we emphasize that the MI analysis was done blind - the investigators in Madrid received only binary codes (i.e., 0/1) with non-informative names (e.g., VAR001).
This is a small-scale, cross-sectional, observational study with all of the attendant limitations. We could not, for example, disentangle the (potentially) independent relationships among the MI score, HIV serostatus and executive system functions because there were no HIV+ participants with high MI scores. However, when we did an exploratory analysis by regressing the MI score on serostatus and executive function domain score, and only serostatus was significantly linked to MI. Further, all of our HIV+ participants were healthy, with all but one showing little (or undetectable) viral replication, with CD4+ cell counts generally >500. They had all been infected (and treated) for more than 10 years, so we could not evaluate the impact of early therapy on the MEG data. In addition, because these analyses were conducted in sensor space, we did not take advantage of the spatial resolution of the MEG data. Clearly, future studies will need to include analyses in source (i.e., brain) space, in order to directly compare/contrast functional and structural changes secondary to HIV disease. However, while these questions are important and need to be addressed, they were beyond the restricted scope of the current project.
Our data are nonetheless provocative in that they offer the possibility that MEG may be able to reveal HIV-associated alterations in brain function that have not been detected to date with other neuroimaging methods. We have previously shown that MEG data are stable over six months (Becker, et al., Under Editorial Review), and that it may be possible to disentangle HIV-related effects from those related to cognitive functions based on differences in relative power across frequency bands. Thus, MEG may become a useful addition to clinical trials. However, before that can be fully assessed, it will be necessary to first gather additional data from a larger group of subjects, including more women, with a wider range of cognitive performance, and a greater variability in virological and immunological control.
Acknowledgements
This work was supported in part by funds from the National Institute of Mental Health (R03-MH081721). The sponsor had no role in the design, analysis or interpretation of this study. The authors are grateful to D. Martineck, A. Schubert and L. Teverovsky for their assistance with this research.
References
- Antinori A, Arendt G, Becker JT, Brew BJ, Byrd DA, Cherner M, et al. Updated research nosology for HIV-associated neurocognitive disorders. Neurology. 2007;69(18):1789–1799. doi: 10.1212/01.WNL.0000287431.88658.8b. [DOI] [PMC free article] [PubMed] [Google Scholar]
- Antinori A, Arendt G, Becker JT, Brew BJ, Byrd DA, Clifford DB, et al. Biomarkers of HIV-associated neurocognitive disorders; Presented at the Conference: HIV Infection and the Central Nervous System: Developed and Resource limited Settings; Frascati (Rome), Italy. June 11 - 13, 2005.2005. [Google Scholar]
- Bajo R, Castellanos NP, Lopez ME, Ruiz JM, Montejo P, Montenegro M, et al. Early dysfunction of functional connectivity in healthy elderly with subjective memory complaints. Age (Dordr) 2011 doi: 10.1007/s11357-011-9241-5. doi:10.1007/s11357-011-9241-5. [DOI] [PMC free article] [PubMed] [Google Scholar]
- Bajo R, Maestu F, Nevado A, Sancho M, Gutierrez R, Campo P, et al. Functional connectivity in mild cognitive impairment during a memory task: implications for the disconnection hypothesis. J Alzheimers Dis. 2010;22(1):183–193. doi: 10.3233/JAD-2010-100177. [DOI] [PubMed] [Google Scholar]
- Becker JT, Sanders J, Madsen SK, Ragin A, Kingsley L, Maruca V, et al. Subcortical brain atrophy persists even in HAART-regulated HIV disease. Brain Imaging Behav. 2011 doi: 10.1007/s11682-011-9113-8. doi:10.1007/s11682-011-9113-8. [DOI] [PMC free article] [PubMed] [Google Scholar]
- Bridge TP. AIDS and HIV CNS disease: a neuropsychiatric disorder. Adv Biochem Psychopharmacol. 1988;44:1–13. [PubMed] [Google Scholar]
- Buechel C, Friston KJ. Characterising Functional Integration. In: Frackowiak RSJ, Friston KJ, Frith CD, Dolan RJ, Mazziotta JC, editors. Human Brain Function. Scademic Press; San Diego: 1997. pp. 127–140. [Google Scholar]
- Chang L, Ernst T, Ames N, Walot I, Jovicich J, DeSilva M, et al. Persistent brain abnormalities in antiretroviral-naive HIV patients 3 months after HAART. Antivir Ther. 2003;8(1):17–26. [PubMed] [Google Scholar]
- Chang L, Ernst T, St Hillaire C, Conant K. Antiretroviral treatment alters relationship between MCP-1 and neurometabolites in HIV patients. Antivir Ther. 2004a;9(3):431–440. doi: 10.1177/135965350400900302. [DOI] [PubMed] [Google Scholar]
- Chang L, Ernst T, Witt MD, Ames N, Galefsky M, Miller E. Relationships among brain metabolics, cognitive function, and viral loads in antiretroviral-naive HIV patients. Neuroimage. 2002;17(3):1638–1648. doi: 10.1006/nimg.2002.1254. [DOI] [PubMed] [Google Scholar]
- Chang L, Pee LP, Yiannoustos CT, Ernst T, Marra CM, Richards T, et al. A multicenter in vivo proton-MRS study of HIV-associated dementia and its relationship to age. Neuroimage. 2004b;23(4):1336–1347. doi: 10.1016/j.neuroimage.2004.07.067. [DOI] [PubMed] [Google Scholar]
- Cummings JL, Mega M, Gray K, Rosenberg-Thompson S, Carusi DA, Gornbein J. The neuropsychiatric inventory: Comprehensive assessment of psychopathology in dementia. Neurology. 1994;44:2308–2314. doi: 10.1212/wnl.44.12.2308. [DOI] [PubMed] [Google Scholar]
- Cysique LA, Maruff P, Brew BJ. Prevalence and pattern of neuropsychological impairment in human immunodeficiency virus-infected/acquired immunodeficiency syndrome (HIV/AIDS) patients across pre- and post-highly active antiretroviral therapy eras: A combined study of two cohorts. Journal of NeuroVirology. 2004;10(6):350–357. doi: 10.1080/13550280490521078. [DOI] [PubMed] [Google Scholar]
- Derogatis LR, Spencer PM. The Brief Symptom Inventory (BSI): Administration, Scoring, and Procedures Manual-I. Clinical Psychometrics Research; Baltimore: 1982. [Google Scholar]
- Engel AK, Fries P, Singer W. Dynamic predictions: oscillations and synchrony in top-down processing. Nat Rev Neurosci. 2001;2(10):704–716. doi: 10.1038/35094565. doi:10.1038/3509456535094565 [pii] [DOI] [PubMed] [Google Scholar]
- Ernst MD. A Basis for Exact Inference. Statistical Science. 2004;19(4):676–685. [Google Scholar]
- Ernst T, Chang L, Jovicich J, Ames N, Arnold S. Abnormal brain activation on functional MRI in cognitively asymptomatic HIV patients. Neurology. 2002;59(9):1343–1349. doi: 10.1212/01.wnl.0000031811.45569.b0. [DOI] [PubMed] [Google Scholar]
- Fries P. A mechanism for cognitive dynamics: neuronal communication through neuronal coherence. Trends Cogn Sci. 2005;9(10):474–480. doi: 10.1016/j.tics.2005.08.011. doi:S1364-6613(05)00242-1 [pii] 10.1016/j.tics.2005.08.011. [DOI] [PubMed] [Google Scholar]
- Friston KJ. Functional and effective connectivity in neuroimaging: A synthesis. Human Brain Mapping. 1994;2:56–78. [Google Scholar]
- Friston KJ, Frith CD, Liddle PF, Frackowiak RSJ. Functional connectivity: The principal-component analysis of large (PET) data sets. J Cereb Blood Flow Metab. 1993;13:5–14. doi: 10.1038/jcbfm.1993.4. [DOI] [PubMed] [Google Scholar]
- Heaton RK, Pendelton MG. Use of neuropsychological tests to predict adult patients’ everyday functioning. Journal of Consulting and Clinical Psychology. 1981;49:307–321. doi: 10.1037//0022-006x.49.6.807. [DOI] [PubMed] [Google Scholar]
- Herbster AN, Nichols T, Wiseman MB, Mintun MA, DeKosky ST, Becker JT. Functional connectivity in auditory verbal short-term memory in Alzheimer’s disease. Neuroimage. 1996;4:67–77. doi: 10.1006/nimg.1996.0030. [DOI] [PubMed] [Google Scholar]
- Hlaváčá-Schindler K, Palus M, Velmejka M, Bhattacharya J. Causality detection based on information-theoretic approaches in time series analysis. Physics Reports. 2007;441(1):1–46. [Google Scholar]
- Holmes AP, Blair RC, Watson JDG, Ford I. Nonparametric analysis of statistical images from functional mapping experiments. J Cereb Blood Flow Metab. 1996;16:7–22. doi: 10.1097/00004647-199601000-00002. [DOI] [PubMed] [Google Scholar]
- Lawton MP, Brody EM. Assessment of older people: Self-maintaining and instrumental activities of daily living. The Gerontologist. 1969;9:179–186. [PubMed] [Google Scholar]
- McIntosh AR, Grady CL, Ungerleider LG, Haxby JV, Rapoport SI, Horwitz B. Network analysis of cortical visual pathways mapped with PET. Journal of Neuroscience. 1994;14(2):655–666. doi: 10.1523/JNEUROSCI.14-02-00655.1994. [DOI] [PMC free article] [PubMed] [Google Scholar]
- Mueller SG, Weiner MW, Thal LJ, Petersen RC, Jack C, Jagust W, et al. The Alzheimer’s disease neuroimaging initiative. Neuroimaging Clin N Am. 2005;15(4):869–877. doi: 10.1016/j.nic.2005.09.008. [DOI] [PMC free article] [PubMed] [Google Scholar]
- Navia BA, Rostasy K. The AIDS dementia complex: clinical and basic neuroscience with implications for novel molecular therapies. Neurotox Res. 2005;8:3–24. doi: 10.1007/BF03033817. [DOI] [PubMed] [Google Scholar]
- Nichols TE, Holmes AP. Nonparametric permutation tests for functional neuroimaging: A primer with examples. Hum Brain Mapping. 2002;15(1):1–25. doi: 10.1002/hbm.1058. [DOI] [PMC free article] [PubMed] [Google Scholar]
- Oldfield RC. The assessment and analysis of handedness: the Edinburgh inventory. Neuropsychologia. 1971;9(1):97–113. doi: 10.1016/0028-3932(71)90067-4. [DOI] [PubMed] [Google Scholar]
- Papanicolaou AC, Simos PG, Castillo EM, Breier JI, Sarkari S, Pataraia E, et al. Magnetocephalography: a noninvasive alternative to the Wada procedure. J Neurosurg. 2004;100:867–876. doi: 10.3171/jns.2004.100.5.0867. [DOI] [PubMed] [Google Scholar]
- Paul RH, Yiannoutsos CT, Miller EN, Chang L, Marra CM, Schifitto G, et al. Proton MRS and neuropsychological correlates in AIDS dementia complex: evidence of subcortical specificity. J Neuropsychiatry Clin Neurosci. 2007;19(3):283–292. doi: 10.1176/jnp.2007.19.3.283. [DOI] [PubMed] [Google Scholar]
- Price RW, Epstein LG, Becker JT, Cinque P, Gisslen M, Pulliam L, et al. Biomarkers of HIV-1 CNS infection and injury. Neurology. 2007;69(18):1781–1788. doi: 10.1212/01.wnl.0000278457.55877.eb. [DOI] [PubMed] [Google Scholar]
- Sacktor N, Lyles RH, Skolasky R, Kleeberger C, Selnes OA, Miller EN, et al. HIV-associated neurologic disease incidence changes: Multicenter AIDS Cohort Study, 1990-1998. Neurology. 2001;56:257–260. doi: 10.1212/wnl.56.2.257. [DOI] [PubMed] [Google Scholar]
- Sacktor N, McDermott MP, Marder K, Schifitto G, Selnes OA, McArthur JC, et al. HIV-associated cognitive impairment before and after the advent of combination therapy. Journal of NeuroVirology. 2002;8:136–142. doi: 10.1080/13550280290049615. [DOI] [PubMed] [Google Scholar]
- Spitzer RL, Williams JBW, Giggon M, First MB. Structured Clinical Interview for DSM-III-R. Biometrics Research Department, NY State Psychiatric Institute; New York: 1990. [Google Scholar]
- Stam CJ, Jones BF, Manshanden I, van Cappellen van Walsum AM, Montez T, Verbunt JP, et al. Magnetoencephalographic evaluation of resting-state functional connectivity in Alzheimer’s disease. Neuroimage. 2006;32(3):1335–1344. doi: 10.1016/j.neuroimage.2006.05.033. doi:S1053-8119(06)00601-X [pii] 10.1016/j.neuroimage.2006.05.033. [DOI] [PubMed] [Google Scholar]
- Varela F, Lachaux JP, Rodriguez E, Martinerie J. The brainweb: phase synchronization and large-scale integration. Nat Rev Neurosci. 2001;2(4):229–239. doi: 10.1038/35067550. doi:10.1038/35067550 35067550 [pii] [DOI] [PubMed] [Google Scholar]
- Wang X, Foryt P, Ochs R, Chung JH, Wu Y, Parrish TB, et al. Abnormalities in Resting-State Functional Connectivity in Early Human Immunodeficiency Virus Infection. Brain Connectivity. 2011 Sep;1(3):207. doi: 10.1089/brain.2011.0016. 2011. doi:DOI: 10.1089/brain.2011.0016. [DOI] [PMC free article] [PubMed] [Google Scholar]
- Woods SP, Rippeth JD, Frol AB, Levy JK, Ryan E, Soukup VM, et al. Interrater reliability of clinical ratings and neurocognitive diagnoses in HIV. J Clin Exp Neuropsychol. 2004;26(6):759–778. doi: 10.1080/13803390490509565. [DOI] [PubMed] [Google Scholar]